University of Pennsylvania
ScholarlyCommons
Publicly Accessible Penn Dissertations
1-1-2015
Three Essays on Big Data Consumer Analytics in
E-Commerce
Dokyun Lee
University of Pennsylvania, [email protected]
Follow this and additional works at:
http://repository.upenn.edu/edissertations
Part of the
Advertising and Promotion Management Commons
,
Databases and Information
Systems Commons
, and the
Marketing Commons
This paper is posted at ScholarlyCommons.http://repository.upenn.edu/edissertations/1830 For more information, please [email protected].
Recommended Citation
Lee, Dokyun, "Three Essays on Big Data Consumer Analytics in E-Commerce" (2015).Publicly Accessible Penn Dissertations. 1830.
Three Essays on Big Data Consumer Analytics in E-Commerce
Abstract
Consumers are increasingly spending more time and money online. Business
to consumer e-commerce is growing on average of 20 percent each year and
has reached 1.5 trillion dollars globally in 2014. Given the scale and growth
of consumer online purchase and usage data, firms' ability to understand
and utilize this data is becoming an essential competitive strategy.
But, large-scale data analytics in e-commerce is still at its nascent stage and there
is much to be learned in all aspects of e-commerce. Successful analytics on big data often require a combination of both data mining and econometrics: data mining to reduce or structure
(from unstructured data such as text, photo, and video) large-scale data
and econometric analyses to truly understand and assign causality to interesting
patterns. In my dissertation, I study how firms can better utilize big data
analytics and specific applications of machine learning techniques for improved
e-commerce using theory-driven econometrical and experimental studies. I
show that e-commerce managers can now formulate data-driven strategies for
many aspect of business including cross-selling via recommenders on sales
sites to increasing brand awareness and leads via social media content-engineered-marketing.
These results are readily actionable with far-reaching economical consequences.
Degree Type
Dissertation
Degree Name
Doctor of Philosophy (PhD)
Graduate Group
Operations & Information Management
First Advisor
Keywords
big data, data mining, e-commerce, managerial implications, recommender system, social media marketing
Subject Categories
THREE ESSAYS ON BIG DATA CONSUMER ANALYTICS IN E-COMMERCE
Dokyun Lee
A DISSERTATION
in
Operation and Information Management
For the Graduate Group in Managerial Science and Applied Economics
Presented to the Faculties of the University of Pennsylvania
in
Partial Fulfillment of the Requirements for the
Degree of Doctor of Philosophy
2015
Supervisor of Dissertation
Kartik Hosanagar, Professor of OPIM
Graduate Group Chairperson
Eric Bradlow, Professor of Marketing, Statistics, and Education
Dissertation Committee
Kartik Hosanagar, Professor of Operations and Information Management
THREE ESSAYS ON BIG DATA CONSUMER ANALYTICS IN E-COMMERCE
© COPYRIGHT
2015
Dokyun Lee
This work is licensed under the
Creative Commons Attribution
NonCommercial-ShareAlike 3.0
License
To view a copy of this license, visit
Dedicated to my parents, Hongme and Sangwook,
ACKNOWLEDGEMENT
The five years I spent here has been the best time of my life thus far. I am grateful for the
best advisors and friendly colleagues who have helped and stimulated me throughout.
I would like to first thank my advisor, Kartik Hosanagar, who goes above and beyond for
his students with a style and grace. I would like to thank Lorin Hitt and Harikesh Nair for
being in my committee and for giving me valuable advices and feedbacks on both research
and career. I am blessed to have world-leading researchers and educators as my mentors,
who excel in advising and guiding as much as they do in researching and teaching. I learned
many things beyond researching from them and I hope to learn even more in the decades
to come. I am grateful for insightful discussions and general supports from Vibhanshu
Abhishek, Christophe Van den Bulte, Raghuram Iyengar, David Bell, Jonah Berger, Dylan
Small, Dean Foster, Paul Shaman, Lynn Wu, Xuanming Xu, Noah Gans, Eric Clemons,
Jing Peng, Fujie Jin, Eric Bradlow, Karl Ulrich, Jeff Cai, and Arun Gopalakrishnan.
I would like to thank the Baker Retailing Center, the William And Phyllis Mack Institute
for Innovation Management, Fishman-Davidson Center for Service and Operations
Man-agement, and Wharton Risk Management and Decision Processes Center for their generous
and instrumental financial support. I am grateful to Sargent Shriver, Andrea Nurse, Kim
Watford, Patricia James, Tara Mullins for all the administrative help and Stan Liu and
Jamie Walter for IT support.
Lastly, I would like to thank my parents for providing me with the best opportunities
possible for following any goals and dreams I have. They have been my role models all my
life and I am forever grateful for their steadfast support and unconditional sacrifice. Finally,
ABSTRACT
THREE ESSAYS ON BIG DATA CONSUMER ANALYTICS IN E-COMMERCE
Dokyun Lee
Kartik Hosanagar
Consumers are increasingly spending more time and money online. Business to consumer
e-commerce is growing on average of 20 percent each year and has reached 1.5 trillion
dollars globally in 2014. Given the scale and growth of consumer online purchase and usage
data, firms’ ability to understand and utilize this data is becoming an essential competitive
strategy. But, large-scale data analytics in e-commerce is still at its nascent stage and
there is much to be learned in all aspects of e-commerce. Successful analytics on big data
often require a combination of both data mining and econometrics: data mining to reduce
or structure (from unstructured data such as text, photo, and video) large-scale data and
econometric analyses to truly understand and assign causality to interesting patterns. In my
dissertation, I study how firms can better utilize big data analytics and specific applications
of machine learning techniques for improved e-commerce using theory-driven econometrical
and experimental studies. I show that e-commerce managers can now formulate data-driven
strategies for many aspect of business including cross-selling via recommenders on sales sites
to increasing brand awareness and leads via social media content-engineered-marketing.
TABLE OF CONTENTS
ACKNOWLEDGEMENT . . . iv
ABSTRACT . . . v
LIST OF TABLES . . . ix
LIST OF ILLUSTRATIONS . . . xi
CHAPTER 1 : Introduction . . . 1
CHAPTER 2 : The Effect of Social Media Marketing Content on Consumer Engage-ment: Evidence from Facebook . . . 5
2.1 Introduction . . . 5
2.2 Data . . . 12
2.3 Empirical Strategy . . . 29
2.4 Results . . . 37
2.5 Discussion and Managerial Implications . . . 50
2.6 Conclusions . . . 54
CHAPTER 3 : People Who Liked This Study Also Liked: The Impact of Recom-mender Systems on Sales Volume and Diversity . . . 56
3.1 Introduction . . . 56
3.2 Prior Work . . . 59
3.3 Problem Formulation . . . 64
3.4 Data . . . 69
3.5 Results . . . 72
CHAPTER 4 : When do Recommender Systems Work the Best? The Moderating
Effects of Product Attributes and Consumer Reviews on
Recom-mender Performance . . . 88
4.1 Introduction . . . 88
4.2 Data . . . 91
4.3 Product Attributes & Hypotheses . . . 95
4.4 Model & Results . . . 106
4.5 Conclusion and Discussion . . . 111
APPENDIX . . . 123
LIST OF TABLES
TABLE 1 : Variable Descriptions and Summary for Content-coded Data . . . . 18
TABLE 2 : Examples of Messages and Their Content Tags . . . 19
TABLE 3 : Performance of Text Mining Algorithm on 5000 Messages Using 10-fold Cross-validation . . . 28
TABLE 4 : User-level Setup Notation. . . 31
TABLE 5 : EdgeRank Model Estimates . . . 39
TABLE 6 : Persuasive vs Informative . . . 41
TABLE 7 : Aggregate Logistic Regression Results For Comments and Likes . . 45
TABLE 8 : Predicted versus Actual Engagement Ranking for Three Illustrative messages . . . 53
TABLE 9 : Literature on Impact of Recommender Systems and Claims . . . . 63
TABLE 10 : Movie Genres Viewed and Purchased . . . 71
TABLE 11 : Data Summary Statistics . . . 73
TABLE 12 : Individual Item Views Comparison . . . 76
TABLE 13 : Individual Item Purchases Comparison . . . 76
TABLE 14 : Individual Wallet-Size Comparison . . . 77
TABLE 15 : Aggregate View Diversity . . . 78
TABLE 16 : Aggregate Sales Diversity . . . 78
TABLE 17 : Individual View Diversity . . . 79
TABLE 18 : Individual Purchase Diversity . . . 80
TABLE 19 : Hypotheses Tested . . . 82
TABLE 20 : Permutation Test Results for Co-purchase Network Comparisons . 83 TABLE 21 : Hypotheses under Robustness Checks . . . 86
TABLE 23 : Variable Descriptions and Summary for Content-coded Data. . . . 94
TABLE 24 : Utilitarian VS. Hedonic Product Cluster Means . . . 99
TABLE 25 : Search VS. Experience Product Cluster Means . . . 103
TABLE 26 : Logistic Regression Results Table . . . 107
TABLE 27 : Multiple Specifications for Review Related Variables . . . 110
TABLE 28 : Hypotheses and Results . . . 110
TABLE 29 : Other Takeaways . . . 111
TABLE 30 : A Few Examples of Message Attributes Used in Natural Language Processing Algorithm . . . 120
TABLE 31 : Performance of Text Mining Algorithm on 5000 Messages Using 10-fold Cross-validation . . . 121
LIST OF ILLUSTRATIONS
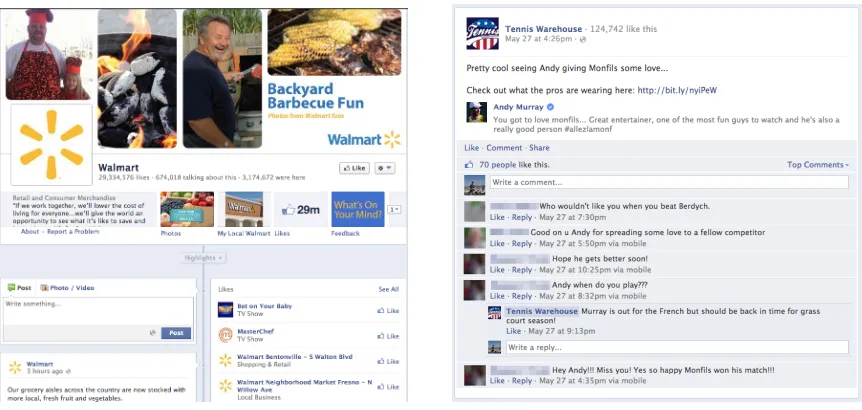
FIGURE 1 : (Left) Example of a firm’s Facebook Page (Walmart). (Right)
Ex-ample of a firm’s message and subsequent user engagement with
that message (Tennis Warehouse). Example is not necessarily from
our data. . . 13
FIGURE 2 : Co-occurrence of Attribute Characteristics Across messages . . . . 20
FIGURE 3 : Bubble Chart of Broader Industry Category vs Message Content . 21 FIGURE 4 : Box Plots of Log(engagement+1) vs Time since message Release . 22 FIGURE 5 : AverageLikes and Comments by Message Type . . . 23
FIGURE 6 : AverageLikes and Comments by Message Type by Industry . . . 23
FIGURE 7 : AverageLikes and Comments by Message Content . . . 24
FIGURE 8 : Cronbach’s Alphas for 5,000 Messages . . . 25
FIGURE 9 : Impression-Engagement Funnel . . . 31
FIGURE 10 : Page-level Fixed effect Estimates from Generalized Additive Model Across 14 Demographic Bins . . . 40
FIGURE 11 : Time Since message Release (τ) Coefficients Box plot Across De-mographics . . . 40
FIGURE 12 : Message Characteristic Coefficients for Comments andLikes . . . 46
FIGURE 13 : Logistic Regression by Industry . . . 47
FIGURE 14 : Proportion of Content Posted Split into Hour-bin . . . 49
FIGURE 15 : Message Characteristic Coefficients for Shares and Click-throughs 52 FIGURE 16 : Lorenz Curve . . . 65
FIGURE 17 : Recommender Example . . . 70
FIGURE 18 : Average Individual Statistics . . . 74
FIGURE 20 : Co-Purchase Network Graphs of Genre Purchases under Control
and Purchase-Based Collaborative Filtering. . . 83
FIGURE 21 : Genre Purchase Share Comparison on Purchase-based CF vs. Control 84
FIGURE 22 : Recommendation Panel . . . 93
FIGURE 23 : Survey Form Used in Amazon Mechanical Turk . . . 113
CHAPTER 1 : Introduction
Consumers are increasingly spending more time and money online. A 2013 study
(eMar-keter, 2013b) reports that for the first time, the average adult in the US will spend more
time online than watching TV at just above five hours per day. The spread of mobile devices
like smartphones and tablet PCs are also fueling this dramatic increase in consumer online
activities. Consequently, e-commerce is growing faster than ever. Business to consumer
e-commerce is growing on average of 20% each year and has reached $1.5 trillion globally
in 2014 (eMarketer, 2014).
This growth in online activity has given arise to a new phenomenon called “big data”. “Big
data” is a catch-phrase used to describe massive data recorded online (e.g., e-commerce,
search engine) and offline by a myriad of sensors (e.g., surveillance, traffic monitor). The
term is used to describe four different aspects of challenges arising from exploding data: 1)
Volume, which refers to the sheer amount of volume recorded1; 2) Variety, arising from
un-structured data like text and photos that come from numerous sources such as social media
sites; 3) Velocity, which refers to the speed at which data gets recorded; and 4) Veracity,
which refers to the uncertainty and missing data. The “big data” phenomenon has created
problems and challenges to virtually everyone including marketers, business managers,
aca-demics, and policy makers: How can big data be utilized for improved marketing, business
managing, and policy making?
Given the scale and growth of consumer online purchase and usage data, firms’ ability to
understand and utilize this big data is becoming an essential competitive strategy. Several
academic and industry reports (Kiron et al., 2011; Rogers and Sexton, 2012; Monetate,
2014a,b) show that while 63% of organizations see big data analytics as a competitive
advantage, 80% of marketers say they don’t know how to translate data into action and
that 95% of data within organizations remain unused. Even more perplexing, one survey
1
(Allen et al., 2005) shows that while 80% of CEOs believe they deliver superior customer
experience, only 8% of customers agree. Big data analytics in e-commerce is still at its
nascent stage and there is much to be learned in all aspects of e-commerce. Particularly
lacking is the area of social media marketing (specifically, content engineering for better
engagement) and the impact of recommender systems, in which there are little to no
large-scale level analyses or much disagreement on what strategies actually work.
Big data analytics is challenging because successful analytics on big data often require a
combination of both data mining and econometrics: Data mining to reduce or structure
(from unstructured data such as text, photo, and video) large-scale data and econometric
analyses to truly understand and assign causality to interesting patterns. In my
disserta-tion, I study how firms can better utilize big data analytics and specific applications of
machine learning techniques for improved e-commerce using theory-driven econometrical
and experimental studies. Specifically, in the first essay, I investigate how firms can actively
content engineer their social media page postings (e.g., Facebook Pages and Twitter) to
better engage connected consumers. In the second essay, I investigate how different
recom-mender algorithms on e-commerce sites (e.g., Amazon.com’s “Consumers who purchased
this also purchased”) influence sales volume and diversity. In the third essay, I plan to study
how product attributes and reviews moderate the performance of recommender systems.
Based on completed results, it can be observed that big data analytics that combine data
mining and econometrical studies can provide readily actionable strategies to improve many
aspects of e-commerce with far-reaching economical consequences. A detailed description
of three essays is given below.
Essay 1- The Effect of Social Media Marketing Content on Consumer
Engage-ment: Evidence from Facebook We investigate the effect of social media content on
customer engagement using a large-scale field study on Facebook. We content-code more
than 100,000 unique messages across 800 companies engaging with users on Facebook using
Process-ing algorithms. We use this large-scale database of advertisProcess-ing attributes to test the effect
of ad content on subsequent user engagement defined as Likes and comments − with the
messages. We develop methods to account for potential selection biases that arise from
Facebook’s filtering algorithm, EdgeRank, that assigns posts non-randomly to users. We
find that inclusion of persuasive content − like emotional and philanthropic content−
in-creases engagement with a message. We find that informative content − like mentions of
prices, availability and product features − reduce engagement when included in messages
in isolation, but increase engagement when provided in combination with persuasive
at-tributes. Persuasive content thus seems to be the key to effective engagement. Our results
inform advertising design in social media, and the methodology we develop to content-code
large-scale textual data provides a framework for future studies on unstructured natural
language data such as advertising content or product reviews.
Essay 2- “People Who Liked This Study Also Liked”: An Empirical
Investi-gation of the Impact of Recommender Systems on Sales Volume and Diversity
We investigate the impact of collaborative filtering recommender algorithms (e.g.,
Ama-zon.com’s “Customers who bought this item also bought”), commonly used in e-commerce,
on sales volume and diversity. We use data from a randomized field experiment on movie
sales run by a top retailer in North America. For sales volume, we show that different
al-gorithms have differential impacts. Purchase-based collaborative filtering (“Customers who
bought this item also bought”) causes a 25% lift in views and a 35% lift in the number of
items purchased over the control group (no recommender). In contrast, View-based
collab-orative filtering (“Customers who viewed this item also viewed”) shows only a 3% lift in
views and a 9% lift in the number of items purchased, albeit not statistically significant. For
sales diversity, we find that collaborative filtering algorithms cause individuals to discover
and purchase a greater variety of products but push users to the same set of titles, leading
to concentration bias at the aggregate level. We show that this differential impact on
in-dividual versus aggregate diversity is caused by users exploring into only a few ’pathway’
few popular genres rather than uniformly aiding discovery in all genres. For managers, our
results inform personalization and recommender strategy in e-commerce. From an academic
standpoint, we provide the first empirical evidence from a randomized field experiment to
help reconcile opposing views on the impact of recommenders on sales diversity.
Essay 3- When do Recommender Systems Work the Best? The Moderating
Effects of Product Attributes and Consumer Reviews on Recommender
Perfor-mance We investigate the moderating effect of product attributes and consumer reviews
on the efficacy of a collaborative filtering recommender system on an e-commerce site. We
run a randomized field experiment on a top North American retailer’s website with 184,375
users split into a recommender-treated group and a control group with 37,215 unique
prod-ucts in the dataset. By augmenting the dataset with Amazon Mechanical Turk tagged
product attributes and consumer reviews from the website, we study their moderating
in-fluence on recommenders in generating conversion.
We first confirm that the use of recommenders increases the baseline conversion rate by
5.9%. We find that recommenders act as substitutes for high average review ratings and
review volumes with the effect of using recommenders increasing the conversion as much
as about two additional average star ratings. Additionally, we find that positive impact
on conversion from recommenders are greater for hedonic products compared to utilitarian
products while search-experience quality did not have any impact. Lastly, we find that
the higher the price, the lower the positive impact of recommenders, while providing more
product descriptions increased the recommender effectiveness.
For managers, we 1) identify the products with which to use recommenders and 2) show
how other product information sources on e-commerce sites interact with recommenders.
From an academic standpoint, we provide insight into the underlying mechanism behind
CHAPTER 2 : The Effect of Social Media Marketing Content on Consumer
Engagement: Evidence from Facebook
2.1. Introduction
Social networks are increasingly taking up a greater share of consumers’ time spent online.
As a result, social media — which includes advertising on social networks and/or marketing
communication with social characteristics — is becoming a larger component of firms’
mar-keting budgets. Surveying 4,943 marketing decision makers at U.S. companies, the 2013
Chief Marketing Officer survey (www.cmosurvey.org) reports that expected spending on
social media marketing will grow from 8.4%s of firms’ total marketing budgets in 2013 to
about 22% in the next five years. As firms increase their social media activity, the role
of content engineering has become increasingly important. Content engineering seeks to
develop content that better engages targeted users and drives the desired goals of the
mar-keter from the campaigns they implement. This raises the question: what content works
best? The most important body of academic work on this topic is the applied psychology
and consumer behavior literature which has discussed ways in which the content of
market-ing communication engages consumers and captures attention. However, most of this work
has tested and refined theories about content primarily in laboratory settings. Surprisingly,
relatively little has been explored systematically about the empirical consequences of
adver-tising and promotional content in real-world, field settings outside the laboratory. Despite
its obvious relevance to practice, Marketing and advertising content is also relatively under
emphasized in economic theory. The canonical economic model of advertising as a signal
(c.f. Nelson (1970); Kihlstrom and Riordan (1984); Milgrom and Roberts (1986)) does not
postulate any direct role for ad content because advertising intensity conveys all relevant
information about product quality in equilibrium to market participants. Models of
infor-mative advertising (c.f. Butters (1977); Grossman and Shapiro (1984)) allow for advertising
to inform agents only about price and product existence — yet, casual observation and
adver-tisements contain much more information and content beyond prices. In this paper, we
explore the role of content in driving consumer engagement in social media in a large-scale
field setting. We document the kinds of content used by firms in practice. We show that
a variety of emotional, philanthropic, and informative advertising content attributes affect
engagement and that the role of content varies significantly across firms and industries. The
richness of our engagement data and the ability to content code social media messages in
a cost-efficient manner enables us to study the problem at a larger scale than much of the
previous literature on the topic.
Our analysis is of direct relevance to industry in better understanding and improving firms’
social media marketing strategies. Many industry surveys (Ascend2, 2013; Gerber, 2014;
eMarketer, 2013a; SmartBrief, 2010; Ragan and Solutions, 2012) report that achieving
en-gagement on large audience platforms like Facebook is the top most important social
me-dia marketing goals for consumer-facing firms.1Social media marketing agencies’s financial
arrangements are increasingly contracted on the basis of the engagement these agencies
promise to drive for their clients. In the early days of the industry, it was thought that
engagement was primarily driven by the volume of users socially connected to the brand by
increasing the reach of posts released by the firms. Accordingly, firms aggressively acquired
fans and followers on platforms like Facebook by investing heavily in ads on the network.
However, early audits of the data (e.g., Creamer 2012) suggested that only about 1% of
an average firm’s Facebook fans show any engagement with the brand by Liking, sharing,
or commenting on messages by the brand on the platform. As a result, industry
atten-tion shifted from acquisiatten-tion of social media followers per se, to the design of content that
achieves both better reach and engagement amongst social media followers, especially since
the design of websites like Facebook also uses current engagement level to determine firms’
future reach. In a widely reported example that reflects this trend (WSJ, 2012), General
Motors curtailed its annual spending of$10M on Facebook’s paid ads (a vehicle for
acquir-1
ing new fans for the brand), choosing instead to focus on creating content for its branded
Facebook Page, on which it spent $30M. While attention in industry has shifted towards
content in this manner, industry still struggles with understanding what kinds of content
work better for which firms and in what ways. For example, are messages seeking to inform
consumers about product or price attributes more effective than persuasive messages with
humor or emotion? Do messages explicitly soliciting user response (e.g., “Like this post
if . . . ”) draw more engagement or in fact turn users away? Does the same strategy apply
across different industries? Our paper systematically explores these kinds of questions and
contributes to the formulation of better content engineering policies in practice.2
Our empirical investigation is implemented on Facebook, which is the largest social media
platform in the world. As alluded to above, many top brands now maintain a Facebook
page from which they serve posts and messages to connected users. This is a form of free
social media marketing that has increasingly become a popular and important channel for
marketing. Our data comprises information on about 100,000 such messages posted by a
panel of about 800 firms over a 11-month period between September 2011 and July 2012.
For each message, our data also contains time-series information on two kinds of
engage-ment measures — Likes and comments — observed on Facebook. In addition, we have
cross-sectional data on shares and click-throughs. We supplement these engagement data
with message attribute information that we collect using a large-scale survey we implement
on Amazon Mechanical Turk (henceforth “AMT”), combined with a Natural Language
Processing algorithm (henceforth “NLP”) we build to tag messages. We incorporate new
methods and procedures to improve the accuracy of content tagging on AMT and our NLP
algorithm. As a result, our algorithm achieves great accuracy, recall, and precision under
10-fold cross validation for almost all tagged content profiles.3We believe the methods we
2
As of December 2013, industry-leading social media analytics firms such as Wildfire (now part of Google) do not offer detailed content engineering analytics connecting a wide variety of social media content with real engagement data. Rather, to the best of our knowledge, they provide simpler analytics such as optimizing the time-of-the-day or day-of-the-week to post and whether to include pictures or videos.
3
develop will be useful in future studies analyzing other kinds of advertising content and
product reviews.
Our data has several advantages that facilitate a detailed study of content. First, Facebook
messages have rich content attributes (unlike say, Twitter tweets, which are restricted to
140 characters) and rich data on user engagement. Second, Facebook requires real names
and, therefore, data on user activity on Facebook is often more reliable compared to other
social media sites. Third, engagement is measured on a daily basis (panel data) by actual
message-level engagement such asLikes and comments that are precisely tracked within a
closed system. These aspects make Facebook an almost ideal setting to study the role of
content for this type of marketing communication.
Our strategy for coding content is motivated by the psychology, marketing and economic
literatures on advertising (see Cialdini (2001); Bagwell (2007); Berger (2012); Chandy et al.
(2001); Vakratsas and Ambler (1999) for some representative overviews). In the economics
literature, it is common to classify advertising as informative (shifting beliefs about product
existence or prices) or persuasive (shifting preferences directly). The basis of informative
content is limited to prices and/or existence, and persuasive content is usually treated as a
“catch-all” without finer classification. Rather than this coarse distinction, our
classifica-tion follows the seminal classificaclassifica-tion work of Resnik and Stern (1977), who operaclassifica-tionalize
informative advertising based on the number of characteristics of informational cues (see
Abernethy and Franke, 1996 for an overview of studies in this stream). Some criteria for
classifying content as informative include details about products, promotions, availability,
price, and product related aspects that could be used in optimizing the purchase
deci-sion. Following this stream, any product oriented facts, and brand and product mentions
are categorized as informative content. Following suggestions in the persuasion literature
(Cialdini, 2001; Nan and Faber, 2004; Armstrong, 2010; Berger, 2012), we classify
“per-suasive” content as those that broadly seek to influence by appealing toethos,pathos, and
logos strategies. For instance, the use of a celebrity to endorse a product or attempts to
gain trust or good-will (e.g., via small talk, banter) can be construed as the use ofethos —
appeals through credibility or character — and a form of persuasive advertising. Messages
with philanthropic content that induce empathy can be thought of as an attempt at
per-suasion via pathos — an appeal to a person’s emotions. Lastly, messages with unusual or
remarkable facts that influence consumers to adopt a product or capture their attention can
be categorized as persuasion via logos — an appeal through logic. We categorize content
that attempt to persuade and promote relationship building in this manner as persuasive
content. Though we believe we consider a larger range of content attributes than the
exist-ing literature, it is practically impossible to detail the full range of possible content profiles
produced on a domain as large as Facebook (or in a data as large as ours). We choose
content profiles that reflect issues flagged in the existing academic literature and those that
are widely used by companies on Facebook. We discuss this in more detail in Section 2.2.
Estimation of the effect of content on subsequent engagement is complicated by the
non-random allocation of messages to users implemented by Facebook via its EdgeRank
algo-rithm. EdgeRank tends to serve to users messages that are newer and are expected to appeal
better to his/her tastes. We account for the selection induced byEdgeRank by developing a
semi-parametric correction for the filtering it induces. One caveat to the correction is that
it is built on prior (but imperfect) knowledge of how EdgeRank is implemented. In the
ab-sence of additional experimental/exogenous variation, we are unable to address all possible
issues with potential nonrandom assignment perfectly. We view our work as a large-scale,
and relatively exhaustive exploratory study of content variables in social media that could
be the basis of further rigorous testing and causal assessment, albeit at a more limited scale.
A fully randomized large-scale experiment that provides a cross-firm and cross-industry
as-sessment like provided here may be impossible or cost-prohibitive to implement, and hence,
we think a large-scale cross-industry study based on field data of this sort is valuable.
engagement significantly. Additionally, informative content tends to drive engagement
pos-itively only when combined with such content. Persuasive content thus seem to be the key
to effective content engineering in this setting. This finding is of substantive interest
be-cause most firms post messages with one content type or other, rather than in combination.
Our results suggest therefore that there may be substantial gains to content engineering
by combining characteristics. The empirical results also unpack the persuasive effect into
component attribute effects and also estimate the heterogeneity in these effects across firms
and industries, enabling fine tuning these strategies across firms and industries.
Our paper adds to a growing literature on social media. Studies have examined the the
dif-fusion of user-generated content (Susarla et al., 2012) and their impact on firm performance
(Rui et al., 2013; Dellarocas, 2006). A few recent papers have also examined the social
me-dia strategies of firms, focusing primarily on online blogs and forums. These include studies
of the impacts of negative blog messages by employees on blog readership (Aggarwal et al.,
2012), blog sentiment and quality on readership (Singh et al., 2014), social product features
on consumer willingness to pay (Oestreicher-Singer and Zalmanson, 2013), and the role of
active contributors on forum participation (Jabr et al., 2014). We add to this literature by
examining the impact of firms’ content strategies on user engagement.
An emerging theoretical literature in advertising has started to investigate the effects of
content. This includes new models that allow ad content to matter in equilibrium by
augmenting the canonical signaling model in a variety of ways (e.g. Anand and Shachar
(2009)) by allowing ads to be noisy and targeted; Anderson and Renault (2006) by allowing
ad content to resolve consumers’ uncertainty about their match-value with a product; and
Mayzlin and Shin (2011) and Gardete (2013) by allowing ad content to induce consumers
to search for more information about a product). Our paper is most closely related to a
small empirical literature that has investigated the effects of ad content in field settings.
These include Bertrand et al. (2010) (effect of direct-mail ad content on loan demand);
and online sales); Tucker (2012b) (effect of ad persuasion on YouTube video sharing) and
Tucker (2012a) (effect of “social” Facebook ads on philanthropic participation). Also related
are recent studies exploring the effect of content more generally (and not specifically ad
content) including Berger and Milkman (2012) (effect of emotional content in New York
Times articles on article sharing) and Gentzkow and Shapiro (2010) (effect of newspaper’s
political content on readership). Relative to these literatures, our study makes two main
contributions. First, from a managerial standpoint, we show that while persuasive ad
content — especially emotional and philanthropic content — positively impacts consumer
engagement in social media, informative content has a negative effect unless it is combined
with persuasive content attributes. This can help drive content engineering policies in firms.
We also show how the effects differ by industry type. Second, none of the prior studies on
ad content have been conducted at the scale of this study, which spans a large number of
industries. The rigorous content-tagging methodology we develop, which combines surveys
implemented on AMT with NLP-based algorithms, provides a framework to conduct
large-scale studies that analyze the content of marketing communication.
Finally, the reader should note we do not address the separate but important question of how
engagement affects product demand and firm’s profits so as to complete the link between
ad-attributes and those outcome measures. First, the data required for the analysis of this
question at a scale comparable to this study are still not widely available to researchers.
Second, as mentioned, firms and advertisers care about engagementper seand are willing to
invest in advertising for generating engagement, rather than caring only about sales. This
is consistent with our view that advertising is a dynamic problem and a dominant role of
advertising is to build long-term brand-capital for the firm. Even though the current period
effects of advertising on demand may be small, the long-run effect of advertising may be
large, generated by intermediary activities like increased consumer engagement, increased
awareness and inclusion in the consumer consideration set. Thus, studying the formation
and evolution of these intermediary activities — like engagement — is worthwhile in order
settings. We note other papers such as Kumar et al. (2013); Goh et al. (2013); Rishika et al.
(2013); Li and Wu (2013); Miller and Tucker (2013); Sunghun et al. (2014); Luo and Zhang
(2013); Luo et al. (2013) as well as industry reports (comScore, 2013;
Chadwick-Martin-Bailey, 2010; 90octane, 2012; HubSpot, 2013) have linked the social media engagement
measures we consider to customer acquisition, sales, and profitability metrics.
2.2. Data
Our dataset is derived from the “pages” feature offered by Facebook. The feature was
introduced on Facebook in November 2007. Facebook Pages enable companies to create
profile pages and to post status updates, advertise new promotions, ask questions and push
content directly to consumers. The left panel of Figure 1 shows an example of Walmart’s
Facebook Page, which is typical of the type of pages large companies host on the social
network. In what follows, we use the terms pages, brands, and firms interchangeably. Our
data comprises posts served from firms’ pages onto the Facebook profiles of the users that
are linked to the firm on the platform. To fix ideas, consider a typical message (see the
right panel of Figure 1): “Pretty cool seeing Andy giving Monfils some love. . . Check out
what the pros are wearing here: http://bit.ly/nyiPeW.”4In this status update, a tennis
equipment retailer starts with small talk, shares details about a celebrity (Andy Murray
and Gael Monfils) and ends with link to a product page. Each such message is a unit of
analysis in our data.
2.2.1. Data Description
Raw Data and Selection Criteria
To collect the data, we partnered with an anonymous firm, henceforth referred to as
Com-pany X that provides analytics services to Facebook Page owners by leveraging data from
Facebook’s Insights. Insights is a tool provided by Facebook that allows page owners to
monitor the performance of their Facebook messages. Company X augments data from
4
Figure 1: (Left) Example of a firm’s Facebook Page (Walmart). (Right) Example of a firm’s message and subsequent user engagement with that message (Tennis Warehouse). Example is not necessarily from our data.
Facebook Insights across a large number of client firms with additional records of daily
message characteristics, to produce a raw dataset comprising a message-day-level panel of
messages posted by companies via their Facebook pages. The data also includes two
con-sumer engagement metrics: the number ofLikes and comments for each message each day.
These metrics are commonly used in industry as measures of engagement. They are also
more granular than other metrics used in extant research such as the number of fans who
haveLiked the page. Also available in the data are the number of impressions of each
mes-sage per day (i.e., the total number of users the mesmes-sage is exposed to - we have both the
unique user impression and the total impression). In addition, page-day level information
such as the aggregate demographics of users (fans) whoLiked the page on Facebook or have
ever seen messages by the page are collected by Company X on a daily level. This comprises
the population of users a message from a firm can potentially be served to. We leverage this
information in the methodology we develop later for accounting for non-random assignment
of messages to users by Facebook. Once a firm serves a message, the message’s
126 days).5The raw data contains about a million unique messages by about 2,600 unique
companies.
The reader should note that as of this writing, our data is the most complete observational
data available outside of Facebook — the data includes details such as demographics of page
fans and engaged fans, which cannot be scraped by outsiders (but are essential for correcting
for EdgeRank) but are available only to the page owners via Facebook’s Application
Pro-gramming Interface. Our data also includes daily snapshots of message-level engagement
that Facebook does provide to page owners (Page owners must take snapshots themselves
if they want this data). These daily snapshots generate the within-message variation that
enables the panel analysis in our paper. Finally, page-owners do not have access to data on
performance of any messages by other pages, unlike our dataset which spans a large number
of companies across sectors.
We clean the data to reflect the following criteria:
• Only pages located in the US, and,
• Only messages written in English, and,
• Only messages with complete demographics data.
After cleaning, the data span 106,316 unique messages posted by 782 companies (including
many large brands) between September 2011 and July 2012. This results in about 1.3 million
rows of message-level daily snapshots recording about 450 million page fans’ responses.
Removing periods after which no significant activity is observed for a message reduces this
to 665,916 rows of message-level snapshots (where activity is defined as either impressions,
Likes, or comments). The companies in our dataset are categorized into 6 broader industry
categories following Facebook’s page classification criteria: Celebrities & Public Figure (e.g.,
Roger Federer), Entertainment (e.g., Star Trek), Consumer Products & Brands (e.g., Tesla
5
Motors), Organizations & Company (e.g., WHO), Websites (e.g., TED), Local Places &
Businesses (e.g., MoMA).
Content-coded Data
We use a two-step method to label content. First, we contract with workers through AMT
and tag 5,000 messages for a variety of content profiles. Subsequently, we build an NLP
algorithm by combining several statistical classifiers and rule-based algorithms to extend
the content-coding to the full set of 100,000 messages. This algorithm uses the 5,000
AMT-tagged messages as the training data-set. We describe these methods in more detail later
in the paper.
The content in Facebook messages can be categorized as informative, persuasive, or both.
Some messages inform consumers about deals and discounts about products, while other
messages seek to connect with consumers on a personal level to promote brand personality,
form relationships and are social in nature. We call the first type informative content,
and the second persuasive content. Some messages do both at the same time by including
casual banter and product information simultaneously (e.g., “Are you a tea person or a coffee
person? Get your favorite beverage from our website: http://www.specific-link-here.
com”).
Table 1 outlines the finer classification of the attributes we code up, including precise
defini-tions, summary statistics, and the source for coding the attribute. In Table 1, the 8 variables:
BRANDMENTION, DEAL, PRICECOMPARE, PRICE, TARGET, PRODAVAIL,
PROD-LOCATION, and PRODMENTION are informative. These variables enable us to assess
the effect of search attributes, brand, price, and product availability information on
en-gagement. The 8 variables: REMFACT, EMOTION, EMOTICON, HOLIDAYMENTION,
HUMOR, PHILANTHROPIC, FRIENDLIKELY, and SMALLTALK are classified as
per-suasive. These definitions include emotional content, humor, banter, and philanthropic
Informative content variables are identified using the seminal work by Resnik and Stern
(1977), which provides an operational guideline to identify informative content. Their work
provides fourteen evaluative content criteria to identify informative content that includes
content such as product price and availability. Our persuasive content are identified mostly
from existing consumer behavior research. For example, emotional and humorous content
have been identified as drivers of word-of-mouth and of viral marketing tactics (Porter and
Golan, 2006; Berger, 2012, 2011; Berger and Milkman, 2012). Philanthropic content has
been studied in the context of advertising effectiveness (Tucker, 2012a). Similarly, Berger
and Schwartz (2011) documented that the interestingness of content such as mentions of
remarkable facts is effective in generating word-of-mouth. For a survey of papers motivating
our choice of persuasive variables, see Berger (2012). While not fully exhaustive, we have
attempted to cover most variables that are 1) highlighted by prior academic research to be
relevant, 2) commonly discussed and used in the industry.
Besides these main variables of interest, controls and content-related patterns noted as
important in industry reports are profiled. We include these content categories to
inves-tigate more formally considerations laid out in industry white papers, trade-press articles,
and blogs about the efficacy of message attributes in social media engagement. It includes
content that explicitly solicits readers to comment or includes blanks for users to fill out
(thus providing an explicit option to facilitate engagement). Additionally, characteristics
like whether the message contained photos, website links, and the types of the page-owner
(e.g., business organization versus celebrity) are also coded. Other message-specific
char-acteristics and controls include metrics such as message length in characters and SMOG
(“Simple Measure of Gobbledygook”), an automatically computed reading complexity index
that is used widely. Higher values of SMOG implies a message is harder to read. Table 2
shows sample messages taken from Walmart’s page in December 2012 and shows how we
would have tagged them. The reader should note that some elements of content tagging
and classification are necessarily subjective and based on human judgement. We discuss our
All things considered, we believe this is one of the most comprehensive attempts at tagging
marketing communication related content in the empirical literature.
Data Descriptive Graphics
This section presents descriptive statistics of the main stylized patterns in the data. The
first thing we would like to report is what kinds of content are used by firms (this may
be useful for instance, for a researcher interested in studying the role of specific content
profiles in Facebook, who would like to know what content variables are used a lot by firms).
Table 1 reports on the mean proportion of messages that have each content characteristic.
One can see that messages with videos, product or holiday mentions or emoticons are
relatively uncommon, while those with smalltalk and with information about where to
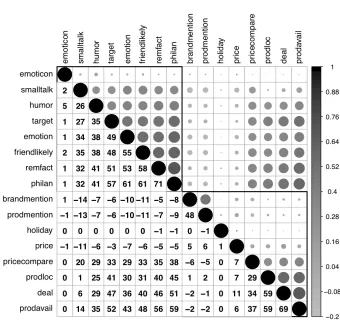
obtain the product (location/distribution attributes) are very common. Figure 2 reports
on the co-occurrence of the various attributes across messages. The patterns are intuitive.
For instance, emotional and philanthropic content co-occur often, so does emotional and
friend-like content, as well as content that describes product deals and availability. To
better describe the correlation matrix graphically and to cluster highly correlated variables
together, we ran cluster analysis to determine the optimal number of clusters using the
average silhouette width (Rousseeuw, 1987), which suggested that there are two clusters in
the data. Figure 2 shows via a solid line how content types are clustered across messages.6We
see that persuasive content types and informative content types are split into two separate
clusters, suggesting that firms typically tend to use one or the other in their messages. Later
in the paper, we show evidence suggesting that this strategy may not be optimal. Figure 3
shows the percentage of messages featuring a content attribute split by industry category.
We represent the relative percentages in each cell by the size of the bubbles in the chart.
The largest bubble is SMALLTALK for the celebrities category (60.4%) while the smallest
is PRICECOMPARE for the celebrities category (0%). This means that 6 in 10 messages by
celebrity pages in the data have some sort of small talk (banter) and/or content that does
6
Variable Description Source Mean SD Min Max
TAU (τ) Time since the post release (Day) Facebook 6.253 3.657 1 16 LIKES Number of “Likes” post has obtained Facebook 48.373 1017 0 324543 COMMENTS Number of “Comments” post has obtained Facebook 4.465 78.19 0 22522 IMPRESSIONS Number of times message was shown to users (unique) Facebook 9969.2 129874 1 4.5×10⁷
SMOG SMOG readability index (higher means harder to read) Computed 7.362 2.991 3 25.5
MSGLEN Message length in characters Computed 157.41 134.54 1 6510
HTTP Message contains a link Computed 0.353 0.478 0 1
QUESTION Message contains questions Computed 0.358 0.479 0 1
BLANK Message contains blanks (e.g. “My favorite artist is ”) Computed 0.010 0.099 0 1 ASKLIKE Explicit solicitation for “Likes” (e.g. “Like if . . . ”) Computed 0.006 0.080 0 1 ASKCOMMENT Explicit solicitation for “Comments” Computed 0.001 0.029 0 1
Persuasive
REMFACT Remarkable fact mentioned AMT 0.527 0.499 0 1
EMOTION Any type of emotion present AMT 0.524 0.499 0 1
EMOTICON Contains emoticon or net slang (approximately 1000 scraped from web emoticon dictionary e.g. :D, LOL)
Computed 0.012 0.108 0 1
HOLIDAYMENTION Mentions US Holidays Computed 0.006 0.076 0 1
HUMOR Humor used AMT 0.375 0.484 0 1
PHILANTHROPIC Philanthropic or activist message AMT 0.498 0.500 0 1 FRIENDLIKELY Answer to question: “Are your friends on social media likely to
post message such as the shown”?
AMT 0.533 0.499 0 1 SMALLTALK Contains small talk or banter (defined to be content other than
about a product or company business)
AMT 0.852 0.355 0 1
Informative
BRANDMENTION Mentions a specific brand or organization name AMT+Comp 0.264 0.441 0 1 DEAL Contains deals: any type of discounts and freebies AMT 0.620 0.485 0 1 PRICECOMPARE Compares price or makes price match guarantee AMT 0.442 0.497 0 1
PRICE Contains product price AMT+Comp 0.051 0.220 0 1
TARGET Message is targeted towards an audience segment (e.g. demographics, certain qualifications such as “Moms”)
AMT 0.530 0.499 0 1 PRODAVAIL Contains information on product availability (e.g. stock and
release dates)
AMT 0.557 0.497 0 1 PRODLOCATION Contains information on where to obtain product (e.g. link or
physical location)
AMT 0.690 0.463 0 1 PRODMENTION Specific product has been mentioned AMT+Comp 0.146 0.353 0 1 MSGTYPE Categorical message type assigned by the Facebook Facebook
– App application related messages Facebook 0.099 0.299 0 1
– Link link Facebook 0.389 0.487 0 1
– Photo photo Facebook 0.366 0.481 0 1
– Status Update regular status update Facebook 0.140 0.347 0 1
– Video video Facebook 0.005 0.070 0 1
PAGECATEGORY Page category closely following Facebook’s categorization Facebook
– Celebrity Singers, Actors, Athletes etc Facebook 0.056 0.230 0 1
– ConsumerProduct consumer electronics, packaged goods etc Facebook 0.296 0.456 0 1
– Entertainment Tv shows, movies etc Facebook 0.278 0.447 0 1
– Organization non-profit organization, government, school organization Facebook 0.211 0.407 0 1 – PlaceBusiness local places and businesses Facebook 0.071 0.257 0 1
– Website page about a website Facebook 0.088 0.283 0 1
Sample Messages Content Tags
Cheers! Let Welch’s help ring in the New Year. BRANDMENTION,
SMALLTALK, HOLIDAYMENTION, EMOTION
Maria’s mission is helping veterans and their families find employment. Like this and watch Maria’s story. http: // walmarturl. com/ VzWFlh
PHILANTHROPIC, SMALLTALK, ASKLIKE, HTTP
On a scale from 1--10 how great was your Christmas? SMALLTALK, QUESTION,
HOLIDAYMENTION Score an iPad 3 for an iPad2 price! Now at your local
store, $50 off the iPad 3. Plus, get a $30 iTunes Gift Card. Offer good through 12/31 or while supplies last.
PRODMENTION, DEAL, PRODLOCATION, PRODAVAIL, PRICE They’re baaaaaack! Now get to snacking again. Find
Pringles Stix in your local Walmart.
EMOTION, PRODMENTION, BRANDMENTION,
PRODLOCATION
Table 2: Examples of Messages and Their Content Tags: The messages are taken from 2012 December messages on Walmart’s Facebook page.
not relate to products or brands; and that there are no messages by celebrity owned pages
that feature price comparisons. “Remarkable facts” (our definition) are posted more by
firms in the entertainment category and less by local places and businesses. Consistent with
intuition, consumer product pages and local places/businesses post the most about products
(PRODMENTION), product availability (PRODAVAIL), product location (PRODLOC),
and deals (DEAL). Emotional (EMOTION) and philanthropic (PHILAN) content have
high representation in pages classified as celebrity, organization, and websites. Similarly,
the AMT workers identify a larger portion of messages posted by celebrity, organization
and website-based pages to be similar to messages by friends.
We now discuss the engagement data. Figure 4 shows box plots of the log of impressions,
Likes, and comments versus the time (in days) since a message is released (τ). Both
comments andLikes taper off to zero after two and six days respectively. The rate of decay
of impressions is slower. Virtually all engagements and impressions (more than 99.9%) are
Figure 2: Co-occurrence of Attribute Characteristics Across messages. Shades in upper triangle represent correlations. Numbers in lower triangle represent the same correlations in numerical form in 100-s of units (range −100,+100). For e.g., the correlation in occur-rence of smalltalk and humor across messages is 0.26 (cell [3,2]). The dark line shows the separation into 2 clusters. Persuasive content and informative content attributes tend to form two separate clusters.
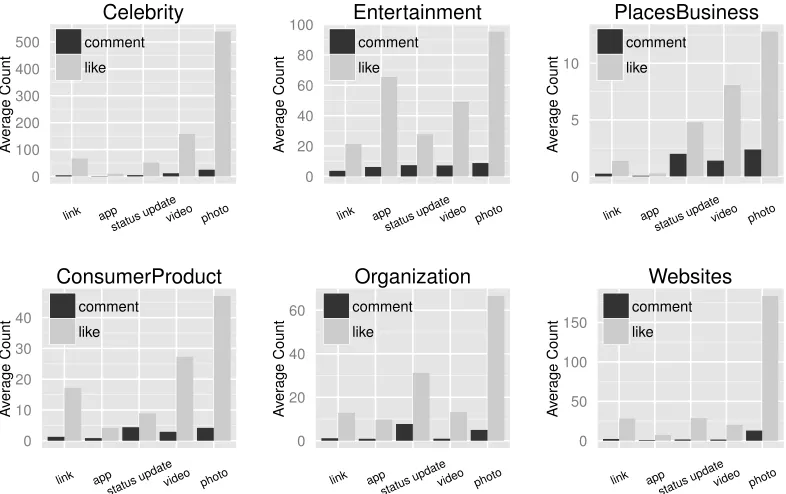
Figure 5 shows the average number of Likes and comments by message type (photo, link,
etc.) over the lifetime of a message. Messages with photos have the highest average Likes
(94.7) and comments (7.0) over their lifetime. Status updates obtain more comments (5.5)
on average than videos (4.6) but obtain lessLikesthan videos. Links obtain the lowestLikes
on average (19.8) as well as the lowest comments (2.2). Figure 6 shows the same bar plots
split across 6 industry categories. A consistent pattern is that messages with photos always
Celebrity ConsumerProduct Entertainment Organization PlacesBusiness Websites
17 7 1 0 3 7 12 48 46 9 0 3 5 7 24 18
10 2 0 0 1 2 8 39 53 19 0 6 7 11 36 37
21 12 0 0 2 16 14 50 44 9 0 3 8 6 28 17
7 5 0 1 1 2 10 40 53 39 1 7 7 18 36 31
7 14 0 1 3 11 13 50 24 22 0 2 7 10 39 17
8 12 2 0 1 13 19 60 33 5 0 2 2 9 27 11
remf
act
emotion emoticon holida
y humor philan fr iendlik ely smalltalk br andmention deal pr icecompare pr ice target proda vail prodloc prodmention
Industry Category VS Message Content Appearance Percentage
The labels on the bubbles are the percentages
Figure 3: Bubble Chart of Broader Industry Category vs Message Content: Each bubble represents the percentage of messages within a row-industry that has the column-attribute. Computed for the 5000 tagged messages. Larger and lighter bubbles imply higher percentage of messages in that cell. Percentages do not add up to 100 along rows or columns as any given message can have multiple attributes included in it. The largest bubble (60.4%) corresponds to SMALLTALK for the celebrity page category and the smallest bubble (0%) corresponds to PRICECOMPARE for the celebrity category.
in engagement response across industries. The patterns in these plots echo those described
in reports by many market research companies such as Wildfire and comScore.
Figure 7 presents the average number of Likes and comments by content attribute.
Emo-tional messages obtain the most number ofLikes followed by messages identified as “likely
to be posted by friends” (variable: FRIENDLIKELY). Emotional content also obtain the
highest number of comments on average followed by SMALLTALK and FRIENDLIKELY.
The reader should note these graphs do not account for the market-size (i.e., the number of
impressions a message reached). Later, we present an econometric model that incorporates
market-size as well as selection by Facebook’s filtering algorithm to assess user engagement
0 5 10 15
1 2 3 4 5 6 7 8 9 10 11 12 13 14 15 16
Tau
Log(Imp+1)
Log(Imp+1) VS Tau (time since post release) boxplot
0 2 4 6 8 10
1 2 3 4 5 6 7 8 9 10 11 12 13 14 15 16
Tau
Log(Comment+1)
Log(Comment+1) VS Tau (time since post release) boxplot
0 2 4 6 8 10 12
1 2 3 4 5 6 7 8 9 10 11 12 13 14 15 16
Tau
Log(Lik
e+1)
Log(Like+1) VS Tau (time since post release) boxplot
0 20 40 60 80
link app status update video photo
A
ver
age Count
comment like Average number of likes and comments obtained
over lifetime by message type
Figure 5: Average Likes and Comments by Message Type: This figure shows the average number ofLikes and comments obtained by messages over their lifetime on Facebook, split by message type.
0 100 200 300 400 500 link app
status updatevideo photo
A ver age Count comment like Celebrity 0 10 20 30 40 link app
status updatevideo photo
A ver age Count comment like ConsumerProduct 0 20 40 60 80 100 link app
status updatevideo photo
A ver age Count comment like Entertainment 0 20 40 60 link app
status updatevideo photo
A ver age Count comment like Organization 0 5 10 link app
status updatevideo photo
A ver age Count comment like PlacesBusiness 0 50 100 150 link app
status updatevideo photo
A ver age Count comment like Websites
0 50 100 150 remf act
emotion emoticon holida
y humor philan fr iendlik ely smalltalk br andmention deal pr icecompare pr ice target proda vail prodloc prodmention A ver age Count comment like
Average number of likes and comments obtained over lifetime by message content
Figure 7: AverageLikesand Comments by Message Content: This figure shows the average number of Likes and comments obtained by messages over their lifetime split by message content.
2.2.2. Amazon Mechanical Turk (AMT)
We now describe our methodology for content-coding messages using AMT. AMT is a crowd
sourcing marketplace for simple tasks such as data collection, surveys, and text analysis. It
has now been successfully leveraged in several academic papers for online data collection and
classification. To content-code our messages, we create a survey instrument comprising of a
set of binary yes/no questions we pose to workers (or “Turkers”) on AMT. To ensure high
quality responses from the Turkers, we follow several best practices identified in literature
(e.g., we obtain tags from at least 9 different Turkers choosing only those who are from
the U.S., have more than 100 completed tasks, and an approval rate more than 97%. We
also include an attention-verification question.) Please see the appendix for the final survey
instrument and the complete list of strategies implemented to ensure output quality.
Figure 8 presents the histogram of Cronbach’s Alphas, a commonly used inter-rater
reliabil-ity measure, obtained for the 5,000 messages.7The average Cronbach’s Alpha for our 5,000
7
tagged messages is 0.82 (median 0.84), well above typically acceptable thresholds of 0.7.
About 87.5% of the messages obtained an alpha higher than 0.7, and 95.4% higher than
0.6. For robustness, we replicated the study with only those messages with alphas above
0.7 (4,378 messages) and found that our results are qualitatively similar.
At the end of the AMT step, approximately 2,500 distinct Turkers contributed to
content-coding 5,000 messages. This constitutes the training dataset for the NLP algorithm used
in the next step.
0 50 100 150
0.0 0.2 0.4 0.6 0.8 1.0
Cronbach’s Alpha
Counts
Cronbach’s Alphas for 5,000 Tagged Messages Among 9+ Inputs
Figure 8: Cronbach’s Alphas for 5,000 Messages: This bar graph shows the inter-rater reliability measure of Cronbach’s Alpha among at least 9 distinct Turkers’ inputs for each 5,000 messages. The mean is 0.82 and the median is 0.84. We replicated the study with only those above 0.7 and found the result to be robust.
2.2.3. Natural Language Processing (NLP) for Attribute Tagging
We use NLP techniques to label message content from Facebook messages using the
AMT-labeled messages as the training data. Typical steps for such labeling tasks include: 1)
breaking the sentence into understandable building blocks (e.g., words or lemmas) and
set of training sentences with labels tagged from a trusted source identifying whether the
sentences do or do not have a given content profile (in our case, this source comprise the
5000 AMT-tagged messages); 3) using statistical tools to infer which sentence-attributes are
correlated with content outcomes, thereby learning to identify content in sentences. When
presented with a new set of sentences, the algorithm breaks the sentence down to building
blocks, identifies sentence-level attributes, and assigns labels using the statistical models
that were fine-tuned in the training process. We summarize our method here briefly. A
detailed description of the algorithms employed is presented in the Appendix.
The use of NLP techniques has been gaining traction in business research due to readily
available text data online (e.g., Netzer et al. (2012); Ghose et al. (2012); Geva and Zahavi
(2013)), and there are many different techniques. Our NLP methods closely mirror cutting
edge multi-step methods used in the financial services industry to automatically extract
financial information from textual sources (e.g., Hassan et al. (2011)) and are similar in
flavor to winning algorithms from the recent Netflix Prize competition.8The method we use
combines five statistical classifiers with rule-based methods via heterogeneous “ensemble
learning”. Statistical classifiers are binary classification machine learning models that take
attributes as input and output predicted classification probabilities.9Rule-based methods
usually use large data sources (a.k.a dictionaries) or use specific if-then rules inputted by
human experts, to scan through particular words or occurrences of linguistic entities in
the messages to generate a classification. For example, in identifying brand and product
mentions, we augment our AMT-tagged answers with several large lists of brands and
products from online sources and a company list database from Thomson Reuters. Further,
to increase the range of our brand name and product database, we also ran a separate
8Seehttp://www.netflixprize.com.
9
AMT study with 20,000 messages in which we asked AMT Turkers to identify any brand
or product name included in the message. We added all the brand and product names we
harvested this way to our look-up database. We then utilize rule-based methods to identify
brand and product mentions by looking up these lists. Similarly, in identifying emoticons
in the messages, we use large dictionaries of text-based emoticons freely available on the
internet.
Finally, we utilize ensemble learning methods that combine classifications from the many
classifiers and rule-based algorithms we use. Combining classifiers is very powerful in the
NLP domain since a single statistical classifier cannot successfully overcome the classic
precision-recall tradeoff inherent in the classification problem. The final combined classifier
has higher precision and recall than any of the constituent classifiers.
Assessment We assess the performance of the overall NLP algorithm on three measures,
viz., accuracy, precision, and recall (as defined in Footnote 3) using 10-fold cross-validation.
10-fold cross-validation is computationally intensive and makes it harder to achieve higher
accuracy, precision and recall, but we find using the criterion critical to obtaining the
external validity required for large scale classification. Table 3 shows these metrics for
dif-ferent content profiles. The performance is extremely good and comparable to performance
achieved by the leading financial information text mining systems (Hassan et al., 2011). We
also report the improvement of the final ensemble learning method relative to using only a
support vector machine classifier. As shown, the gains from combining classifiers are very
substantial. We obtain similar results for negative class labels.
As a final point of assessment, note that several papers in the management sciences using
NLP methods implementunsupervised learning which does not require human-tagged data.
These techniques use existing databases such as WordNet (lexical database for English) or
tagged text corpus (e.g, tagged Brown Corpus) to learn content by patterns and correlations.
Supervised NLP instead utilizes human-taggers to obtain a robust set of data that can be
With Ensemble Learning Without Ensemble Learning
(The Best Performing Algorithm) (Support Vector Machine
version 1 + Rule-based)
Accuracy Precision Recall Accuracy Precision Recall
REMFACT 0.94 0.99 0.68 0.88 0.99 0.33
EMOTION 0.97 0.99 0.87 0.94 0.98 0.65
HUMOR 0.98 1.00 0.90 0.97 1.00 0.14
PHILANTHROPIC 0.97 0.99 0.85 0.93 0.99 0.62
FRIENDLIKELY 0.94 0.99 0.68 0.90 0.99 0.41
SMALLTALK 0.85 0.88 0.80 0.78 0.34 0.28
DEAL 0.94 0.99 0.65 0.90 1.00 0.43
PRICECOMPARE 0.99 0.99 1.00 0.99 1.00 0.85
TARGETING 0.98 0.99 0.89 0.95 0.99 0.71
PRODAVAILABILITY 0.96 0.99 0.76 0.91 1.00 0.10
PRODLOCATION 0.97 0.99 0.90 0.87 1.00 0.11
Table 3: Performance of Text Mining Algorithm on 5000 Messages Using 10-fold Cross-validation: This table presents metrics for performance of the classification algorithms used. The left 3 columns show the metrics for the final algorithm which combines classifiers via ensemble learning methods while the right 3 columns shows the metrics for a support vector machine algorithm. Notice that the support vector machine classifier tends to have low recall and high precision. Naive Bayes tends to have high recall but low precision. Classifiers on their own cannot successfully overcome the standard precision-recall tradeoff (if one is higher, the other is lower). But combining many different classifiers with ensemble learning can increase both precision and recall. We obtain similar results for negative class labels.
performance is significantly poor compared to that of supervised NLP algorithms like the
ones implemented here. Finally, To the best of our knowledge, the NLP method used in
this paper that uses ensemble learning to combine several statistical classifiers and
rule-based methods, has not been used in business research journals.10Further, several current
implementations of NLP do not utilize the strict bar of utilizing the 10-fold cross-validation
criterion. We believe one of the contributions of this paper is to demonstrate how to utilize
AMT in combination with ensemble learning techniques, to implement supervised NLP in
business research to produce robust and cost-efficient NLP algorithms that perform well at
the scale required for empirical work. We believe the method will be useful in future studies
on unstructured natural language data such as advertising content or product reviews. For
10