Research Article
Physiological and biochemical responses
of hexaploid wheat cultivars to drought
stress
Sunbal Khalil Chaudhari
*, Muhammad Arshad and Noshin Ilyas
Department of Botany, PMAS Arid Agriculture University Rawalpindi-Pakistan *Corresponding author’s email: [email protected]
Citation
Sunbal Khalil Chaudhari, Muhammad Arshad and Noshin Ilyas. Physiological and biochemical responses of hexaploid wheat cultivars to drought stress. Pure and Applied Biology. Vol. 6, Issue 1, pp60-71.
http://dx.doi.org/10.19045/bspab.2016.50167
Received: 17/10/2016 Revised: 08/12/2016 Accepted: 14/12/2016 Online First: 21/12/2016
Abstract
Wheat is the most important cereal crop; it is staple diet for more than one third of the world population. Wheat production is influenced by several harsh environmental stresses that adversely affect its growth, metabolism and yield. Among them, Drought stress is the main factor limiting the productivity of wheat crop worldwide. Plants experience drought stress either when the water supply to roots becomes difficult or when the transpiration rate becomes very high. These two conditions often coincide under arid and semi-arid climates. Eighty percent area of Pakistan comes under arid and semi-arid region, so wheat productivity is adversely reduced in these areas due to lack of rain fall. Wheat yield under drought stress can be improved by several methods like conventional breeding, genetic transformation and marker assisted selection. For applying any of these methods, a close scans of morphological and physio-biochemical parameters are necessary. In the present study with 92 genotypes, a decrease of 35.57% for relative water content and 23.08% was observed for chlorophyll content in the stressed conditions. And an increase in metabolite level such as sugar (28.86%), SOD (4.53%) and canopy temperature (20.38%) was observed in moisture stress. Various genotypes have been identified which can be used further in plant breeding systems.
Keywords: Wheat; Drought; Genotypes; Physio-biochemical; Metabolites
Introduction
Meteorological drought (Discontinuity in precipitation) joined with higher evapotranspiration leads to agricultural drought [1].Drought has been a major focus of research for several decades as due to climate change the number of drought periods will increase in the future [2]. With global warming, drought will occur more frequently and will be expected to affect crop production more severely [3]. Drought effects plants at cellular, physiological,
Chaudhari et al.
adverse effects of different environmental stresses, plant have evolved special mechanisms and undergone a serial of physiological changes, but the "cross-talk of stresses" and "cross-tolerance to stresses" have not been extensively explored [9]. Crop genotypes having potential tolerance for environmental stresses is a common approach for improvement of crop productivity [10]. Drought tolerance is now considered by both plant breeders and biotechnologists to be a valid breeding target. Therefore some drought stress indices or selection criteria which provide a measure of drought based on yield loss under drought conditions in comparison to normal conditions have been used for screening drought tolerant genotypes [11-13].
Wheat is the major staple food in Pakistan, so it is cultivated and merchandized on commercial scale. Pakistan is among ten major wheat-producing countries of the world in terms of area under wheat cultivation, total productivity and per acre yield, It is recorded that Wheat currently contributes 75 percent of Pakistan’s daily caloric diet with per capita wheat consumption of around 124 kg per year, one of the highest in the world [14, 15]. Majority of area in Pakistan falls into arid-semi-arid regions, depending upon the climatic conditions. About 88% of total geographic area (79.6 mha) is covered by arid lands. The crop production in these areas is mainly dependent on the short and unpredictable rainfall [16, 17]. That’s why, among different issues, water scarcity pose a serious threat to wheat production when less or no precipitation occurs in the year especially during winter [18].
Keeping in view the importance of wheat crop in Pakistan and problem of low yield in
drought conditions as compared to developed countries it becomes imperative to take an immediate action to develop such varieties which can perform well under drought stress. So this study is planned for molecular and physiological evaluation of wheat cultivars for drought tolerance.
Materials and methods
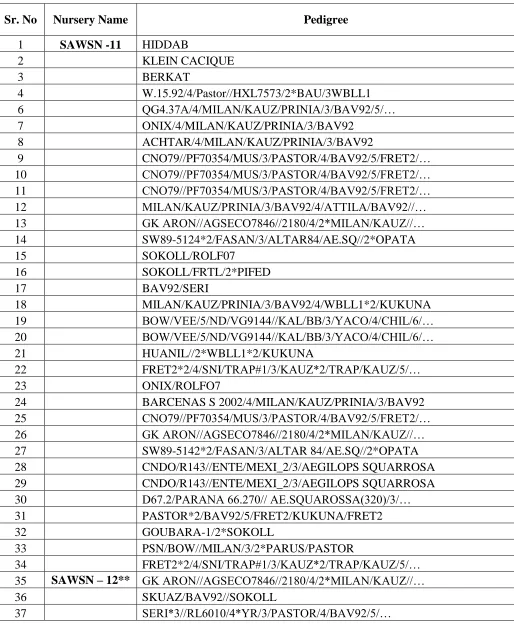
Diverse germplasm of bread wheat was used for the study of genetic diversity and for screening drought tolerant genotypes using agronomic, morphological, physiological and molecular traits. The germplasm used in the study was comprised of 92 candidate lines. NARC-09, NARC-2011, Chakwal-95, Inqalab 98 was cultivated as control checks. Pedigree for selected genotypes is represented in Table S1.
Field experiments were carried out in year 2013-2014 and 2014-2015 at National agricultural research centre (NARC), Islamabad, Pakistan. Seeds were obtained from Wheat wide crosses, NARC, and were sown under control conditions in the tunnel and fully irrigated conditions in field following Randomized complete block design. Rain out plot shelters were covered with green sheets and plastic sheets to block water coming through precipitation. Tunnel was lined with 3 feet high brick wall underground to stop water seepage from surrounding areas. The seeds were sown in 1 meter rows having 3 replications. Non-stress plots were irrigated until maturity at sowing time, tillering, booting and post anthesis stage [19]. Various physiological and biochemical attributes like chlorophyll content [20], Canopy temperature [21]
Table 1. Pedigree of genotypes used in the study
Sr. No Nursery Name Pedigree
1 SAWSN -11 HIDDAB
2 KLEIN CACIQUE
3 BERKAT
4 W.15.92/4/Pastor//HXL7573/2*BAU/3WBLL1
6 QG4.37A/4/MILAN/KAUZ/PRINIA/3/BAV92/5/…
7 ONIX/4/MILAN/KAUZ/PRINIA/3/BAV92
8 ACHTAR/4/MILAN/KAUZ/PRINIA/3/BAV92
9 CNO79//PF70354/MUS/3/PASTOR/4/BAV92/5/FRET2/…
10 CNO79//PF70354/MUS/3/PASTOR/4/BAV92/5/FRET2/…
11 CNO79//PF70354/MUS/3/PASTOR/4/BAV92/5/FRET2/…
12 MILAN/KAUZ/PRINIA/3/BAV92/4/ATTILA/BAV92//…
13 GK ARON//AGSECO7846//2180/4/2*MILAN/KAUZ//…
14 SW89-5124*2/FASAN/3/ALTAR84/AE.SQ//2*OPATA
15 SOKOLL/ROLF07
16 SOKOLL/FRTL/2*PIFED
17 BAV92/SERI
18 MILAN/KAUZ/PRINIA/3/BAV92/4/WBLL1*2/KUKUNA
19 BOW/VEE/5/ND/VG9144//KAL/BB/3/YACO/4/CHIL/6/…
20 BOW/VEE/5/ND/VG9144//KAL/BB/3/YACO/4/CHIL/6/…
21 HUANIL//2*WBLL1*2/KUKUNA
22 FRET2*2/4/SNI/TRAP#1/3/KAUZ*2/TRAP/KAUZ/5/…
23 ONIX/ROLFO7
24 BARCENAS S 2002/4/MILAN/KAUZ/PRINIA/3/BAV92
25 CNO79//PF70354/MUS/3/PASTOR/4/BAV92/5/FRET2/…
26 GK ARON//AGSECO7846//2180/4/2*MILAN/KAUZ//…
27 SW89-5142*2/FASAN/3/ALTAR 84/AE.SQ//2*OPATA
28 CNDO/R143//ENTE/MEXI_2/3/AEGILOPS SQUARROSA
29 CNDO/R143//ENTE/MEXI_2/3/AEGILOPS SQUARROSA
30 D67.2/PARANA 66.270// AE.SQUAROSSA(320)/3/…
31 PASTOR*2/BAV92/5/FRET2/KUKUNA/FRET2
32 GOUBARA-1/2*SOKOLL
33 PSN/BOW//MILAN/3/2*PARUS/PASTOR
34 FRET2*2/4/SNI/TRAP#1/3/KAUZ*2/TRAP/KAUZ/5/…
35 SAWSN – 12** GK ARON//AGSECO7846//2180/4/2*MILAN/KAUZ//…
36 SKUAZ/BAV92//SOKOLL
Chaudhari et al.
38 VORB/3/T. DICOCCON PI94625/AE.SQUARROSA (32…
39 vORB/3/T. DICOCCON PI94625/AE.SQUARROSA (32…….
40 CPI8/GEDIZ/3/GOO//ALB/CRA/4/AE. SQUARROSA (20……)
41
SYNTHATIC D- GENOME SELECTION
68.111/RGB-U//WARD/3/FGO/4/RABI/5/AE.SQUARROSA (882)/6/ATTILA/10/
42 URES/JUN//KAUZ/3/ALTAR 84/AE. SQ//2*OPATA
43 CROC_1/AE.SQUARROSA (205)//KAUZ/3/ENEIDA/4/FINSI
44
FILIN/IRENA/5/CNDO/R143//ENTE/MEXI-2/3/AEGILOPS SQUARROSA (TAUS)/4/WEAVER/6/…
45
CNDO/R143//ENTE/MEXI_2/3/AEGILOPS SQUARROSA (TAUS)/4/OCI/5/
46
FILIN/IRENA/5/CNDO/R143//ENTE/MEXI_2/3/AEGILOPS SQUARROSA (TAUS)/4/WEAVER/6/BERKUT
47
FILIN/IRENA/5/CNDO/R143//ENTE/MEXI_2/3/AEGILOPS SQUARROSA (TAUS)/4/WEAVER/6/BERKUT
48 CROC_1/AE.SQUARROSA (205)//KAUZ/3/2*PJN/BOW//OPATA
49 7HTWSN** SAUL/3/ACHTAR*3//KANZ/KS85-8-4/4/SAUL
50 KACHU#1/3/C80.1/3*BATAVIA//2*WBLL1/4/KACHU
51 SAUL#1/KACHU
52 SAUL#1/KACHU
53 D67.2/PARANA 66.270// AE.SQUAROSSA(320)/3/…
54 VORB/3/T. DICOCCON PI94625/AE.SQUARROSA (372)
55 CNDO/R143//ENTE/MEXI-2/3/AEGILOPS SQUARROSA
56 D67.2/PARANA 66.270// AE.SQUAROSSA(320)/3/…
57 T. DICOCCON PI225332/ AE.SQUARROSA (895)//…
58 D67.2/PARANA 66.270// AE.SQUAROSSA(320)/3/…
59 4CSiSA-SB** d67.2/PARANA 66.270// AE.SQUAROSSA(320)/3/Cunningham/4/…
60 MUU/4/BAV92//IRENA/KAUZ/3/HUITES/5/BAV92//IRENA/KAUZ/3/…
61 PBW343*2/KHVAKI*2/3/ACHTAR*3//KANZ/KS85-8-5
62 CHIR3/4/SIREN//ALTAR84/AE.SQUARROSA (205)/3/3*BUC/5/…
63 VORB/3/T. Dicoccon PI94625/ AE. SQUARROSA (372)//3*PASTOR
64 MURGA/KRONSTAD F2004
65 CHIRYA. 3
66 Kachu#1/4/croc_1/ AE. SQUARROSA (205)// KAUZ/ 3/
67 CNDO/R143//ENTE/MEXI_2/3/AEGILOPS SQUARROSA (TAUS)/4/…
68 VORB/4/D67.2//PARANA 66.270//AE. SQUARROSA (320)/3/…
69 HISTORICAL SET*
OPATA/RAYON//KAUZ
70 WL-711/CROW’S
72
BLUEBIRD/GALLO/3/GABOTO/SIETE-CERROS-66//BLUEBIRD/CIANO-67
73 CHAKWAL-97
74 Oasis/Skauz//4*BC/3/2*Pastor
75 KVZ//BUHO//KALBB
76 MUNIA/SHTO//AMSEL
77 DWL-5023/SUNBIRD,MEX//SUNBIRD,MEX
78 ATTILA/3/HUI/CARC//CHEN/CHTO/4/ATTILA
79
CHILERO/2*STAR/4/BOBWHITE//BUCKBUCK/PAVON-76/3/2*VEERY-10
80 F1n/ACS//ANA
81 KAUZ/PASTOR
82 INQALAB 91*2/TUKURU
83 RF (NUWYT)* MILAN/S87230//BABAX
84 SOKOLL/3/PASTOR//HXL7573/2*BAU
85 GA-2002/Chakwal-50
86 PASTOR/MILAN//MILAN/kauz
87 PFAU/SERIIB//AMAD/3/WAXWING
88 TC870344/GUI//TEMPORALERAM87/AGR/3/2*WVLL1
89 W15.92/4/PASTOR//HXL7573/2*BAU/3/WBLL1
90 9L039
91 RFVOBT022* RFVOBT022*
Chaudhari et al.
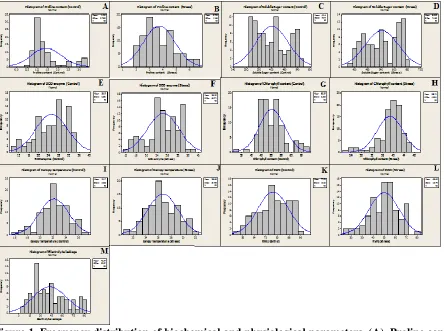
Figure 1. Frequency distribution of biochemical and physiological parameters. (A). Proline content (Control) (B). proline content (Stress) (C). Soluble carbohydrate content (Control) (D). Soluble carbohydrate content (Stress) (E). Super oxide dismutase enzyme (control) (F). Super oxide dismutase enzyme (Stress). (G). Chlorophyll content (Control). (H). Chlorophyll content (Stress) (I). Canopy temperature (Control). (J). Canopy temperature (Stress). (K). Relative water content (Control) (L). Relative water content (Stress) (M). Electrolyte leakage
Results
Drought stress tolerance is a very complicated phenomenon involving numerous metabolic adjustments. Analyses of metabolic pathways provide important supplementing evidence for better understanding of stress mechanisms [28]. Drought tolerance can be mediated by biochemical compounds such as amino acids like proline, organic acids and sugars by acting as compatible solutes to maintain cellular functions [29, 30].
Highly significant difference was observed for treatments, genotypes and their interactions for all the physiological-biochemical parameters at p<0.001.
stressed conditions, such as sugar (28.86%), SOD (4.53%) and 20.38% increase for
canopy temperature was observed in drought stress.
Table 2. Analysis of variance for physiological and biochemical parameters
Proline content Sugar content Superoxide dismutase
enzyme
Source DF Adj MS F P Adj MS F P Adj MS F P
Genotypes 91 3.3369 370.68 0 21776 723.71 0 158.58 389.22 0
Year 1 0.0342 3.8 0.044 101360 3368.57 0 103.84 254.86 0
Treatments 1 446.0944 49554.42 0 1623690 53961.47 0 207.18 508.51 0
genotypes*year 91 0.2927 32.51 0 518 17.2 0 0.54 1.33 0.086
genotypes*treatments 91 0.005 0.56 0.997 39 1.31 0.101 1.67 4.09 0
year*treatments 1 0.5441 60.44 0 11600 385.5 0 12.4 30.44 0
Error 91 0.009 30 0.41
Chlorophyll content Canopy temperature Relative water content
Source Adj MS F P Adj MS F P Adj MS F P
Genotypes 91 115.69 262.11 0 21478 48.04 0 549.8 224.57 0
Year 1 3.8 8.61 0.004 1400451 3132.22 0 198.4 81.05 0
Treatments 1 12787.91 28971.33 0 516305 1154.76 0 65952.7 26938.95 0
genotypes*year 91 9.27 21 0 0.454 1.02 0.47 2.7 1.08 0.352
genotypes*treatments 91 0.15 0.33 1 544637 1218.12 0 20.4 8.33 0 year*treatments 1 2.42 5.49 0.021 0.315 0.7 0.952 35.9 14.68 0
Error 91 0.44 0.447 2.4
Electrolyte leakage
Source Adj MS F P
Genotypes 91 1008.2 609.4 0
Year 1 44.28 26.77 0
Error 91 1.65
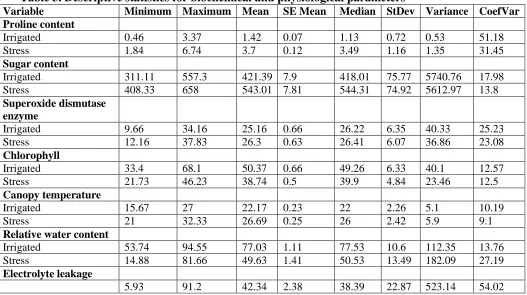
Table 3. Descriptive statistics for biochemical and physiological parameters
Variable Minimum Maximum Mean SE Mean Median StDev Variance CoefVar
Proline content
Irrigated 0.46 3.37 1.42 0.07 1.13 0.72 0.53 51.18
Stress 1.84 6.74 3.7 0.12 3.49 1.16 1.35 31.45
Sugar content
Irrigated 311.11 557.3 421.39 7.9 418.01 75.77 5740.76 17.98
Stress 408.33 658 543.01 7.81 544.31 74.92 5612.97 13.8
Superoxide dismutase enzyme
Irrigated 9.66 34.16 25.16 0.66 26.22 6.35 40.33 25.23
Stress 12.16 37.83 26.3 0.63 26.41 6.07 36.86 23.08
Chlorophyll
Irrigated 33.4 68.1 50.37 0.66 49.26 6.33 40.1 12.57
Stress 21.73 46.23 38.74 0.5 39.9 4.84 23.46 12.5
Canopy temperature
Irrigated 15.67 27 22.17 0.23 22 2.26 5.1 10.19
Stress 21 32.33 26.69 0.25 26 2.42 5.9 9.1
Relative water content
Irrigated 53.74 94.55 77.03 1.11 77.53 10.6 112.35 13.76
Stress 14.88 81.66 49.63 1.41 50.53 13.49 182.09 27.19
Electrolyte leakage
Chaudhari et al.
Soluble carbohydrate content
Carbohydrate changes are of particular importance on account of their direct relationships with physiological processes such as ABA signaling, photosynthesis, translocation and respiration. [31]. As a result of drought stress, amylase activity increases, soluble sugar content increases by decomposing starch [32]. In the present experiment, changes in soluble carbohydrate content during water stress and recovery were examined in leaves of 92 varieties of bread wheat and there was significant difference P<0.01 was observed among genotypes in irrigated and stress conditions. Interactions between genotypes and treatments have shown no significant difference in observations as depicted in anova results. The mean values for controlled treatment were ranged from 311.11 to 557.30 μg/g. An increase in sugar content was observed when water stress was applied. The readings ranged from 408.33-543.01 in both years. Maximum suger content value in stressed conditions was observed in AG-024 which was 658 μg/g. These results were in accordance with [33]. who observed that the soluble carbohydrate concentration in well-watered wheat plants was lower than those of stressed plants.
Proline content
Proline (content) is closely related to stress tolerance especially under soil water deficits
[34]. Many reports from crops and other plants have proved this relationship [35, 36]. There was significant difference P<0.005 observed between genotypes for proline content in year 2013-2014 and 2014-2015. However interaction between genotypes and treatments did not show any significant difference. The mean value for irrigated and stress treatments were 1.42 and 3.7 respectively. Maximum value for proline content in irrigated conditions was 3.48 and in stress condition an increase upto 6.74 was noticed in both years. Minimum values for
proline content was recorded in AG-091 which was 0.62 (control) and 1.7 (Stress). These results are in accordance with [37]. who stated that proline content increases under water stress
Super oxide dismutase enzyme
The major reactive oxygen species (ROS) scavenging mechanisms include superoxide dismutase (SOD), enzymes and metabolites from the ascorbate-glutathione cycle, and catalase (CAT). They are located throughout the different compartments of the plant cell. SOD is the front-line enzyme in ROS attack since it rapidly scavenges superoxide, one of the first ROS to be produced [38, 39]. Significant differences were observed for the values of SOD enzymes among genotypes, treatments and years. For both years the SOD values ranged from 9.50 to 12.16 in controlled conditions and from 33.34 to 37.83 in stressed conditions. Significant increase was observed for the genotypes with stress treatment. Minimum SOD values were observed for AG-091(12.16 and 10.23) and maximum (34.55 and 35.58) for AG-028 in stressed conditions. These results were in contrast to
[40]. Who observed that Superoxide dismutase (SOD) activity was very low and showed non-significant increase under water-stress in tolerant genotypes. However the results were consistent with the findings of [41]. who speculated that superoxide dismutase (SOD) activity increased with the decrease in osmotic potential in drought.
Chlorophyll content
show much significant differences. Chlorophyll content values ranged from 33.40 to 68.10 in irrigated and were decreased to 21.73-46.17 in stressed conditions. The results proved the findings of [3].who concluded that a reduction of the chlorophyll content under drought stress conditions occurs which may be due to a reduced leaf growth under drought stress conditions resulting in a reduced cell expansion leading to a relatively lower chlorophyll density in the leaves.
Canopy temperature
Canopy temperature can provide information on transpiration as the main contributor to reduced leaf temperature [47,
48] and it is taken as a relative measure of water flow associated with water extraction from the soil under water deficit [49]. Mean canopy temperature in irrigated conditions for both years was observed around 22.2 and in stressed treatment it was increased to 26.69 mean values. The reults were highly different for genotypes, treatments and years but no significant difference for the canopy temperature values was noticed for interactions of genotypes and treatments awith the years. Highest difference in canopy temperature was observed in AG-034 (31.67 in irrigated and 21 in stressed conditions) and minimum in AG-024 (16 in irrigated and 21 in stressed conditions).
Table 4. Drought tolerant lines based upon physio-biochemical attributes
Genotypes Proline(μmol/g) Sugar (μg/g) SOD CT
AG-010 6.12 651.29 33.31 23
AG-012 5.95 643.64 35.27 23.67
AG-017 6.28 655.56 29.54 26.67
AG-024 6.66 658 23.89 29
AG-051 6.03 644.45 35.98 25.33
Relative water content and electrolyte leakage
The results were highly significant for genotypes and treatments among the years for relative water content. However no significant difference was observed for interaction between genotypes and years. In year 2013-2015 relative water content ranged from 53.74-94.55 in irrigated and 14.88 to 81.66 in stressed conditions. Results obtained were highly significant among genotypes and treatments for both years. Under stressed conditions cell membranes are subject to changes often associated with the increase in the cell permeability [50]. In case of electrolyte leakage as a measure of cell membrane stability (CMS) there was normal distribution of trait. The genotype AG029 had highest electrolyte leakage of 91.2%. The electrolyte leakage progressively amplified with increasing drought severity.
These results are in agreement with those of
[33, 51, 52].
Conclusion
The present study was carried out to demonstrate that genetic variation can cause drought resistance in plants growing in dry and semi-dry regions of Pakistan and similar countries in the world. Our results revealed that different wheat cultivars can cope with drought stress by employing strategies such as the production of compatible solutes (reducing sugars, proline) and antioxidant enzymes. The cultivars given in Table 3 might be considered as a suitable candidate for cultivation in semi-arid regions of this country.
Authors’ contributions
Chaudhari et al.
References
1.Mishra V & Cherkauer KA (2010). Retrospective droughts in the crop growing season: implications to corn and soybean yield in the midwestern United States. Agric Meteorol 150: 1030–1045 2.Ashraf M (2010). Inducing drought
tolerance in plants: recent advances.
Biotechnol Adv 28:169–83.
3.Wehner GG, Balko CC, Enders MM, Humbeck KK & Ordon FF (2015). Identification of genomic regions involved in tolerance to drought stress and drought stress induced leaf senescence in juvenile barley. BMC
Plant biol 15(125): 1-15.
4.Prasad PVV, Pisipati SR, Momcilovic I & Ristic Z (2011). Independent and Combined Effects of High Temperature and Drought Stress During Grain Filling on Plant Yield and Chloroplast EF-Tu Expression in Spring Wheat. J Agron Crop Sci 197: 430–41.
5.Finkelstein RR, Gampal SSL & Rock CD (2002). Abscisic acid signaling in seeds and seedlings. Plant Cell 14: S15–S45. 6.Xiong L, Wang RG, Mao G & JKoczan JM
(2006). Identification of drought tolerance determinants by genetic analysis of root response to drought stress and abscisic acid. Plant Physiol 142(3): 1065–1074.
7.Yaish MW, Colasanti J & Rothstein SJ (2011). The role of epigenetic processes in controlling flowering time in plants exposed to stress. J Exp Bot 62(11): 3727–3735.
8.Reynolds MP (2006). Drought adaptation in wheat,” in Drought Tolerance in Cereals, J. M. Ribaut, Ed., chapter 11, pp. 402– 436, Haworth’s Food Products Press, New York, NY, USA.
9.Budak H, Kantar M & Kurtoglu KY (2013). Drought Tolerance in Modern and Wild Wheat. Sci World J 2013: 1-16.
10.Khan J, Khan S, Khetran MA, Amanullah, Sadiq N, Islam M, Hanan A & Aziz A (2013). Tijaban-10 a drought tolerant
and high yielding wheat variety for rainfed/sailaba areas of Balochistan. Pak J Bot 45(4): 1357-1362.
11.Talebi R, Fayaz F & Naji AM (2009). Effective selection criteria for assessing drought stress tolerance in durum wheat (Triticum durum Desf.). Gen Appl Plant Physiol 35: 64-74.
12.Mohammadi R, Armion M, Kahrizi D & Amri A (2010). Efficiency of screening techniques for evaluating durum wheat genotypes under mild drought conditions. Inter J Plant Prod 4 (1): 11-24.
13.Nouri A, Etminan A, Teixeira da Silva JA & Mohammadi R (2011). Assessment of yield, yield-related traits and drought tolerance of durum wheat genotypes (Triticum turjidum var. durum Desf.).
Aust J Crop Sci 5 (1): 8-16.
14.PARC (2015). Wheat In Pakistan: A status paper. National Coordinator Wheat Plant Sciences Division Pakistan Agricultural Research Council Islamabad, Pakistan. P 1-9.
15.USDA (2015). Pakistan grain and feed annual.USDA foreighn agricultural service. 1-4.
16.Ahmad N, Rashid M & Vaees AG (1996). Fertilizers and their Use in Pakistan. NFDC Pub. No. 4/96. Planning Commission NFDC, Islamabad, Pakistan.
17.Mujtaba SM & Alam SM (2002). Drought phenomenon and crop growth http://www.Pakistaneconomist.com/ issue2002/ issue13/iande4.htm.
18.Kazmi RH, Khan MQ & Abbasi MK (2003). Effect of water stress on the performance of wheat grown under controlled conditions at Rawalakot, Azad Jammu and Kashmir. Sarhad J Agric 19: 61-67.
19.Bashir AL & Bantel R (1994). Crop production. National book foundation. pp. 163.
Reynolds M.P. (Eds.). Physiological Breeding II: A field guide to Wheat phenotyping. Mexico, D.F. CIMMYT; pp: 41-43
21.Pietragalla J (2012). Canopy temperature In: Pask A, J. Pietragalla, D. Mullan, M. P. Reynolds, editors.Physiological breeding II: A field guide to wheat phenotyping. D. F., Mexico: CIMMYT; pp. 10–14.
22.Bars HD & Weatherly PE (1962).“Are Examination of the Relative Turgidity Technique for Estimating Water Deficit in Leaves?” Aust. J Biol Sci 15: 413-428.
23.Tripathy J, Zhang J, Robin S, Nguyen TT & Nguyen H (2000). QTLs for cell-membrane stability mapped in rice (Oryza sativa L.) under drought stress. Theor. Appl Genet 100: 1197‒1202 24.Bates LS, Waldran RP & Teare ID (1973).
Rapid determination of free proline for water stress studies. Plant Soil 39: 205-208.
25.Dubois M, Gilles KA, Hamilton JK, Rebers PA & Smith F (1956). Colorimetric method for determination of sugars and related substances. Anal Chem 28: 350-356
26.Beauchamp CH & Fridovich I (1971).Superoxide dismutase: improved assays and an assay applicable to acrylamide gels. Anal Biochem 44:276– 287.
27.Gianopolitis CN & Ries SK (1977). Superoxide dismutase: purification and quantitative relationship with water-soluble protein in seedling. Plant Physiol 59: 315–318.
28.Muscolo A, Junker A, Klukas C, Weigelt-Fischer K, Riewe D & Altmann T (2015). Phenotypic and metabolic responses to drought and salinity of four contrasting lentil accessions. J Exp Bot 10(1093): 1-14. 29.Blum A (2015). Towards a conceptual
ABA ideotype in plant breeding for water limited environments. Funct. Plant Biol 42(6) 502-513.
30.Naeem MK, Rauf S, Iqbal H, Shah MKN & Mir A (2013). In-silico studies of C3metabolic pathway proteins of wheat (Triticum aestivum). Bio Med Res Int Article ID 294759
31.Kameli A & Losel DM (2006). Carbohydrates and water status in wheat plants under water stress. New Phytol
125: 609-614.
32.Vaezi H (2005). Evaluation of molecular characters in wheat. M.Sc. Thesis, College of Agriculture Razi University, Kermanshah, Iran.
33.Zhang X, Ervin EH, Evanylo GK & Haering KC (2009). Impact of Biosolids on Hormone Metabolism in Drought-Stressed Tall Fescue. Crop Sci 49(5): 2009-1893
34.Hong-Bo S, Xiao-Yan C, Li-Ye C, Xi-Ning Z, Gang W, Yong-Bing Y, Chang-Xing Z & Zan-Min H (2006). Investigation on the relationship of proline with wheat anti-drought under soil water deficits. Coll Surf B 53: 113-119.
35.Rampino P, Pataleo S, Gerardi C, Mita G & Perrotta C (2006). Drought stress response in wheat: physiological and molecular analysis of resistant and sensitive genotypes. Plant Cell Environ
29: 2143–2152.
36.Yu X, Li B, Wang L, Chen X, Wang W, Gu Y, Wang Z & Xiong F (2015). Effect of drought stress on the development of endosperm starch granules and the composition and physicochemical properties of starches from soft and hard wheat. J Sci Food Agric doi
10.1002/jsfa.7439
37.Esfandiari E, Shakiba MR , Mahboob SA , Alyari H , Shahabivand S. (2006). The effect of water stress on the antioxidant content, protective enzyme activities, proline content and lipid peroxidation in wheat seedling. Pak J Biol Sci 11(15): 1916-22.
Chaudhari et al.
of C3plants: A predominant role for photorespiration? Ann Bot 89: 841-850. 39. Cruz de Carvalho MH (2008). Drought
stress and reactive oxygen species Production, scavenging and signaling.
Plant Signal Behav 3(3): 156–165. 40.Devi R, Kaur N & Gupta A (2012).
Potential of antioxidant enzymes in depicting drought tolerance of wheat (Triticum aestivum L.). Indian J Biochem Biophys 49:257–265.
41.Hassan NM, El-Bastawisy ZM, El-Sayed AK, Ebeed HT & Nemat Alla MM (2015). Roles of dehydrin genes in wheat tolerance to drought stress. J Adv Res 6(2): 179–188.
42.Rharrabti Y, Villegas D, García del Moral LF, Aparicio N, El Hani S & Royo C (2001).Environmental and genetic determination of protein content and grain yield in durum wheat under Mediterranean conditions. Plant Breed 120: 381–388.
43.Monneveux P, Jing R & Misra SC (2012). Phenotyping for drought adaptation in wheat using physiological traits. Front Physiol 3: 429.
44.Long SP, Zhu XG, Naidu SL & Ort DR (2006).Can improvement in photosynthesis increase crop yields? Plant Cell Environ 29: 315–330. 45.Raines CA (2011). Increasing
photosynthetic carbon assimilation in C3 plants to improve crop yield: current and future strategies. Plant Physiol 155: 36– 42.
46.Flexas J, Ribas-Carbó M, Bota J, Galmés J, Henkle M, Martínez-Cañellas S,
Medrano H, Flood PJ, Harbinson J & Aarts MGM (2011).Natural genetic variation in plant photosynthesis. Trend.
Plant Sci 16: 327–335.
47.Araus JL, Slafer MP, Reynolds MP & Royo C (2002). Plant breeding and drought in C3 cereals: what should we breed for? Ann Bot 89: 925–940.
48.Royo C, Villegas D, Garc´ıa del Moral LF, El Hani S, Aparicio N, Rharrabti Y & Araus JL (2002). Comparative performance of carbon isotope discrimination and canopy temperature depression as predictors of genotype differences in durum wheat yield in Spain. Aust. J Agr Res 53: 561–569. 49.Reynolds M, Dreccer F & Trethowan R
(2007). Drought-adaptive traits derived from wheat wild relatives and landraces.
J Exp Bot 58: 177–186.
50.Iqbal, S., 2009. Physiology of Wheat (Triticum aestivum L.) Accessions and the Role of Phytohormones under water stress. Unpublished Ph.D. Thesis, Fac. of Biological Sci, Quaid-i-azam Univ, Islamabad 83-154.
51.Hammad SAR & OAM Ali (2014). Physiological and biochemical studies on drought tolerance of wheat plants by application of amino acids and yeast extract. Ann Agric Sci 59: 133-145. 52.Filippou P, Antoniou C & Fotopoulos V
(2011).Effect of drought and rewatering on the cellular status and antioxidant response of Medicago