C A S E S T U D Y
Open Access
A step-by-step construction site photography
procedure to enhance the efficiency of as-built
data visualization: a case study
Hossein Jadidi
1*, Mehdi Ravanshadnia
1, Mujtaba Hosseinalipour
2and Fatemeh Rahmani
3Abstract
Introduction: Visualization of as-built data may change the future of construction project management to a more efficient area of knowledge if appropriate and easy photography and reconstruction tools would be developed and used by practitioners. Most of the current reconstructed 3D point cloud models use unordered photograph collections to generate 4D as-built models. Some of these photographs are not used in the final model mostly because of either a possible overlap with other photos or some faults in photography procedure. Computation time increases exponentially as the number of photos in a photo collection increases. Therefore, the unstructured processes may reduce the performance of a point-cloud model representation. This work shows how the available application of unordered photograph collections are regularly inefficient by measuring the performance of some important criteria, such as the registration success score and the computation time.
Case description: The case study is the construction of a gas compressor station. Such industrial projects involve several building and work areas (e.g., substation, control building, and piping area). The construction site covers approximately 20 hectares. The case study was conducted in two stages. In the first stage, preexisting images have been used for image based modelling (IBM). In the second stage, images captured based on a step-by-step photography procedure (SPP) have been used for IBM.
Discussion and evaluation: IBM performance in the first stage of the case study has been compared with the performance of the second stage by comparing the registration success scores. The IBM in the first stage of the case study results in sparse models, which hardly show the geometry of construction scenes. By contrast, capturing images based on the SPP in the second stage of the case study significantly changed the performance of IBM and increased the registration success score.
Conclusion: This study provides an easy applicable on-site photography procedure. By adopting the proposed approach and by training the photographers, the model would be more desirable for application in more construction projects. The application of the SPP in the case study shows a significant improvement in the final reconstructed 3D point cloud model and as-built data visualization criteria.
Keywords: Image-based modelling; As-built data visualization; 3D point cloud model; Photography procedure; Construction site
*Correspondence: [email protected]
1Department of Construction Engineering and Management, Science and Research Branch, Islamic Azad University, Tehran, Iran
Full list of author information is available at the end of the article
Introduction
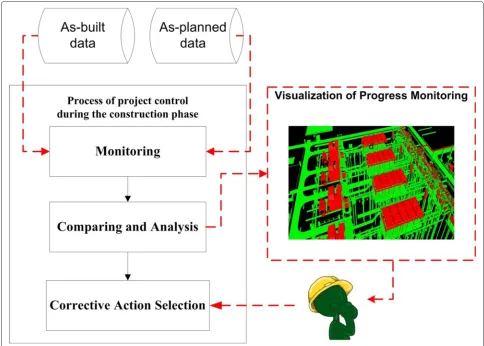
The effective decision making of a project manager in selecting corrective actions during the construction phase significantly depends on the immediate detec-tion of schedule delay; such corrective acdetec-tions can prevent delays and budget deficiencies (Golparvar-Fard et al. 2009a). Figure 1 shows that the project control process mainly occurs during the construction phase. This process comprises three steps, namely, monitor-ing, comparmonitor-ing, and corrective action selection. In the first and second steps, members of the project man-agement team prepare information products that visual-ize important data to facilitate decision making by the project manager (Jadidi et al. 2014). Figure 1 shows that decision making during the construction phase signifi-cantly depends on accessible as-built and as-planned data. Figure 1 also shows the importance of how to visualize these data to make quick decisions during the construc-tion phase. Golparvar-Fard et al. 2011a reported that the identification, processing, and communication of progress discrepancies are enhanced by the integration of the visu-alization of as-built and as-planned performance and can thus serve as a powerful remote project management tool for remote decision making in architecture, engi-neering, construction, and facility management industrie (Golparvar-Fard et al. 2011a).
Several researchers highlighted the limitations of cur-rent manual as-built data collection approaches in terms of speed and accuracy. According to Akinci et al. 2006, the field staff in construction sites spend 30 to 50 percent of their time recording and analyzing field data. Digi-tal photo is one of the most usable sources of field data, which can be easily captured without additional cost and time for construction projects. According to Section 4.21-b of the International Federation of Consulting Engineer (FIDIC) book series (Red Book), Conditions of Contract for Construction (FIDIC 2006), photographs are among the requirements for the progress report that a contrac-tor should regularly (e.g., daily, weekly, and monthly) send to the owner (Jadidi et al. 2014). Aside from progress documents, photographs that show as-built scenes have more applications. One of these applications is in image-based modelling (IBM) by computer vision algorithm, wherein these photographs are overlaid on 4D as-planned models and BIMs in an augmented reality environment to visualize the discrepancies between built and as-planned information and for automation of construction progress monitoring (Golparvar-Fard et al. 2009a; Kamat et al. 2010; Kim et al. 2013).
This study focuses on the data capturing approach for improving the quality of image-based 3D reconstruction models. By this way, decision makers could understand the progress of a construction project better and, thus, make quicker and more accurate decisions. Moreover,
to facilitate the automation of progress monitoring (Golparvar-Fard et al. 2011b) when these models are over-laid on 4D models or BIMs, the probability of observing expected as-built element increases and related errors of inaccuracy decrease because these models are denser. Thus, probability functions can detect discrepancies with high probability that is closer to reality. To enhance the quality of captured photos, this study does not mention any image processing technique, such as histogram adjust-ment or filtration. In addition, this study does not adjust-mention any post-processing technique for the densification of reconstructed point cloud model, such as meshing and texturing. This study focuses on how to take photos in construction sites with several buildings and work areas to enhance the quality of IBM for the visualization of as-built data. This study answers the following question: Is it possible to visualize as-built scenes by 3D point cloud models using usual photography in construction sites or should the photographs be captured in special manner to result in such models?
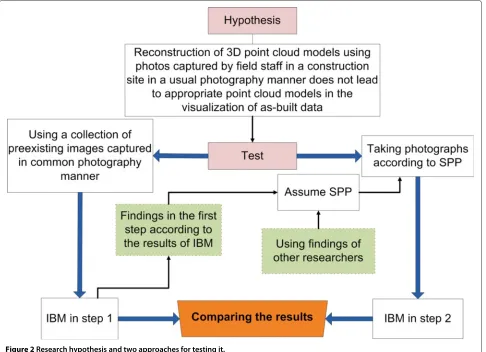
To respond to this question, we hypothesize that the approach for capturing photos by common photogra-phy in construction sites does not lead to appropriate 3D point cloud models for the visualization of as-built data and progress monitoring of construction projects, which include several buildings and work areas. A case study is developed in two stages to test this hypoth-esis. An unordered photo collection, which was previ-ously captured for purposes other than IBM, is used in the first stage. In this stage, photographers do not know that the photographs they captured will be used for the visualization of as-built data or progress monitor-ing. The photographers are field staff who capture photos for regular progress report to the owner (FIDIC 2006) and the project management office of the contractor. After conducting IBM from the collection, a step-by-step photography procedure (SPP) is assumed accord-ing to the results and based on some previous studies in the field of IBM. In the second stage of the case study, photographs are captured based on an assumed SPP. Figure 2 shows the hypothesis of this research, as well as two approaches in capturing data to test the hypothesis.
Background
IBM in construction
Figure 1Decision-making process during the construction phase.Visualization of discrepancies between as-built and as-planned data could be useful for decision maker.
digital cameras for image-based modeling (IBM) such as Golparvar- Fard et al. 2009a, 2011a, Bae et al. 2013, and Jadidi et al. 2014. These models are then superimposed on 4D as-planned models or Building Information Models (BIMs) to visualize progress deviations and/or to auto-mate construction progress monitoring (Bae et al. 2013; Golparvar-Fard et al. 2009a; 2011a; Kamat et al. 2010; Yang et al. 2013).
McCoy et al. 2014 investigated the use and access of IBM techniques to reduce uncertainty in construction planning for remote construction sites. According to their research, the use of image-based 3D reconstruction tech-niques reduced the risks and uncertainties in remote sites as well as the risks and uncertainties related to high-technology usage in construction planning (McCoy et al. 2014). Golparvar- Fard et al. 2009a proposed a visualization system called D4AR for the automatic visu-alization and determination of construction progress monitoring using daily site photographs. These pho-tographs were captured using a common digital camera by field engineers in construction projects (Golparvar-Fard
et al. 2009a). By using computer vision techniques such as structure from motion (SfM), the location of photog-raphers are estimated using the photographs captured in various illumination, resolution, zoom, and quality conditions (Golparvar-Fard et al. 2009b). The scene of the construction site is then reconstructed and shown using 3D point cloud models and finally overlaid on a 4D as-planned model to automatically visualize and detect construction progress monitoring (Golparvar-Fard et al. 2009a, 2011a).
Figure 2Research hypothesis and two approaches for testing it.
and matching. We then use available functions in the soft-ware such as SfM and bundle adjustment to reconstruct 3D scenes. We changed the sizes of the original images using Xnview 2014 to maintain the EXIF tags, which include the focal length of each photographs. These tags is useful for the estimation of intrinsic parameters of a camera by SfM procedure.
Factors that affected the quality of IBM
McCoy et al. 2014 considered the quality of image-based 3D reconstruction models by investigating the impact of the number of images on the density of reconstructed point cloud model and its completeness in contrast to real buildings. They found that a fault in data collection can significantly increase the risk on the usefulness of the out-come of image-based 3D reconstruction models. McCoy et al. 2014 addressed the risk of low-quality IBM outcome by suggesting that field staff or engineers should capture as many photographs as possible to optimize the use-fulness of IBM applications for remote project planning (McCoy et al. 2014). They also suggest that low-quality photographs can decrease the quality of IBM (McCoy
and accuracy of the reconstructed points in IBM vary depending on the distance between the camera and the objects. McCoy et al. 2014 chose a distance of nine meters from the buildings they studied and reported satisfactory results.
Considering the gap of previous studies
In this study, we considered industrial projects with sev-eral building and work areas. However, the authors in the aforementioned studies mostly consider a building. The data collection approach in industrial projects with sev-eral buildings and work areas is the key factor for the optimal application of IBM. The studied by McCoy et al. 2014 was a building. By intentionally deleting some images from the collection, they found that the outcome of image-based 3D reconstruction model changed significantly. The negative effect attributed to the lack of sufficient overlap-ping images in industrial projects such as gas compressor stations should be considered. We conducted our case study in a gas compressor station, where several buildings, piping areas, and equipment are located.
Capturing as many images as possible to guarantee the success of IBM is rational for small cases. However, this approach results in a huge collection of photos for these industrial projects; computation time grows expo-nentially as the number of photos increase because of pair-wise matching step in the SfM algorithm (Golparvar-Fard et al. 2011a). Therefore, taking sufficient overlapped pho-tographs from the entire site becomes more difficult as construction projects grow and become more complex. Thus, the problem of insufficient overlap will continue to affect the quality of the final point cloud model and will increase computation time.
This study mostly focuses on the data capturing stage (1) for selecting an approach to take images from industrial projects, and (2) for suggesting SPP for an image-based 3D reconstruction of construction cases to achieve better IBM. The first stage of the case study, which is pre-sented in the following section, attempts to respond to the following question: Is it possible to reach high-quality IBM by capturing photos randomly in a usual manner of photography?
In summary, this study considers the following gaps: (1) Is common usual photography for preparing regular reports to the owner of construction projects sufficient to achieve good image-based 3D reconstruction models? (2) What is the appropriate photographic strategy to achieve the appropriate IBM that clearly visualizes as-built data for remote project planning or visualization and automa-tion of construcautoma-tion progress monitoring?
Case description
A case study was conducted on a construction project to test the hypothesis mentioned in the introduction. The
project is the construction of a gas compressor station in a remote location from the city. Such industrial projects involve several building and work areas (e.g., substation, control, and laboratory buildings, piping area, air cool-ers, and gas compressors). The construction site covers approximately 20 hectares, which is larger than common construction projects. The case study was conducted in two stages as described in the following sections.
First stage
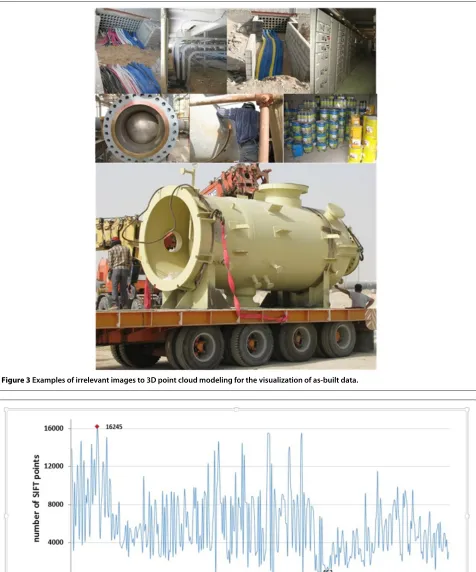
An unordered photo collection that includes 3,000 photos, which were captured for purposes other than image-based 3D reconstruction modeling, was used in the first stage. The photographers did not know that the photographs they captured would be used for the reconstruction of 3D point clouds. These photographers are field staff or engineers who captured photos for daily, weekly, and monthly report to the project management office of the contractor. Some of these photographs are unrelated to progress monitoring and are captured from scenes other than structures or buildings that exist in the construc-tion site. For example, one of the photographers captured several images of trucks that transport equipment to the site. Another photographer captured some scenes that show collected materials for painting, plumbing, and oth-ers. Another photographer captured several images from interior scenes such as the electrical boards in the con-trol room. Some of these images are irrelevant to the aim of point cloud modeling for the visualization of as-built data shown in Figure 3. All of these images were manually deleted from the photo collection because it extend computation time without any result in the final point cloud model. Other remaining images were taken from a series of days with no significant change in con-struction. The total number of images collected was 399, which were captured with different resolutions and under different illumination conditions. Different field staff members captured these images using different digital cameras.
This study used a publicly available software called VisualSfM (Wu 2011; Wu et al. 2011) to solve the cor-respondence problem and to bundle adjustment for the reconstruction of the 3D point cloud model of the as-built scenes. Figure 4 shows the number of SIFT features for each image in the collection in the first stage, which were determined by the SIFT detector of Lowe 2004; 2014. Figure 5 shows the reconstructed point cloud model with 99 estimated camera locations. The registration success score (portion of the number of images used to number of all images) of the photo collection in the first stage of the case study is 0.25, a value that is lower than that obtained by Golparvar-Fard et al. 2011b and McCoy et al. 2014.
Figure 3Examples of irrelevant images to 3D point cloud modeling for the visualization of as-built data.
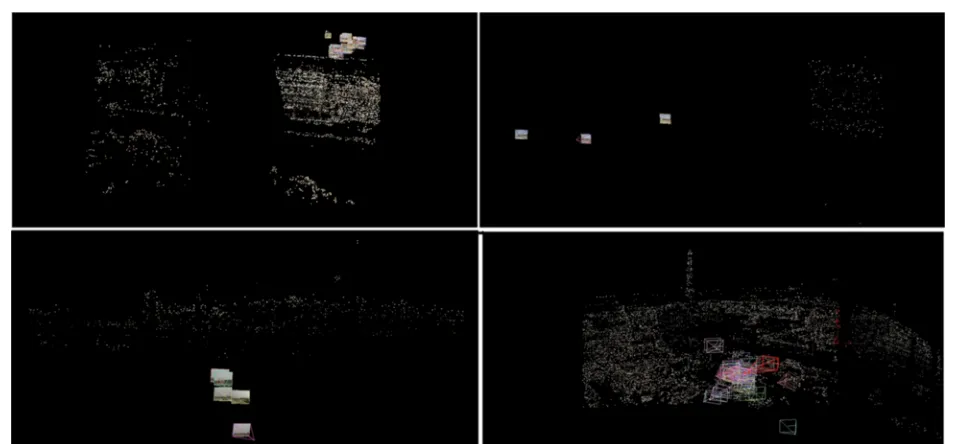
Figure 5Sparse 3D model reconstructed from 99 images (from a total of 399 images) with camera frusta.
the first stage of the case study. The numerous numbers of reconstructed model show that the photographs in the collection are captured from several areas in the con-struction site. However, these reconstructed models are vague and sparse, except for the one shown in Figure 5, which is not as good as the other results conducted by other researchers (Golparvar-Fard et al. 2011a; McCoy et al. 2014). Figure 6 shows some of these sparse models.
According to Snavely et al. 2010, the SfM techniques used in their study are not likely to register photos that do not have sufficient overlap, unless they are captured more fre-quently than in usual photography (Snavely et al. 2010). Therefore, in the first stage of the case study, the baseline between the images captured by field staff or engineers seems to be too wide. In other words, the images do not have enough overlap with other images. The lack
of overlap between images results in either a significant decrease in correspondence matches or the removal of the images during the final stage of the SfM procedure (bundle adjustment) by the software.
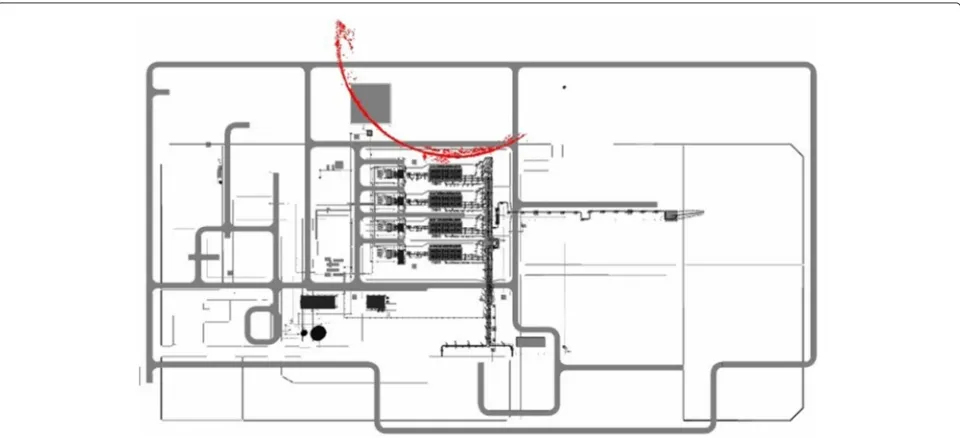
Thus, failure to overlap the images properly hinders the establishment of a good 3D point cloud model with a high score of registration success. Therefore, the low quality of these 3D sparse models can be attributed to the small number of images relative to the large area of the con-struction site (20 hectares) for the gas compressor station. To show the lack of captured photos related to the size of the construction site, the absolute reconstructed 3D point cloud model is overlaid on the gas compressor station plan, as shown in Figure 7; these points were measured using SfMGeoref v.2.3 (James et al. 2012) by defining coor-dination points (X, Y, Z) for at least three points. Figure 7 shows that the reconstructed scene only covers a small area of the construction site where the majority of photos have sufficient overlap in the collection related to that part of the construction site. However, the photo collection includes a scene that represents the entire construction site.
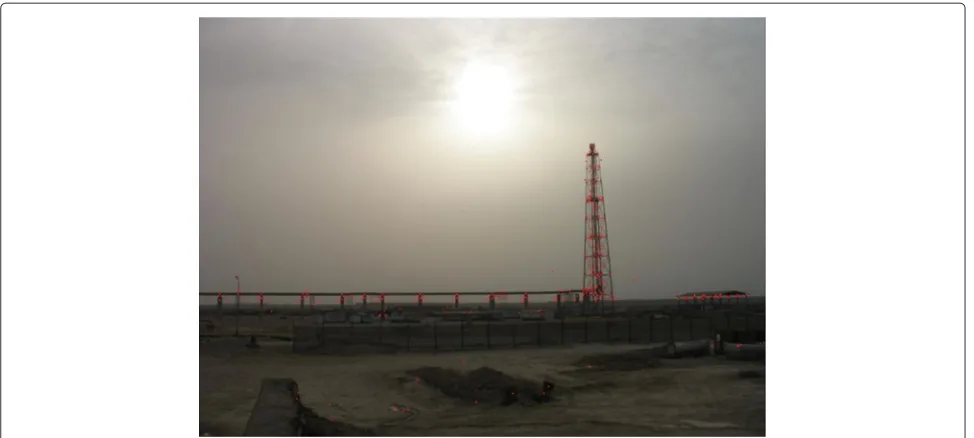
In addition to the lack of photos with sufficient overlap in the collection and the lack of photos in relation to the large construction site, the fault in photography in some photos is also obvious. For example, Figure 8 shows that some images in the collection of photos used in the first stage have been captured in poor conditions. The image was taken from afar and with the glare of the sun, which resulted in the smallest number of SIFT features (462). Thus, few correspondence matches were obtained, which led to a low-quality 3D point cloud model.
SPP for IBM
The most important requisite for a successful image-based 3D reconstruction is the stage of capturing data. Better quality input data result in better reconstructed 3D model outcome (Ducke et al. 2011). Some results about errors in photography, such as those mentioned in the first stage, are used to prevent error in capturing data. The fol-lowing step-by-step procedure is presented and shown in Figure 9 according to the results in the first stage and the findings of other researchers:
1- Sensing device selection: Choose an appropriate device. An expensive camera is not necessary. However, by experience, SLR cameras have better results than other devices (McCoy et al. 2014). The resolution of the camera does not need to be high, but it should be more than 3 megapixels. Even the camera of smartphones could be used.
2- Time of photography: Take pictures during daytime and whenever the sun is not in front of the camera. Do not take pictures around sunset or sunrise because the glow of the sun results in a significant decrease in SIFT features. Figure 8 shows this photography error that occurred in the first stage of the case study. In this image, the pho-tographer captured the image with the glare of the sun, which resulted in a significant decrease in the number of SIFT feature that consequently led to a small number of matches between images and a weak reconstruction of the 3D point cloud model.
3- Object selection: Choose an object according to the approved work breakdown structure in construc-tion projects because the image-based 3D reconstrucconstruc-tion model in this study is used for the visualization of as-built
Figure 8Image of the collection with minimum number of SIFT features visualized by red points.
data for construction progress monitoring.
4- Location: Maintain a distance of approximately 9 meters from the building [according to the suggestion of McCoy et al. 2014].
5- Selection of appropriate frame: Choose the appro-priate frame to capture structural elements, which should not too high nor too low. Capture the whole elements in vertical overlapping images to avoid dividing elements horizontally.
6- Motion: Walk slowly around a building and cap-ture each structural element from three different views [according to the suggestion of McCoy et al. 2014].
Second stage
In this stage, the author chose three buildings in the construction site: the control building (B1) and the labo-ratory building (B2) and the prefabricated building (B3).
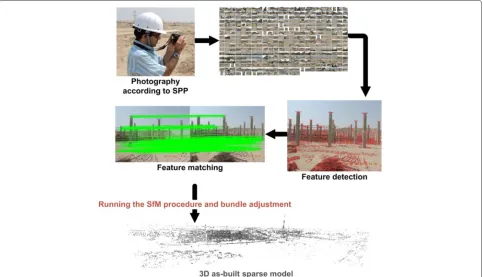
A total of 118 photographs were captured in 6 minutes from B1 as Experiment 1 and 80 photographs are cap-tured in 4 minutes from B2 as Experiment 2 and 26 photographs captured in a minute from B3 as Experiment 3. Table 1 shows the conditions under which these images were captured. Figure 10 shows the process of conduct-ing image-based 3D reconstruction from captured images to generate 3D point cloud models after running the SfM procedure.
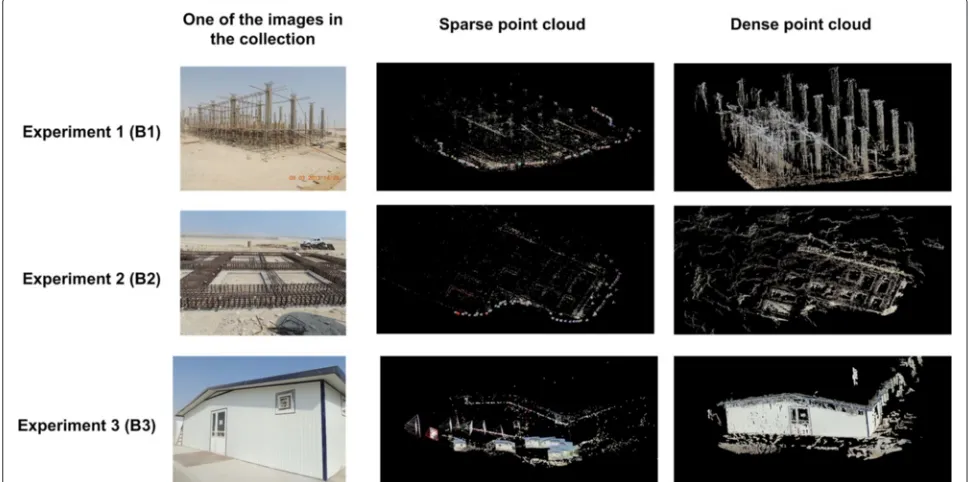
Figures 11 shows one of the images in the collection of each experiment, the reconstructed point cloud model with a reconstructed camera frusta for every three exper-iments, and the 3D point cloud model of B1,B2, and B3 in dense form, as determined by the CMVS/PMVS module in VisualSfM (Wu 2011; Wu et al. 2011). The registration success scores for the collection of photos are 0.85 in B1 and 1 in B2 and 1 in B3.
Table 1 Characteristics of the captured images
Experiment 1 (B1) Experiment 2 (B2) Experiment 3 (B3)
Camera model Nikon Coolpix P510 Sony-DSC-W310 Sony-DSC-W310
Number of captured photos 118 80 26
Image resolution(pixels) 4608x3456 2592x1944 4000x3000
Photography duration 6 minutes 4 minutes 1 minute
Lighting condition Sunny Sunny Sunny
Discussion and evaluation
According to the results of the first stage of the case study, capturing as many photos as possible from con-struction sites led to satisfactorily reconstructed point cloud models. However, the time of processing, especially for the pairwise matching stage for all of the images in a collection, is considerable. For instance, the computation time for reconstructing the point cloud model from 399 photos in the first stage is about 375 minutes, which led to a total of 99 images. This duration does not include the time wasted in capturing more photos in a construc-tion site. This period does not include the time and effort exerted to delete several images that are irrelevant to 3D point cloud modeling for as-built visualization and construction progress monitoring.
Table 2 summarizes the results of the case study. The results are benchmarked on a computer with 2.4 GHz
Intel® Core i7 CPU, 6.00 GB of RAM, and a Windows 64-bit platform.
According to the results shown in the Table 2, the IBM performance in the first stage of the case study, wherein preexisting images are captured to prepare regular reports to the owner, could be compared with the performance of the second stage by comparing the registration success scores (recall). Recall in the first stage was 0.25. By con-trast, capturing images based on SPP in the second stage of the case study significantly changed the performance of IBM and increased the registration success score for Experiment 1 to 0.85 and a complete registration score for Experiments 2 and 3.
Conclusions and future work
This work focuses on the data capturing stage of IBM and presents step-by-step photography procedure (SPP)
Figure 11Experimental buildings in captured images according to SPP, sparse 3D point cloud model, and dense 3D point cloud mode.
for image-based 3D reconstruction modeling for the visu-alization of as-built data in construction projects. SPP is proposed based on the findings of the first stage of the case study and on the findings of previous studies in the field of IBM. To validate SPP, the second stage of the case study is conducted and the images are captured based on SPP.
The IBM in the first stage of the case study results in sparse models, which hardly show the geometry of con-struction scenes. Only a particular view of the site is reconstructed when IBM was overlaid on the plan of the construction site despite the existence of images taken from another view. The results indicate that error in pho-tography and failure to capture photos with sufficient overlap with other photos led to the unsuccessful IBM in the first stage of the case study. After capturing images based on SPP and running the process of IBM, the reg-istration success score in the second stage increase an average of 0.95 between three experiments.
The authors do not refute the capability of the com-puter vision algorithm and the publicly available soft-ware used in this study to establish 3D point cloud models for visualizing as-built data from unordered preexisting construction site photographs. However, numerous images should be taken compared with the usual photography in the construction sites when using this method. This condition is impossible in indus-trial projects such as gas compressor stations or oil refinery plants, which have several buildings and work areas.
In summary, the research hypothesis that the approach of capturing photos in usual photography does not lead to appropriate 3D point cloud models is supported by the low registration success score (recall) in the first stage of the case study in contrast to the high score in the second stage of the case study. In addition, the results show that the proposed SPP significantly increases the efficiency of as-built data visualization.
Table 2 Summary of experimental data extract from the case study
First stage Second stage
Experiment 1 Experiment 2 Experiment 3
Total no. of images 399 118 80 26
Image resolution (pixels) various 2304x1728 2592x1944 2400x1800
No. of used images 99 100 80 26
Recall 0.25 0.85 1.00 1.00
No. of points recovered 36,072 36,221 17,345 3,646
The SPP proposed in this study, which was vali-dated by the case study, seems applicable for industrial projects, such as the case in which this research was conducted. This approach has good potential for use in other construction projects because some steps of the SPP are general and not relevant to particular construction projects. However, the case study has some limitations. For instance, the buildings in our case study are not more than two storeys. In addition, in our case, it is easy to walk around a building and capture photos without occlu-sions. However, in some cases it is not possible to walk around a building to capture photos easily. Hence, more case studies should be conducted in the future for high rise building and buildings or objects with no possibility of walking around them. Finally, we suggest that prospec-tive researchers in the field of IBM in the construction should train field staff and field engineers using either SPP or other guidelines in capturing construction site photos for IBM to enhance the efficiency of as-built data visualization.
Competing interests
The authors declare that they have no competing interests.
Authors’ contributions
HJ conducted the literature review, developed the case study, captured images from the construction site, and wrote the initial draft of the manuscript. MR supervised the entire processes of this study. MH and FR reviewed and revised the manuscript. All authors read and approved the final manuscript.
Acknowledgements
The writers would like to thank Oil Turbo Compressor Construction Company (OTCC) and Department of Construction Engineering and Management in Science and Research Branch of Islamic Azad University for their contributions to this research project. A special thanks is extended to Dr. Hosseini, OTCC’s managing director, and Mr. Azimi, OTCC’s project manager, for providing the first author with the opportunity of capturing images from the construction site. Any findings and conclusions expressed in this paper are those of the authors and do not reflect the views of the companies and individuals mentioned. Moreover, we would like to thank the reviewers who suggested some points to improve the quality of this paper.
Author details
1Department of Construction Engineering and Management, Science and Research Branch, Islamic Azad University, Tehran, Iran.2Department of Construction Management, Shahid Beheshti University, Tehran, Iran. 3Department of Information Technology Engineering, College of e-learning, Shiraz University, Shiraz, Iran.
Received: 30 June 2014 Accepted: 29 December 2014
References
Akinci, B, Kiziltas, S, Ergen, E, Karaesmen, IZ, Keceli, F (2006). Modeling and analyzing the impact of technology on data capture and transfer processes at construction sites: a case study.Journal of construction engineering and management,132(11), 1148–1157.
Bae, H, Golparvar-Fard, M, White, J (2013). High-precision vision-based mobile augmented reality system for context-aware architectural, engineering, construction and facility management (aec/fm) applications.Visualization in Engineering,1(1), 1–13.
FIDIC (2006).Conditions of contract for construction,for building and engineering works designed by the employer, multilateral development
bank harmonized edition: Fédération Internationale des Ingénieurs-Conseils (FIDIC).
Ducke, B, Score, D, Reeves, J (2011). Multiview 3d reconstruction of the archaeological site at weymouth from image series.Computers & Graphics,
2, 375–382.
Golparvar-Fard, M, Peña-Mora, F, Savarese, S (2009a). D4ar–a 4-dimensional augmented reality model for automating construction progress monitoring data collection, processing and communication.Journal of information technology in construction,14, 129–153.
Golparvar-Fard, M, Peña-Mora, F, Savarese, S (2009b). Sparse reconstruction and geo-registration of site photographs for as-built construction representation and automatic progress data collection, In26th International Symposium on Automation and Robotics in Construction (ISARC 2009), Austin TX, U.S.A.(pp. 535–543).
Golparvar-Fard, M, Peña-Mora, F, Savarese, S (2011a). Integrated sequential as-built and as-planned representation with d 4 ar tools in support of decision-making tasks in the aec/fm industry.Journal of Construction Engineering and Management,137(12), 1099–1116.
Golparvar-Fard, M, Pena-Mora, F, Savarese, S (2011b). Monitoring changes of 3d building elements from unordered photo collections, InComputer Vision Workshops (ICCV Workshops), 2011 IEEE International Conference On, Barcelona, Spain(pp. 249–256): IEEE.
Jadidi, H, Ravanshadnia, M, Alipour, MH (2014). Visualization of as-built progress data using construction site photographs: two case studies, In
31st International Symposium on Automation and Robotics in Construction and Mining (ISARC 2014), Sydney, Australia(pp. 706–713).
James, M, & Robson, S (2012). Straightforward reconstruction of 3d surfaces and topography with a camera: accuracy and geoscience application.
Journal of Geophysical Research: Earth Surface,117(F3), 1–17.
Kamat, VR, Martinez, JC, Fischer, M, Golparvar-Fard, M, Peña-Mora, F, Savarese, S (2010). Research in visualization techniques for field construction.Journal of construction engineering and management,137(10), 853–862. Kim, C, Son, H, Kim, C (2013). Automated construction progress measurement
using a 4d building information model and 3d data.Automation in Construction,31, 75–82.
Lowe, DG (2004). Distinctive image features from scale-invariant keypoints.
International Journal of Computer Vision,60(2), 91–110.
McCoy, AP, Golparvar-Fard, M, Rigby, ET (2014). Reducing barriers to remote project planning: Comparison of low-tech site capture approaches and image-based 3d reconstruction.Journal of Architectural Engineering,20(1), 1–13.
SIFT Demo Program (2014). http://www.cs.ubc.ca/~lowe/keypoints/. Snavely, N, Seitz, SM, Szeliski, R (2006). Photo tourism: exploring photo
collections in 3d.ACM Transactions on Graphics (TOG),25(3), 835–846. Snavely, N, Seitz, SM, Szeliski, R (2008). Modeling the world from internet photo
collections.International Journal of Computer Vision,80(2), 189–210. Snavely, N, Simon, I, Goesele, M, Szeliski, R, Seitz, SM (2010). Scene
reconstruction and visualization from community photo collections.
Proceedings of the IEEE,98(8), 1370–1390.
Wu, C (2011). Visualsfm: A visual structure from motion system. http://ccwu. me/vsfm/.
Wu, C, Agarwal, S, Curless, B, Seitz, SM (2011). Multicore bundle adjustment (pp. 3057–3064): IEEE.
Xiao, J, Fang, T, Tan, P, Zhao, P, Ofek, E, Quan, L (2008). Image-based façade modeling, InACM Transactions on Graphics (TOG), New York, NY, U.S.A., 27 (p. 161): ACM.
Xnview (2014). http://www.xnview.com.