R E S E A R C H
Open Access
The influence of photo elements on EEG
signal recognition
Qingjun Wang
1,2, Yibo Li
2*and Xueping Liu
1,2Abstract
With the increasing demand for confidentiality of information, traditional identification tools are no longer sufficient. As a new biological signal, EEG signal has the advantage of being difficult to forge and easy to carry and has become a hot topic in the identification research. In the study of EEG signals, the EEG signals triggered by vision have the advantage of stable characteristics. Therefore, many researchers use the photos of the subjects themselves as stimuli to achieve identification research, but the EEG signals caused by vision are easily stimulated. Object interference, such as photo size, resolution, and color. The main purpose of this paper is to study the effect of these disturbances on the recognition effect. The results show that when the number of electrodes is increased to 9, the effect of increasing the electrode to improve the classification accuracy is not significant; the recognition effect of black-and-white photos is lower than that of color, the size of the picture is 800 × 600 or 1024 × 768. When the resolution is 72, the classification effect is the optimal.
Keywords: Identification, EEG signals, Photos, Photo attributes
1 Introduction
In order to protect their own property, people began to re-search on identity early on, from early passwords to later fingerprints, faces, genes, etc. With the development of technology, the tools used for identity recognition are also gradually developing. The existing identification can easily forget (passwords) and easily be forged (fingerprints, faces), and the cost is too expensive (genetic testing). In some special circumstances, such as for the higher confi-dentiality departments, the existing identification tools are not suitable, so they need to find new identification tools.
The development of biometric technology has provided a new way to provide a reliable identification tool. Any physiological or behavioral characteristic of a person can be used as a biometric for identification in principle as long as it satisfies the following conditions: (1) universality, every-one has; (2) uniqueness, each person is different; (3) stabil-ity, relatively stable over a period of time; and (4) collectability, which can be conveniently measured quanti-tatively. Of course, it is not always feasible to satisfy the above conditions. The actual system should also consider the following: (1) performance, i.e., accuracy, speed,
robustness, and resources needed to meet the require-ments; (2) acceptability, people: the degree of acceptance of such biometrics; and (3) deceptiveness, whether it is pos-sible to deceive the system through subjective fraud. At present, more mature biometric technologies include fin-gerprints, irises, faces, hand shapes, voiceprints and signa-tures, but there are still some problems as follows: (1) there are always some people whose biometrics are not signifi-cant and are excluded, such as fingerprints. Unclear or in-jured may not pass the fingerprint test. It may be difficult for iris recognition when red eye, and the sound may change when there is a cold; (2) the safety factor is not high, for example, face recognition is powerless for twins and photo imitation; voiceprint and signature recognition is easy to be imitated; fingerprint and hand type identification are easy to be stolen; (3) it is difficult to perform living body detection, and the fingerprints, faces, and hands of dead or isolated bodies are still effective. Therefore, research on the theory and methods of new biometric technologies is a challenge for biometric research institutes.
EEG signal is the external manifestation of brain thinking activity. Since EEG signals have been recorded, people use a variety of methods to use EEG signals to re-veal brain activity [1–5]. In these studies, EEG signals in-duced by image stimuli have been widely used in many * Correspondence:[email protected]
2Shenyang Aerospace University, Shenyang, China
Full list of author information is available at the end of the article
tion to study the “image advantage effect.” Through the discussion of the two types of self-demolition, the fea-ture extraction of the image-stimulated EEG signals is used to improve the accuracy of the test case’s brain in test civil and criminal cases. Liu F J et al. [8] used pictuevoked EEG signals to study the different re-sponses of teenagers and older adults to voice, pictures, and Chinese characters. The results showed that the ERP components of the elderly and young people are different.
As a tool for identification, EEG has the following characteristics: First, it is universal, and each living per-son has an EEG signal. Secondly, because each perper-son’s brain characteristics, thinking mode, memory, etc. are different, there are differences between people. The characteristic EEG signal is unique. Thirdly, the EEG sig-nal has stability. The EEG sigsig-nal can be relatively stable for a certain period of time. Fourth, the EEG signal is easy to collect. Currently, there are commercial acquisi-tion devices. After years of research and development, today’s EEG signal acquisition has been simplified from the original steps of grounding, setting reference, coating conductive paste, and mounting electrode caps, and sim-plifying it to only one earphone-like device. Correspond-ing EEG signal.
EEG signal is a spontaneous physiological signal. With the development of acquisition techniques, the memory-lessness, difficulty of counterfeiting, and convenience of EEG signals have become new research directions for many identity researchers [9–12]. People’s sensitivity to their own photos is higher than that of other people’s photos, which can use this difference to induce stable EEG signals with their own characteristics to achieve identification.
Identity recognition using photo-induced EEG sig-nals has achieved good results [13–15]. From the point of view of the experimental model, these results are based on a small part of the same photo recognition research. However, in the specific use process, whether the attributes such as the size, color, and resolution of the photograph will have influence on the final recog-nition effect, which is rarely studied. This paper uses photos as stimuli to induce subjects’ brain electrical signals. Wavelet decomposition is used as a feature ex-traction tool to extract the features of the subject’s EEG signals, and Fisher distance is used as a feature screening method for feature screening. SVM is used
identity recognition research. In summary, the main contribution of this paper is that, by the influence of the size, resolution, and color of the subject’s photos on the classification and recognition results, the best photo attributes are finally obtained.
2 Experimental paradigm
The purpose of the experiment in this paper is to investi-gate the effect of photos on identification results under dif-ferent attributes. The photo attributes are set to size, resolution, and black-and-white color, and the size is set to 400px × 300px, 640px × 480px, 800px × 600px, 1024px × 768px, and 1280px × 960px, and the resolution is set to 50 dpi (pixels/inches), 72 dpi (pixels/inch), 100 dpi (pixels/ inch), 200 dpi (pixels/inch), and 300 dpi (pixels/inch).
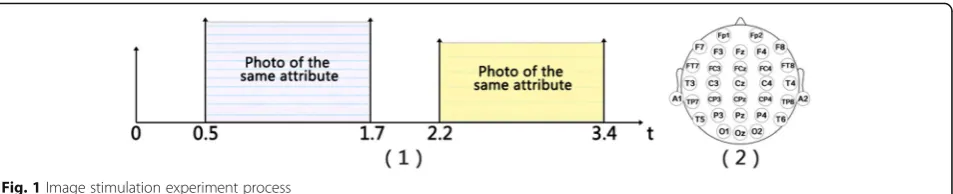
The subjects performed experiments in the laboratory. To ensure the quality of the experimental data, the la-boratory used a silent mode. In front of the subject is a 32-in. widescreen LCD monitor with a resolution of 1920 × 1080. During the experiment, the background of the screen is black. The subject hears a“drip”to indicate the start of the experiment. The first is a 500-ms black screen time. Then a random photo is selected from the photo bank on the background color, and the screen is blanked again after 1.2 s. Then the subject’s photo is dis-played for 1.2 s. The experiment completes a trial. A trial takes a total of 3.4 s (experimental mode is shown in Fig.1(1)). Each trial completes 100 trials for a total of 340 s. Each subject completed a photo attribute experi-ment over a period of time. According to the photo at-tributes, the size, resolution, and black and white of the photo library used in this paper are 26 groups. There-fore, each subject needs to complete at least 26 experi-ments. The whole experiment takes 50 days.
The 20 subjects in this study are from college stu-dents, including 10 males and 10 females (mean=20.45, variance=1.05). Before the experiment, the subjects knew the contents of the experiment. The subjects did not drink alcohol before the experiment, and they did not take any irritating drugs. Subjects were guaranteed ad-equate sleep (8 h or more) before the experiment. The experiments in this paper are all filed at the Research Office.
Second, the setting of various parameters; Third, the number and position of the electrodes, the more elec-trodes, the more complex the algorithm, the effect may be better; the fewer the electrodes, the simpler the algo-rithm, the worse the effect may be.
This paper uses neruoscan’s 40-lead brain electrical signal acquisition device to collect brain electrical signals at a sampling frequency of 1000 Hz. The left mastoid is used as a reference electrode, and the 50-Hz notch is used. The data are stored for 8 min each time, including 100 trials and preparations before and after the experi-ment. Before the analysis, the experimental data was pre-processed with the offline processing software (scan 4.3), which is provided with the acquisition equipment, including the removal of the electro-oculogram (vertical electro-oculogram), filtering (1–100 Hz band-pass filter-ing), and photo display time (the first 20–80%) segmen-tation, the final segmentation results are stored in the form of a sample, each sample is cutoff for one sampling period (1 s), and each subject’s pretreated sample set be-haves as 30 × 200 (electrode number of *samples).
As shown in Fig. 1(2), the electrodes are distributed on the international 10–20 standard, in which the markers in each electrode respectively represent the 10– 20 standard nomenclature and the serial numbers used in this paper.
3 Method
3.1 Wavelet entropy
The EEG signal is a weak electric signal, so the EEG sig-nal characteristics are easily interfered by the outside world. In order to highlight the essential features of EEG signals, it is a common type to convert EEG signals from time domain signals to other domain signals; means, in which the frequency domain feature is a commonly used method, the wavelet transform can transform the time domain feature into the time-frequency domain and in-tegrate the time and frequency features to achieve the filtering effect. Wavelet entropy better reflects the order of this time-frequency domain feature, so this paper chooses wavelet entropy as the feature transformation method.
Wavelet analysis is used to perform multi-scale de-composition of EEG signals. If the wavelet coefficient
vector on scale i is denoted as Wi= (wi1,wi2,…,win), in
which win refers to wavelet coefficient parameters, n is the decomposition length, so each scale has a coefficient vector corresponding to it. For EEG signals, the more similar coefficient vectors at different scales, the greater the entropy of the signal, the greater the complexity of the signal, the more similar each signal component, and the less obvious the signal characteristics.
Here, the norm of the space vectorRnis used to meas-ure the degree of closeness between the vectors, that is:
ws j j2¼
Xn
i¼1
wsi j
" #2
1=2
ð1Þ
In which, |ws| is the norm sequence.
According to the definition of wavelet energy, the closeness of each scale is measured by a norm sequence of wavelet coefficient vectors. Normalize the energy se-quenceE1,E2,…,Em. The signal structure and
complex-ity are analyzed by the distribution of normalized energy sequences. The process is described as follows:
1) Assuming that the signal is decomposed on the M scale, let the wavelet coefficient vector on scale ibe de-fined as:Wi= (wi1,wi2,…,win), then the energy at scale i
is defined as:
Ei¼j jwi2¼Xn
j¼1
wij2
ð2Þ
3.2 Fisher distance
This paper introduces the Fisher distance to calculate the feature distance between different subjects who see themselves and look at others. The Fisher distance cal-culation method is as follows:
Fi;j¼
μi−μj
2
σ2
i−σ2j ð3Þ
samples can obtain the best classification effect under this hyperplane.
In order to ensure the robustness of the classification results, this paper adopts a 30-fold cross-validation method to test and divide all the samples into 30 equal samples. The 300 self photos and the 300 photos of others were equally divided into 10 parts. Each time, 8 of them were selected as learning sets and 2 were used as test sets. Randomly selected 10 times, the average re-sult was finally calculated.
This paper selects SVM as a classifier and RBF as a kernel function. The RBF kernel function can be de-scribed by the following formula:
K x;ð xiÞ ¼ exp−γkx−xik2 ð4Þ
In which,γis the width of the kernel function.
The penalty factor C and the kernel functionσ in the classification calculation are determined using a grid search method.
4 Results and discussion
For each subject, the sample of brain electrical signals col-lected from the photo collection of each attribute included 100 samples (positive samples) of self-photographs and 100 samples (negative samples) that were not self-photographs. A total of 20 subjects were added together to obtain 2000 samples of one’s own and 2000 samples of watching others, for a total of 26 groups. Using the above method for feature extraction, we can get the following re-sults (the wavelet entropy used in this paper is based on the original value in addition toe5after taking the abso-lute value).
4.1 Electrode selection
The smaller the number of electrodes, the smaller the amount of data involved in the algorithm operation and the smaller the time complexity of the algorithm. Can 30-lead EEG signals be identified using only a few elec-trodes? Because there is no hair in the forehead area, it is easy to collect and practice. Can we use the two leads of brain signals in the forehead area to achieve identification?
Fisher’s distance calculates the difference of two char-acteristics of different subjects in terms of mean and variance. Therefore, using the Fisher distance as a criter-ion, the feature distances between the subjects who see
Fisher distance is superposed. Figure2(1) is the accuracy of the classification with the increase of the number of electrodes and the accuracy of the two electrodes with only the forehead (FP1 and FP2).
As can be seen from Fig. 2, with the increase in the number of electrodes, Fisher’s distance increasing trend gradually decreased, indicating that under different elec-trodes, subjects see themselves and see others’ different characteristics of the difference. Therefore, the contribu-tion to the classificacontribu-tion is also different. The classifica-tion accuracy can also be seen that when the number of electrodes increases from 8 to 9, the accuracy rate in-creases by 0.01, from 9 to 10 only inin-creases by 0.0008, and then the accuracy increases as the number of elec-trodes increases. The rate has barely increased. More-over, as the number of electrodes increases, there is also a phenomenon in which the accuracy rate is lowered (for example, 18). Therefore, it can be concluded that when the number of electrodes is selected at 9, the effect of 30 electrodes can be achieved.
If only the two electrodes in the forehead region are used, the classification accuracy is 81%, which is only 8% less than when selecting 9 electrodes. Therefore, for cases where the classification requirement speed is not strict, it is feasible to use the forehead EEG signal.
4.2 Influence of black and white photos
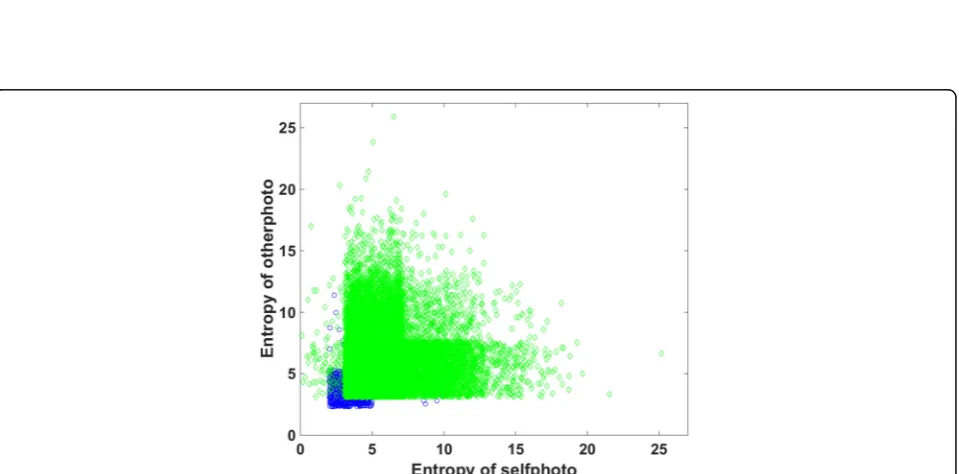
Black and white pictures and color pictures are two com-mon sources of stimulus for visual stimuli. Figure3is the entropy result of the subject using black-and-white photos and color photos as stimulating sources. The blue part is the entropy value of 100 samples to see oneself and others, and the green part is a sample of 25 color patterns (2500). Look at yourself and 2500 to see others).
Fig. 3Comparison of entropy values of different stimuli. Blue is a black-and-white photo source, green is a photo source, thex-axis is the entropy value of 9 pictures, andyis the entropy value of 9 pictures
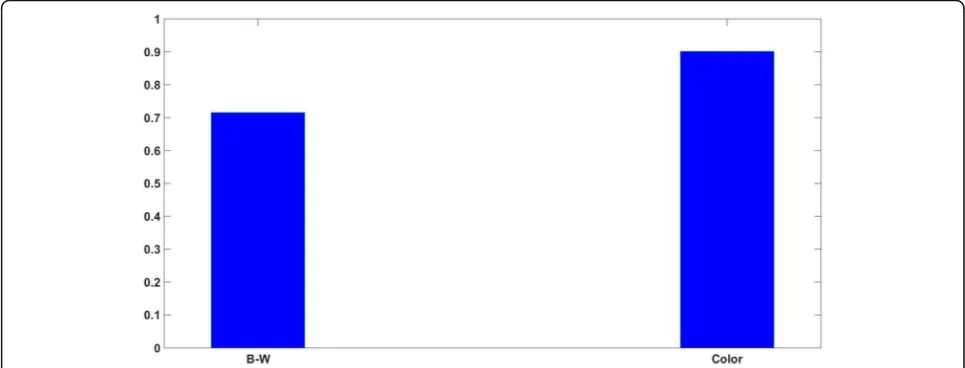
picture of others is 6.16; 3.14 for myself and 3.78 for looking at other people’s photos. Therefore, from the average point of view, the entropy value of looking at yourself and looking at other people’s photos is smaller, and looking at the color photo is larger than looking at the entropy value of the black and white photo.
For the above result, because the subject knew that it was an identity recognition experiment, his photos would appear during the experiment, so the expectation was not obvious. And because they are more familiar with their own photos is much higher than that of other photos, the volatility (the amount of information in the signal) that appears in the expression of entropy is not obvious. But when looking at other people’s photos, be-cause of the background photos selected from the sam-ple database, randomness may cause each photo to be different. The brain needs more information to process these photos that are not“familiar.”Therefore, the vola-tility of the signal (the amount of information contained in the signal) is large, causing the entropy value to be less than the average of the photos of others.
The black and white of photographs are more colorful than color photographs, and people have more attention to color photographs. Color photographs also highlight the sub-tle features of people. Therefore, the reaction of the human brain is also more intense, causing the entropy of the color photo to be larger than the entropy of black and white.
4.3 Classification accuracy
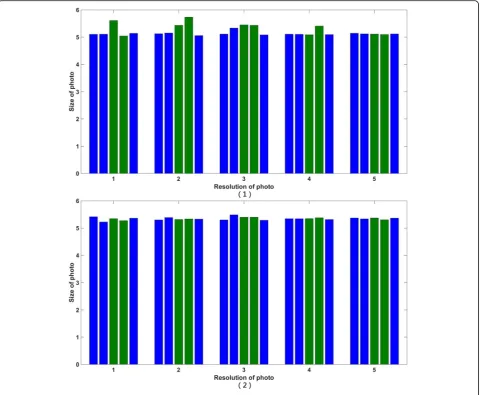
From result 2, it can be seen that the recognition rate of black and white photographs is lower than that of color, but the properties of color photographs are varied, and the factors that affect the resolution include the reso-lution and size. Figure5shows the effect of different res-olutions and sizes on entropy characteristics. As can be seen from the figure, when the subjects looked at their own photos, at the same resolution, the photos were 800px × 600px, and the maximum entropy was 1024px × 768px. When the resolution is 72 dpi, the photo entropy of these two sizes is maximum. Then, as the resolution increases, the entropy value gradually decreases. At a resolution of 300 dpi, the size of the photo no longer af-fects the size of the entropy, but when looking at other people’s photos (Fig. 5(2)), at different sizes and at the resolution, the difference in entropy is not significant.
From the above results, the following conclusions can be drawn:
1. In order to highlight the characteristics of your own photos, the small size of the photos is suitable for 800 × 600 or 1024 × 768.
2. The resolution of 72 is more appropriate.
3. The main reason for the above results may be that with the popularity of smart phones, photos at this resolution and size are more popular. Especially in the case of various portraits and online self-B- W (other) 3.78 3.72 3.84 3.94 4.09 4.03 3.72 3.70 3.88
photographs, such photographs are the most nu-merous, and therefore, the subject is affected and the subject is most familiar with such photographs.
Figure5 shows the effect of resolution and size on en-tropy (where 1 is the effect of looking at your own photo. 2 is the effect on looking at other people’s photos, where the x-axis is the resolution (1, 2, 3, 4, and 5 corresponds to 50 dpi, 72 dpi, 100 dpi, 200 dpi, and 300 dpi), andy is the resolution entropy. The five bars at each resolution in the figure correspond to five different photo sizes of 400 px × 300 px, 640 px × 480 px, 800 px × 600 px, 1024 px × 768 px, 1280 px × 960 px), respectively.
Table2shows the recognition rate under different res-olutions and sizes. From the results in Table2, it can be seen that as the size of the picture gradually increases, the recognition rate generally exists from small to large and then to small. Among them, the resolution ratio is 640 × 480, 800 × 600, and 1024 at 5 resolutions. * 768
may reach the maximum. When the resolutions are 50, 72, and 300, it reaches the maximum at 640 × 480, and the resolution reaches 100 at 800 and 600. When it reaches 200, it reaches the maximum at 1024 × 768. The results in Table2 show that when the resolution is 100 and the size is 800 × 600, the resolution is optimal.
EEG signals are used as identification tools. From the perspective of the signal source, it is mainly the use of sports imagination [16, 17], picture stimulation (visual evoked potentials [18, 19] and photo stimulation [13, Fig. 5The effect of resolution and size on entropy
Table 2Recognition rates with different resolutions and sizes
400 × 300 640 × 480 800 × 600 1024 × 768 1280 × 960
50 dpi 80.34 83.86 82.83 80.13 80.54
72 dpi 84.32 96.67 94.19 90.00 82.9
100 dpi 88.13 95.83 97.84 93.83 90.42
200 dpi 81.32 80.8 89.43 90.38 82.05
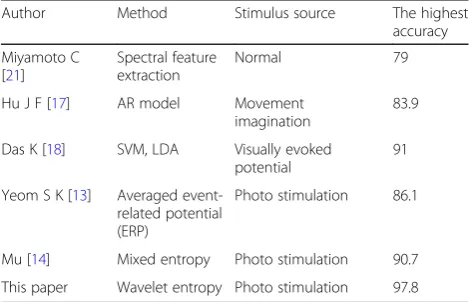
icle uses wavelet entropy as features, and the highest recognition rate is 97.8%.
5 Conclusion
EEG signals as an identification and recognition tool have advantages over other biological information. Bio-metric systems based on EEG signals can achieve certain accuracy and speed. Collecting EEG signals will not cause any harm to the human body. It is easy to accept, and because the EEG signal is derived from the brain’s thinking activities, the way and the way of thinking be-tween people are different. On the one hand, it is diffi-cult to“decipher”the individual’s thinking. On the other hand, even if it is deciphered, it is difficult to forge the
same. Using the EEG signal, it is impossible to
“de-cipher” through subjective fraud, with the continuous enrichment of signal analysis tools and research results, to achieve“validation is not this person,”using the clas-sification method to achieve, and through feature extrac-tion and classificaextrac-tion method design; basic can achieve verification purposes.
The use of EEG signals as an identification tool is an important branch of the current identity research. Because of the stability of the EEG signal characteris-tics induced by the vision, the picture is often used as a tool for inducing EEG signals. Among the visu-ally evoked EEG signals, there are many research findings on the identification of EEG signals based on the differences in characteristics of EEG signals seen by the subjects themselves and their photos. However,
under different attributes are different.
Acknowledgements
The authors thank the editor and anonymous reviewers for their helpful comments and valuable suggestions.
Funding
Not applicable.
Availability of data and materials
We can provide the data.
About the authors
Qingjun Wang received his M.S. degree from the Northeast University, in 2009. He is currently a graduate student studying for Ph.D. degree in the College of Automation Engineering, Nanjing University of Aeronautics and Astronautics. His research interests include Pattern Recognition, EEG Recognition, and Fatigue Detection.
Yibo Li was born in 1963 and a Professor of Shenyang Aerospace University. His main research interests include Artificial Intelligence, Pattern Recognition, and Artificial Intelligence.
Xueping Liu received his M.S. degree from the Shenyang Aerospace University, in 2010. He is currently a graduate student studying for Ph.D. degree in the College of Automation Engineering, Nanjing University of Aeronautics and Astronautics. He has published over 10 technical research papers. His research interests include machine learning, vision analysis, and pattern recognition.
Authors’contributions
QW did the experiment. XL and YL gave significant ideas in writing the manuscript. All authors read and approved the final manuscript.
Competing interests
The authors declare that they have no competing interests.
Publisher’s Note
Springer Nature remains neutral with regard to jurisdictional claims in published maps and institutional affiliations.
Author details
1Nanjing University of Aeronautics and Astronautics, Nanjing, China. 2Shenyang Aerospace University, Shenyang, China.
Received: 11 August 2018 Accepted: 23 October 2018
References
1. W. Klimesch, P. Sauseng, S. Hanslmayr, EEG alpha oscillations: the inhibition-timing hypothesis. Brain Res. Rev.53(1), 63–88 (2007)
2. Y. Zhang, X. Ji, B. Liu, D. Huang, F. Xie, Y. Zhang, Combined feature extraction method for classification of EEG signals. Neural Comput. & Applic. 28(11), 3153–3161 (2017)
3. Y. Dai, X. Wang, P. Zhang, W. Zhang, J. Chen, Sparsity constrained differential evolution enabled feature-channel-sample hybrid selection for daily-life EEG emotion recognition. Multimedia Tools Appl.77(17), 21967– 21994 (2018)
4. A. Bhattacharyya, M. Sharma, R.B. Pachori, P. Sircar, U.R. Acharya, A novel approach for automated detection of focal EEG signals using empirical wavelet transform. Neural Comput. & Applic.29(8), 47–57 (2018)
Table 3Comparison of existing representative identification results
Author Method Stimulus source The highest
accuracy
Miyamoto C [21]
Spectral feature extraction
Normal 79
Hu J F [17] AR model Movement imagination
83.9
Das K [18] SVM, LDA Visually evoked potential
91
Yeom S K [13] Averaged event-related potential (ERP)
Photo stimulation 86.1
Mu [14] Mixed entropy Photo stimulation 90.7
5. M. Yadava, P. Kumar, R. Saini, P.P. Roy, D. Prosad Dogra, Analysis of EEG signals and its application to neuromarketing. Multimedia Tools Appl. 76(18), 19087–19111 (2017)
6. N. Mamoru, S. Yasutaka, Pupil size and EEG affected by visual stimuli. Electron. Commun. Jpn.77(2), 58–67 (2010)
7. X.D. Yan, H.G. Liu, H. Qiao, Research of Chinese characters and picture as stimulus in the cognitive EEG lie detection. J. Shanxi Police Acad.20(1), 75– 78 (2012)
8. F.J. Liu, X. Wu, M.X. Yu, ERPs of characters of Chinese words compared with tone and picture stimuli in adolescents and aged persons. Clin. EEG29(3), 146 (1998)
9. S. Marcel, J.D.R. Millan, Person authentication using brainwaves (EEG) and maximum a posteriori model adaptation. IEEE Trans. Pattern Anal. Mach. Intell.29(4), 743–752 (2007)
10. C. He, X. Lv, Z.J. Wang, inIEEE international conference on acoustics, speech and signal processing. Hashing the mAR coefficients from EEG data for person authentication (IEEE Computer Society, Taipei, 2009), pp. 1445–1448 11. S.H. Liew, Y.H. Choo, F.L. Yin, inInternational conference on fuzzy theory and
ITS applications. Fuzzy-rough nearest neighbour classifier for person authentication using EEG signals (IEEE, Taipei, 2013), pp. 316–321 12. T. Nakamura, V. Goverdovsky, D.P. Mandic, In-ear EEG biometrics for feasible
and readily collectable real-world person authentication. IEEE Trans. Inf. Forensics Secur. (99), 1 (2017)
13. S.K. Yeom, H.I. Suk, S.W. Lee, inProceedings of the Korean information science society conference. EEG-based person authentication using face-specific self representation (Korean Institute of Information Scientists and Engineers, Seoul, 2011)
14. Z. Mu, J. Hu, J. Min, et al., Comparison of different entropies as features for person authentication based on EEG signals. IET Biom.6(6), 409–417 (2017) 15. Z. Mu, J. Hu, J. Min, EEG-based person authentication using a fuzzy
entropy-related approach with two electrodes. Entropy18(12), 432 (2016) 16. O. Nieves, V. Manian, inWorld Automation Congress. Automatic person
authentication using fewer channel EEG motor imagery (IEEE, Guilin, 2016), pp. 1–6
17. Hu J F. New biometric approach based on motor imagery EEG signals BioMedical Information Engineering, 2009. FBIE 2009. International Conference on Future. IEEE, Tianjin, 2010:94–97
18. Das K, Zhang S, Giesbrecht B, et al. Using rapid visually evoked EEG activity for person identification International conference of the IEEE Engineering in Medicine & Biology Society. Conf Proc IEEE Eng Med Biol Soc, 2009:2490 19. A. Ferreira, C. Almeida, P. Georgieva, et al., inInternational conference image
analysis and recognition. Advances in EEG-Based Biometry (Springer, Berlin, Heidelberg, 2010), pp. 287–295
20. Paranjape R B, Mahovsky J, Benedicenti L, et al. The electroencephalogram as a biometric Electrical and computer engineering, 2001. Canadian Conference on. IEEE, Toronto, 2001:1363–1366 2