R E S E A R C H
Open Access
Which type of forest management provides
most ecosystem services?
Timo Pukkala
Abstract
Background:Forest ecosystems are increasingly seen as multi-functional production systems, which should provide, besides timber and economic benefits, also other ecosystem services related to biological diversity, recreational uses and environmental functions of forests. This study analyzed the performance of even-aged rotation forest management (RFM), continuous cover forestry (CCF) and any-aged forestry (AAF) in the production of ecosystem services. AAF allows both even-aged and uneven-aged management schedules. The ecosystem services included in the analyses were net present value, volume of harvested timber, cowberry and bilberry yields, scenic value of the forest, carbon balance and suitability of the forest to Siberian jay.
Methods:Data envelopment analysis was used to derive numerical efficiency ratios for the three management systems. Efficiency ratio is the sum of weighted outputs (ecosystem services) divided by the sum of weighted inputs. The linear programing model proposed by Charnes, Cooper and Rhodes was used to derive the weights for calculating efficiency scores for the silvicultural systems.
Results and conclusions:CCF provided more ecosystem services than RFM, and CCF was more efficient than RFM and AAF in the production of ecosystem services. Multi-objective management provided more ecosystem services (except harvested timber) than single-objective management that maximized economic profitability. The use of low discount rate (resulting in low cutting level and high growing stock volume) led to better supply of most ecosystems services than the use of high discount rate. RFM where NPV was maximized with high discount rate led to particularly poor provision of most ecosystem services. In CCF the provision of ecosystem services was less sensitive to changes in discount rate and management objective than in RFM.
Keywords:Data envelopment analysis, Production efficiency, Multi-objective management, Multi-functional forestry, Continuous cover forestry, Rotation forest management, Any-aged forestry
Background
Forest ecosystems are increasingly understood as multi-functional production systems which provide many types of products and services, not only timber but also recational amenities, habitats, protection of water re-sources, erosion control, carbon sequestration, and various non-wood products (Gadow et al. 2007; Fürstenau et al. 2007; Diaci et al. 2011). In Finland, forest have trad-itionally been used for timber and fuelwood harvesting, berry and mushroom picking, recreation and hunting (Salo 2015). Maintenance of biological diversity and car-bon sequestration are examples of more recent manage-ment objectives.
Another global trend in forest management is a grad-ual transition from clear felling and plantation forestry back to continuous cover forestry, which was the pre-vailing practice in the past (Boncina 2011; Schütz et al. 2012; Wehenkel et al. 2014; Puettmann et al. 2015). This shift in management paradigm is related to the realization that even-aged monocultures may not be the best possible production systems when all ecosystems services are con-sidered (Fürstenau et al. 2007). Clearfelling is regarded to be especially harmful to scenic beauty and recreational use of forest (Silvennoinen et al. 2002). A common pursuit is to maintain and create forest structures that resemble natural forest landscapes (O’Hara 2011).
In Finland, even-aged management was the only ac-cepted forestry paradigm for several decades (Siiskonen 2007; Laiho et al. 2011). Regeneration was mainly based Correspondence:[email protected]
University of Eastern Finland, PO Box 11180101 Joensuu, Finland
on planting or sowing. This period ended in 2014 when uneven-aged management became acceptable with forest landowner’s decision. However, the debate between the supporters of these two management systems continues (Diaci et al. 2011), and the proponents of even-aged management claim that this system is also a good pro-vider of ecosystem services. Another, slowly growing group of foresters and forest landowners disagree with this view (Laiho et al. 2011), and are willing to increase the use of continuous cover management (CCF). The re-search conducted so far suggests that CCF may be eco-nomically more profitable than even-aged plantation forestry especially on poor sites and with high discount rates (e.g. Chang 1981, 1990; Tahvonen 2009). In addition, it seems evident that CCF has a better carbon balance than even-aged forestry (Pukkala 2014) and CCF may produce higher bilberry yields (Pukkala et al. 2011) and ensure the protective functions of forests (Boncina 2011). A recent study from Sweden (Lundmark et al. 2016) suggests similar carbon balances for CCF and even-aged management if the growth is the same in both systems. However, this study ignores the high manufac-turing releases and low substitution rates of pulp-based products, which decreases the carbon balance more in even-aged forestry than in CCF. The better carbon bal-ance of CCF is largely explained by lower share of pulp-wood in harvested timber.
Since it is likely that each type of management has both advantages and disadvantages, the ranking of alter-native management systems is difficult and greatly de-pends on the personal preferences of the forest landowner. Systematic quantitative research on the pro-duction of different ecosystem services would help land-owners to choose the best practices and assist policy makers to develop policy instruments that would con-tribute to maximizing the benefits that forest ecosystems provide to current and future generations.
This study quantified several types of ecosystem services in even-aged rotation forest management and continuous cover forestry. The third type of silviculture was a mixture of the two systems, which in this article is called any-aged forest management (Haight and Monserud 1990). Boncina (2011) has called it freestyle forest management. Forest management under each silvicultural system was opti-mized from the viewpoint of the forest landowner, maxi-mizing the economic benefit obtained from the forest. Then, it was calculated how much the forest produces other services which may not be of primary significance to the landowner but are important to the society. The per-formance of different silvicultural systems in multi-objective forest management was also analyzed. The ser-vices included in the analyses are important to Finnish people, and there are numerical methods available for evaluating the amounts of the selected services. Knowing
the effect of specific silvicultural methods on these ser-vices could provide scientific evidence for adjusting silvi-cultural policies.
Since it was foreseen that a single management system is not the best in every respect, an overall efficiency ana-lysis was conducted to find out whether some of the management systems can be classified as efficient or in-efficient producers of ecosystem services. The method used in this comparison was the data envelopment ana-lysis (Cooper et al. 2011).
Method
Data envelopment analysis
The data envelopment analysis (DEA) model was intro-duced by Charnes, Cooper and Rhodes (Cooper et al. 2011), and the model is referred to as the CCR construc-tion. If an observed decision making unitoconsumesxio units of input i and produces yro units of output r, the efficiency ratio of this unit is
X ruryro
X
ivixio
ð1Þ
where ur and vi are weights that maximize the effi-ciency. Since the ratio is unbounded, the following con-strained mathematical programming model has been proposed for the evaluation of efficiency (Cooper et al. 2011):
maxhoðu;vÞ ¼ X
ruryro= X
ivixio ð2Þ
subject to X
ruryrj= X
ivixij≤1; j¼1;…;n ð3Þ
ur;vi≥0 for all i and r ð4Þ
wherenis the number decision making units. By adding constraintΣivixio= 1 the objective function can be writ-ten as max Σruryro. Since constraints Σruryrj/Σivixij ≤1 are equal toΣruryrj–Σivixij≤0, the problem can be writ-ten as a linear programming model as follows:
maxz¼Xruryro ð5Þ
subject to X
ivixio¼1 ð6Þ
X ruryrj−
X
ivixij≤0; j¼ 1; …;n ð7Þ
formulation to calculate the efficiency ratio (Cooper et al. 2011):
θ¼ minθ ð9Þ
subject to X
jxijλj≤θxio; i¼ 1;…;m ð10Þ X
jyrjλj≥yro; r¼ 1;…; s ð11Þ
λj≥0;j¼ 1;…n ð12Þ
wheremis the number of inputs,sis the number of out-puts,nis the number of management units andλjis the
dual price of management unitj. The objective function value of the optimal solution (of primal or dual) is the efficiency score for unito. All units for whichϴ* < 1 are inefficient. The units for whichϴ* = 1 are either efficient or weakly efficient. For an efficient unit, all slacks need to be zero (Cooper et al. 2011). The slacks are calculated from the following LP model:
maxXis−i þXrsþr ð13Þ
subject to X
jxijλjþs−i ¼θxio; i¼ 1;…; m ð14Þ X
jyrjλj−sþr ¼yro; r¼ 1;…; s ð15Þ
λj;s−i;sþr≥0 ∀ i;j;r ð16Þ
Analyzed inputs and outputs
In this study, decision making units were replaced by silvicultural systems, which were even-aged rotation for-est management (RFM), continuous cover management (CCF) and any-aged management (AAF), which is a combination of CCF and RFM. In AAF any silvicultural system was allowed in every stand, depending on which one was better in terms of the objective function.
In forestry, the main inputs of the production process are light, temperature, nutrients, CO2, water, and the
current growing stock, which is the “machinery” that converts the other inputs into wood and other outputs. Silvicultural treatments are additional inputs. Their amounts can be measured by the expenditure of the treatments. The amounts of light, CO2, nutrients and
water are difficult to quantify. However, in a certain for-est their amounts are constant. Therefore, growing stock volume can be used to represent all the inputs related to the biological growth process. We may thus assume that it is the size of the initial“machinery”, which is used to produce the ecosystem services.
The outputs of forestry include timber, economic profit and different ecosystem services that forests pro-vide to the society. These services include the mainten-ance of biological diversity, non-wood forest products, carbon sequestration and different scenic and recre-ational amenities. In this study, the following inputs and outputs were considered when evaluating the efficiency of different management systems:
Inputs
Growing stock volume
Silvicultural costs
Outputs
Economic profit measured by net present value
Volume of harvested timber
Berry yields
Carbon balance
Scenic beauty index
Habitat area of Siberian jay
The first output is the economic benefit of forest land-owner. However, the society also benefits from the eco-nomic well-being of forest landowners. All the other outputs, including harvested timber, are important bene-fits to the Finnish society. The selection of the outputs was partly dependent on the availability of methods. Nu-merical methods for predicting the amounts of the ser-vices have been described in the scientific literature for all outputs included in the efficiency analyses of this study.
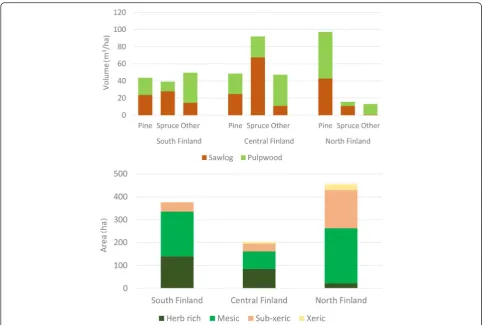
Case study forests
Three forest holdings representing South, Central and North Finland were selected for the analyses. The areas of these holdings ranged from 200 ha to 450 ha (Fig. 1). The proportion of poor sites increased towards north. The southernmost forest had almost equal volumes of Scots pine, Norway spruce and broadleaved species while spruce was dominating in Central Finland and pine in the north.
calculated with the taper models of Laasasenaho (1982). Biomass models were used to calculate the above- and below-ground biomasses of trees (Repola et al. 2007; Repola 2009).
The net incomes from timber harvesting were calcu-lated as the difference between the roadside value of harvested wood and the harvesting cost (Rummukainen et al. 1995). The higher harvesting costs of partial cut-tings (as compared to clear felling) were therefore taken into account when calculating the NPV. The obtained net income of the cutting was assumed to be the stump-age price paid to forest landowner. Therefore, timber sales did not involve any cost to the forest landowner.
Carbon balances of living biomass, dead organic matter and wood-based products were calculated as described in Pukkala (2014). Decomposition of dead organic matter was simulated using the Yasso07 de-composition model (Liski et al. 2009; Tuomi et al. 2011). The yields of cowberries and bilberries were obtained from the models of Turtiainen et al. (2013) and Miina et al. (2009). The total berry yield (bil-berry + cow(bil-berry) was used in DEA. The scenic beauty index was calculated with the model of Silven-noinen et al. (2001).
The habitat suitability index for Siberian jay was calcu-lated with the formulas developed in Pukkala et al. (2012). The habitat area of Siberian jay was assumed to represent the suitability of the forest to several species requiring similar forests, for instance three-toed wood-pecker, northern goshawk, red-breasted flycatcher, and grouses (Pukkala et al. 2012). A threshold index value of 0.5 was used to classify a forest stand as habitat or non-habitat. The total habitat area was the area of stands classified as habitat. The study of Pukkala et al. (2012) presents separate indices for the nesting and feeding habitat of Siberian jay. The variable used in DEA was the sum of nesting and feeding habitat areas.
The carbon balances, removals, incomes and costs were calculated for each 10-year period while the scenic beauty index, habitat suitability index and berry yield es-timates were calculated for the ending year of each 10-year period. Treatments were simulated in the middle of the 10-year period.
The schedule that maximized the net present value was selected for each stand. Selection was done using a 2 % or 5 % discount rate. The lower rate leads to rather small removal and increasing standing volume (Fig. 2), and a forest landowner who is using such a low rate may
be characterized as“saver”. The higher rate leads to lar-ger removal and usually also to decreasing growing stock volume as compared to the initial volume (Fig. 2). A landowner using this rate may be characterized as “in-vestor” being able to invest the money obtained from timber sales with 5 % profit. Calculation of NPV in-cluded the discounted costs and incomes of the simu-lated 30-year period plus the predicted NPV of the ending growing stock (see Pukkala 2016).
Results and discussion
Numerical example
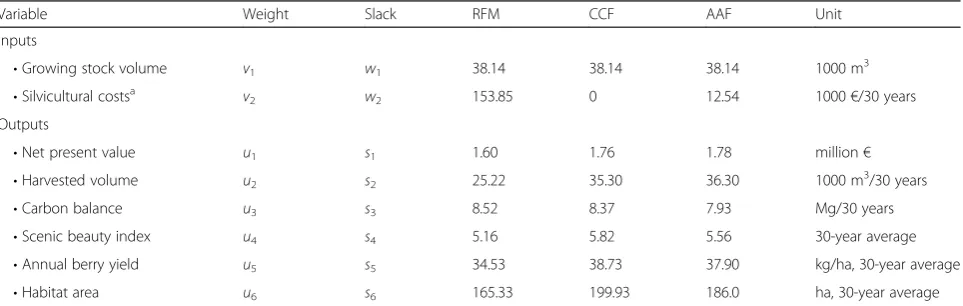
When the management schedule that maximized NPV with a 2 % discount rate was selected for each stand of the holding of Central Finland, the amounts of input and output variables were those shown in Table 1. The primal LP problem for deriving the weights (vi andur) for RMF was as follows (non-negativity constraints not shown):
max 1:60u1þ 25:22u2þ 8:52u3þ5:16u4þ 34:53u5þ 165:33u6
subject to
38:14v1þ 153:85v2¼ 1
1:60u1þ 25:22u2þ 8:52u3þ 5:16u4þ 34:53u5 þ 165:33u6–38:14v1–153:85v2≤0
1:76u1þ 35:30u2þ 8:37u3þ 5:82u4þ 38:73u5 þ 199:93u6–38:14v1–0v2≤0
1:78u1þ 36:30u2þ 7:93u3þ 5:56u4þ 37:90u5 þ 186:00u6–38:14v1–12:54v2≤0
The solution of this LP problem gives the following
optimal vales for the weights: u3= 0.108821, u6=
0.000446, v1= 0.026219 with all other weights equal to zero. These weights result in efficiency ratio equal to 1, implying that the management system is efficient or weakly efficient. It can be seen that much weight was given to the output in which RFM was slightly better than the other systems, namely carbon balance (u3). The weight of silvicultural costs (v2), in which RFM was worse than CCF and AAF, was zero.
The problem formulation for computing the slacks was (non-negativity constraints not shown):
maxw1þw2þs1þs2þs3þ s4þs5þs6
subject to
38:14b1þ38:14b2þ 38:14b3þw1¼ 38:14
153:85b1þ 0b2þ 12:54b3þw2¼ 153:85
1:60b1þ 1:76b2þ 1:78b3–s1¼ 1:60
25:22b1þ 35:30b2þ 36:30b3–s2¼ 25:22
8:52b1þ 8:37b2þ 7:93b3–s3¼ 8:52 Fig. 2Starting and ending growing stock volume when NPV is
maximized with 2 % or 5 % discount rate. Ending volume is the volume at the end of a 30-year management period
Table 1Values of input and output variables in the forest holding of Central Finland when NPV is maximized with 2 % discount rate, and the symbols of weights and slack variables used in the DEA model
Variable Weight Slack RFM CCF AAF Unit
Inputs
•Growing stock volume v1 w1 38.14 38.14 38.14 1000 m3
•Silvicultural costsa v2 w2 153.85 0 12.54 1000€/30 years
Outputs
•Net present value u1 s1 1.60 1.76 1.78 million€
•Harvested volume u2 s2 25.22 35.30 36.30 1000 m3/30 years
•Carbon balance u3 s3 8.52 8.37 7.93 Mg/30 years
•Scenic beauty index u4 s4 5.16 5.82 5.56 30-year average
•Annual berry yield u5 s5 34.53 38.73 37.90 kg/ha, 30-year average
•Habitat area u6 s6 165.33 199.93 186.0 ha, 30-year average
a
Timber sales are based on stumpage value. There are no harvesting cost to forest landowner
5:16b1þ 5:82b2þ 5:56b3–s4¼ 5:16
34:53b1þ 38:73b2þ 37:90b3–s5¼ 34:53
165:33b1þ199:33b2þ186:00b3–s6¼ 165:33
whereb1,b2andb3are the dual variables for RFM, CCF and AAF, respectively. In the solution, all slacks (wi for inputs and sr for outputs) were zero, which means that RMF was not weakly efficient but efficient.
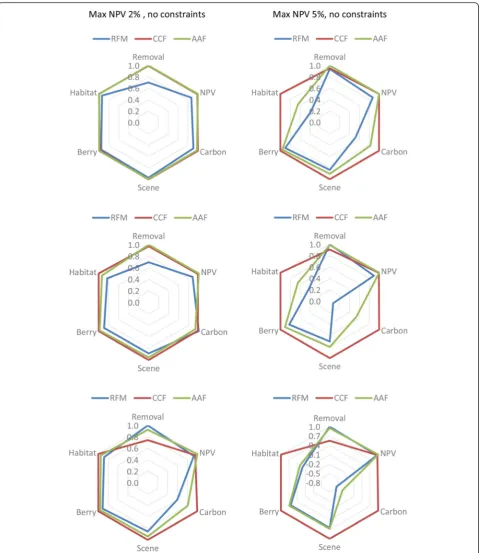
Efficiency of silvicultural systems
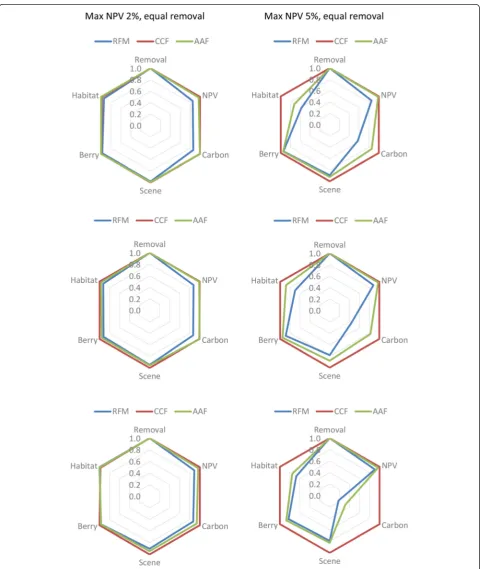
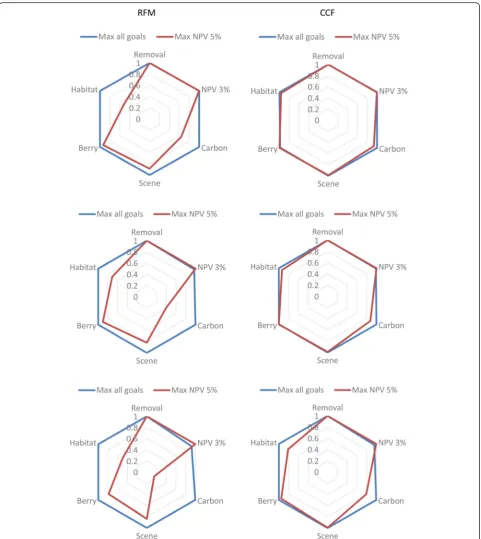
The relative amounts of the analyzed outputs in different silvicultural systems are visually depicted in Fig. 3 when NPV was maximized with a 2 % or 5 % discount rate. In South Finland, CCF and AAF were better than RFM with respect to all outputs leading to the conclusion that RFM was inefficient (Table 2). In all other cases, none of the systems was better than the others with respect of all analyzed outputs. For example, with a 2 % discount rate in Central Finland, RFM had a slightly better carbon
balance than CCF and AAF although it was clearly infer-ior in the other outputs. When the discount rate was 5 %, RFM resulted in higher removals than the other systems but it was not competitive in carbon balance, scenic beauty index, berry production or habitat area (Fig. 3, right panel).
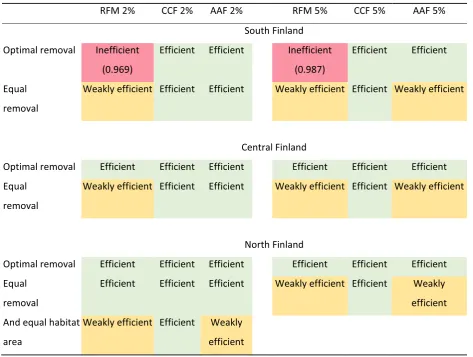
The DEA analyses indicated that all management sys-tems were efficient in Central and North Finland with both 2 % and 5 % discount rate (Table 2, Optimal re-moval) although CCF and AAF were better than RMF in terms of most ecosystem services. The obvious reason for the good result for RFM was that DEA selects the weights of the inputs and outputs in a way that is the most favor-able for the inspected management system. Since the results of Fig. 3 suggest that CCF and AAF may be more efficient than RFM (but DEA is unable to detect it), an-other set of plans was developed so that the removal was constrained to be equal in all management sys-tems (Fig. 4). The harvested volume was constrained to be equal to the mean of the non-constrained
solutions. With this constraint, differences in the other outputs were small when management was opti-mized with 2 % discount rate, i.e., at low cutting level
(Fig. 4, left panel). When the discount rate was 5 %, CCF was better than RFM in all outputs except removal (Fig. 4, right panel).
DEA applied to these constrained plans showed that RFM was now only weakly efficient except in North Finland with a 2 % discount rate where it was still
efficient (Table 2, Equal removal). CCF was efficient in all cases and AAF was efficient with 2 % discount rate and weakly efficient with 5 % rate. The northern holding
was further analyzed with 2 % discount rate by adding another constraint stating that the habitat area must be equal in all three management systems. With this add-itional constraint, only CCF remained efficient while RFM and AAF were weakly efficient (Table 2, Equal habitat area).
Efficiency in multi-objective management
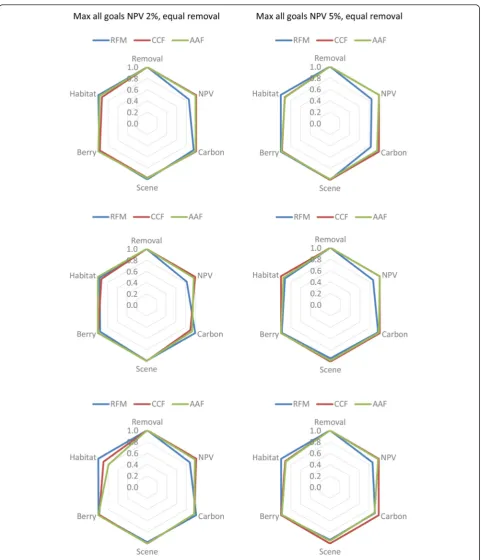
The previous analyses assumed that forest is managed from the view-point of a profit-oriented landowner. However, many forests, especially the public ones, are managed for multiple benefits. Figure 5 shows the out-puts in the optimal management when all outout-puts ex-cept removal are simultaneously maximized instead of only NPV. Multi-objective management planning was implemented by maximizing a utility function with equal weights for NPV, scenic beauty, carbon balance, berry yield and habitat area. The effect of units was eliminated by dividing each output by the single-objective max-imum of the output. Removal was fixed to the same level as in the previous analysis (average optimum of the three silvicultural systems with certain discount rate).
Differences in the outputs between silvicultural sys-tems were smaller than in single-objective management. The overall level of ecosystem services was nearly the same in all systems, except that NPV was 15 %–20 % smaller in RFM. The results can be interpreted so that the profitability of RFM decreases by 15 %–20 % if it is implemented in such a way that the outputs of other ecosystems services are similar as in CCF and AAF.
When the efficiency of multi-objective forestry was an-alyzed using the DEA method, all silvicultural systems turned out to be efficient with a 2 % discount rate al-though the removal was the same in all management systems. With a 5 % rate, RFM was weakly efficient in South and Central Finland, and it was efficient in North Finland. Again, the good performance of RFM may seem surprising since RFM had clearly lower profitability than the other management systems. The obvious reason was that the optimal DEA weights for RFM were zero for those inputs and outputs in which RMF was not good, namely NPV and silvicultural costs.
The low ability to detect efficiency differences is a rec-ognized problem of DEA, especially when the number of compared production systems is low, as in the current study (Cooper et al. 2011). One proposed way to allevi-ate this problem is to restrict the ranges of the weights of inputs and outputs, based for instance on stated pref-erences about the relative importance of different inputs and outputs (Thompson et al. 1990; Zhu 1996). In the multi-objective case, it can be assumed that all outputs included in the objective function are important, as are the silvicultural costs.
To prevent the weights of NPV and silvicultural costs from being zero, the following constraints were added to the problem formulation: v2> 0.001 (weight of silvicul-tural cost) and u1> 0.01 (weight of NPV). After this modification, only CCF remained efficient in all three holdings with both discount rates (Table 3). RFM was never efficient with 5 % discount rate. AAF was efficient in three out of six cases.
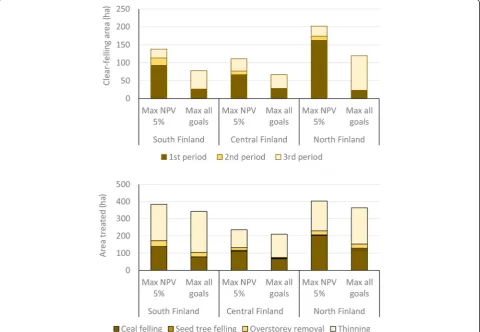
A closer inspection of the management prescriptions in RFM showed that multi-objective management leads to decreased clearfelling area during the first and second 10-year periods, but clear-felling area increases during the third period, as compared to the plan where NPV was maximized as the only objective (Fig. 6). Another difference was a smaller total clear-felling area and larger thinning area in multi-objective management.
The obvious reason for the postponed clear-cuttings in multi-objective management is that late clear-cuttings affect the ecosystem services only at the end of the 30-year period. Their effect on the 30-30-year average of the ecosystem services remains low, making RFM apparently good option when only the 30-year period is analyzed. However, clear-cuttings during the third period decrease the outputs of ecosystem services that can be expected after the 30-year period analyzed in this study. There-fore, the seemingly good result for RFM was achieved as the cost of the ecosystem services of later periods.
Effect of discount rate
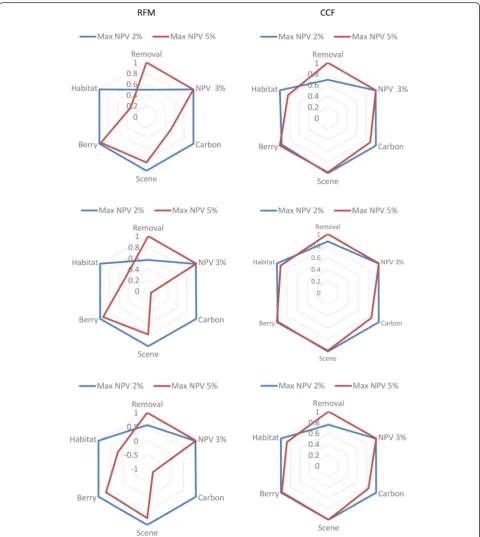
The outputs of ecosystem services in the saver’s and in-vestor’s forest are visually depicted in Fig. 7. The saver maximized NPV with a 2 % discount rate while the in-vestor used 5 %. Figure 7 shows the relative 3 % NPV (instead of 2 % and 5 %) since it does not make sense to compare NPVs calculated with different discount rates.
The comparisons show that, in RFM, the saver’s forest produced more ecosystem services than the investor’s forest, except harvested timber, which was greater in the investor’s forest. The NPV calculated with a 3 % rate was almost equal for both forest owners. When the silvicul-tural system was CCF, the provision of ecosystem ser-vices was rather insensitive to discount rate. In CCF the saver’s forests had more Siberian jay habitats and better carbon balances but the scenic beauty index and berry yields were almost the same with both discount rates.
Effect of single- vs. multi-objective management
In RFM, multi-objective management produced more outputs except removal (which was constrained to be equal) and NPV (which was maximized in single-objective management). Differences in favor of multi-objective management were substantial especially in car-bon balance and habitat area (Fig. 8, left panel). NPV differences were small, which means that great improve-ments in ecosystem services could be obtained with small losses in economic profitability. However, this fa-vorable situation may not be sustainable, since multi-objective RFM had many clear-fellings during the third 10-year period (Fig. 6), which would decrease the supply of several ecosystem services after the end of the 30-year period analyzed in this study.
Differences between single- and multi-objective man-agement were much smaller in CCF (Fig. 8, right panel). Only in the forest that represented North Finland, habi-tat area and carbon balance were clearly lower in single-objective management. Therefore, it can be concluded that in CCF the provision of ecosystem services does not depend as much on management objective as in RFM.
Synthesis
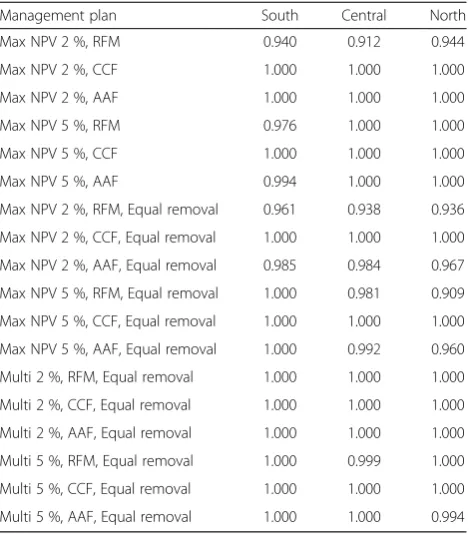
Since the low number of silvicultural systems makes it dif-ficult for DEA to detect efficiency differences, an add-itional analysis was conducted in which all management plans developed for a certain region were included in the same analysis (Table 4). The NPV used as output in the
Fig. 6Clear-felling area of the three 10-year periods in single-objective (Max NPV 5 %) and multi-objective (Max all goals) management (top) and the areas of different cutting types (bottom)
Table 3Efficiency ratio in multi-objective management when the weight of silvicultural cost in the DEA model is at least 0.001 and the weight of net present value is at least 0.01 and NPV is calculated with 2 % or 5 % discount rate
RFM 2 % CCF 2 % AAF 2 % RFM 5 % CCF 5 % AAF 5 %
South Finland 0.964 1.000 0.995 0.841 1.000 0.997
Central Finland 1.000 1.000 1.000 0.914 1.000 1.000
DEA model was calculated with 3 % discount rate since NPVs calculated with different rates cannot be compared. However, when the plans were developed, NPV was maxi-mized with either 2 % or 5 % discount rate.
In this analysis, RFM in which NPV was maximized with a 2 % discount rate stood out as the most
inefficient management plan. Surprisingly, RFM where NPV was maximized with 5 % discount rate per-formed rather well, most probably because it was good in terms of harvested volume and NPV. How-ever, it was inefficient on South Finland when har-vested volume was not constrained, and Central and
North Finland when harvested volume was equal in all three silvicultural systems. CCF was the only silvi-cultural system which was always efficient. In RFM, multi-objective management plans were more efficient than single-objective profit-oriented plans.
Conclusions
Usability of DEA
The results regarding the efficiency of silvicultural sys-tems agree with common sense and expectations. One benefit of the DEA method is that it takes into account
both inputs and outputs, and any number of variables can be included in the analysis. The data requirements of DEA are low. However, the discretionary capacity of DEA was limited in this study where the number of compared production systems was low (Cooper et al. 2011). In the current study, the main role of DEA was to provide a proof for visually evident efficiency differences. Two alternative ways were employed to alleviate the problem of low discretionary power of DEA: fixing some of the outputs to the same level in different silvicultural systems and restricting the ranges of multipliers in the DEA model. The latter method has been used in earlier research (Thompson et al. 1990; Zhu 1996) but the former approach is less common. In most cases where DEA is used, only the outputs and inputs are known and the analysis is based on historical data, i.e., past perform-ance is analyzed. In this study, which was a theoretical pre-implementation analysis, is was possible to utilize the capabilities of the forest planning system to fix some outputs to help detect efficiency differences. The used approach is visualized in Fig. 9 for two outputs and two production systems. When each of the two production systems is better in one output, the DEA assumes the solid curve to be the production frontier and it is con-cluded that both systems are efficient. However, the
forest planning system can be used to develop plans where the removals are equal in both systems (gray cir-cles in Fig. 9). These modified plans, together with the initial plans, reveal that the production frontier is further from origin in CCF. In DEA, RFM will now have a non-zero slack and the conclusion is that RFM is only weakly efficient.
DEA proved to be a suitable tool for analyzing effi-ciency differences between silvicultural systems in the same forest holding. Comparison of different forest holdings would be more problematic since it is very dif-ficult to quantify the inputs. Temperature sum, average site fertility, and growing stock volume by tree species could be used as surrogates. However, growing stock volume does not describe differences in stand structure, which may also be important for ecosystem services.
Efficiency of silvicultural systems
CCF proved to be the most efficient silvicultural system in the production of ecosystem services when NPV was maximized. The result is not surprising since CFF ex-cludes clearfelling, which is detrimental to bilberry, scenic beauty and Siberian jay habitat. Cowberry may benefit from clearfelling, but bilberry suffers from it for a long time (Miina et al. 2016). As a result of the oppos-ite effects of clearfelling on bilberry and cowberry yields, the total berry production was rather insensitive to the type of management. In Silvennoinen et al. (2002), clear-felling was perceived to decrease scenic beauty “very much” when the effect of different cuttings were evalu-ated using a verbal scale ranging from “worsens very much”to“improves very much”.
Table 4Efficiency of different silvicultural systems and management plans when all plans of a certain region were included in the same data envelopment analysis (DEA)
Management plan South Central North
Max NPV 2 %, RFM 0.940 0.912 0.944
Max NPV 2 %, CCF 1.000 1.000 1.000
Max NPV 2 %, AAF 1.000 1.000 1.000
Max NPV 5 %, RFM 0.976 1.000 1.000
Max NPV 5 %, CCF 1.000 1.000 1.000
Max NPV 5 %, AAF 0.994 1.000 1.000
Max NPV 2 %, RFM, Equal removal 0.961 0.938 0.936
Max NPV 2 %, CCF, Equal removal 1.000 1.000 1.000
Max NPV 2 %, AAF, Equal removal 0.985 0.984 0.967
Max NPV 5 %, RFM, Equal removal 1.000 0.981 0.909
Max NPV 5 %, CCF, Equal removal 1.000 1.000 1.000
Max NPV 5 %, AAF, Equal removal 1.000 0.992 0.960
Multi 2 %, RFM, Equal removal 1.000 1.000 1.000
Multi 2 %, CCF, Equal removal 1.000 1.000 1.000
Multi 2 %, AAF, Equal removal 1.000 1.000 1.000
Multi 5 %, RFM, Equal removal 1.000 0.999 1.000
Multi 5 %, CCF, Equal removal 1.000 1.000 1.000
Multi 5 %, AAF, Equal removal 1.000 1.000 0.994 “Multi”means that multi-objective utility function was maximized, and the percentage (2 % or 5 %) is the discount rate of the net present value (NPV) which was maximized (either as the only objective or as a part of multi-objective utility function). The variable used in DEA was NPV calculated with 3 % discount rate
AAF was found to be less efficient than CCF. This re-sult was surprising in multi-objective management since all the management schedules included in CCF were also possible in AAF. The probable reason were the weights of the used utility function. Increasing the weights of those outputs which had smaller values in AAF than in CCF would most probably result in at least the same ef-ficiency for AAF as was obtained for CCF. On the other hand, in this case AAF would most probably be very close to CCF. Similarly as in Fürstenau et al. (2007), maximizing NPV with increasing discount rate de-creased the supply of most ecosystem services.
The conclusions about efficiency depend on the choice of outputs included in the analysis. For instance, enlar-ging the set of species for which habitat areas are calcu-lated would most probably increase the efficiency of silvicultural systems which allow both even-aged and uneven-aged management, especially if the weights of the outputs are constrained to reflect the importance of outputs. Tikkanen et al. (2007) presented habitat suit-ability models for 27 red-listed saproxylic boreal species, of which 7 prefer warm and sunny sites and 11 prefer moist and shady environments (the remaining 9 species being indifferent). Therefore, creation of habitats for many species calls for diversified forest management, which can be obtained by using a mixture of different silvicultural systems (Boncina 2011).
The conclusions of this study cannot be directly gener-alized to other regions since the importance of ecosys-tem services vary and the relationships between forest structure and ecosystem are not similar everywhere. For example, erosion control and water management are not critical ecosystem services in Finland, which is a flat and moist country, but they may be the most important eco-system services in mountainous and dry regions. How-ever, it is not likely that the ranking of silvicultural systems would be different in other regions or when the set on ecosystem services is enlarged.
In conclusion, the findings of this study can be sum-marized as follows:
CCF provides more ecosystem services than RFM
Multi-objective management provides more ecosystem services in addition to harvested timber yields when compared to maximum profit
management
Use of a low discount rate (resulting in low cutting level and high growing stock volume) leads to better supply of most ecosystems services than the use of high discount rate (high cutting level, low growing stock volume)
When NPV is maximized with a high discount rate RFM leads to low provision of ecosystem services in addition to timber
In CCF, the provision of ecosystem services is less sensitive to changes in discount rate and
management objective than in RFM
Competing interests
The author declares that he has no competing interests.
Authors’contributions
TP conducted the analyses and wrote the manuscript.
Received: 23 February 2016 Accepted: 8 April 2016
References
Boncina A (2011) History, current status and future prospects of uneven-aged forest management in the Dinaric region: an overview. Forestry 84(5):467–478
Chang SJ (1981) Determination of the optimal growing stock and cutting cycle for an uneven-aged stand. Forest Sci 27(4):739–744
Chang SJ (1990) An economic comparison of even-aged and uneven-aged management of southern pines in the mid-South. In: Hickman CA (ed) Proceedings of the Southern Forest Economics Workshop on Evaluating Even- and All-Aged Timber Management Options for Southern Forest Lands, March 29-30, 1990, Monroe, LA. USDA Forest Service, Southern Experimental Station, New Orleans, pp 45–52
Cooper WW, Seiford LM, Zhu J (2011) Data envelopment analysis. History, models and interpretations. In: Cooper WW, Seiford LM, Zhu J (eds) Handbook on data envelopment analysis, International series in Operational Research & Management Science 164, doi: 10.1007/978-1-14419-6151-8_1. Springer Science + Business Media. pp 1–39
Diaci J, Kerr G, O’Hara K (2011) Twenty-first century forestry: integrating ecologically based, uneven-aged silviculture with increased demands on forests. Forestry 84(5):463–465
Fürstenau C, Badek FW, Lasch P, Lexer MJ, Linder M, Mohr P, Suckow F (2007) Multiple-use forest management in consideration of climate change and the interests of stakeholder groups. Eur J Forest Res 126:225–239
Gadow Kv, Kurttila M, Leskinen P, Leskinen L, Nuutinen T, Pukkala T (2007) Designing forested landscapes to provide multiple services. CAB Reviews: Perspectives in Agriculture, Veterinary Science, Nutrition and Natural Resources 2007 (2), No. 038: 1-15
Haight RG, Monserud RA (1990) Optimizing any-aged management of mixed-species stands. I. Performance of a coordinate search process. Can J Forest Res 20(1):15–25
Laasasenaho J (1982) Taper curve and volume equations for pine spruce and birch. Communications Instuti Forestalis Fenniae 108:1–74
Laiho O, Lähde E, Pukkala T (2011) Uneven- vs. even-aged management in Finnish boreal forests. Forestry 84(5):547–556
Liski J, Tuomi M, Rasinmäki J (2009) Yasso07 user-interface manual. Finnish Environment Institute. 12 pp + Appendix
Lundmark T, Bergh J, Nordin A, Fahlvik N, Poudel BC (2016) Comparison of carbon balances between continuous-civer and clear-cut forestry in Sweden. Ambio 14(suppl2):203–213
Miina J, Hotanen J-P, Salo K (2009) Modelling the abundance and temporal variation in the production of bilberry (Vaccinium myrtillusL.) in Finnish mineral soil forests. Silva Fennica 43:577–593
Miina J, Pukkala T, Kurttila M (2016) Optimal multi-product management of stands producing timber and wild berries., Manuscript
O’Hara KL (2011) The historical development of uneven-aged silviculture in North America. Forestry 84(5):339–346
Pukkala T (2004) Dealing with ecological objectives in the Monsu planning system. Silva Lusitana XII, Special issue (2004): 1-15
Pukkala T (2014) Does biofuel harvesting and continuous cover management increase carbon sequestration? Forest Policy Econom 43:41–50
Pukkala T (2016) Plenterwald, Dauerwald, or clearcut? Forest Policy Econ 62:125–134 Pukkala T, Lähde E, Laiho O, Salo K, Hotanen J-P (2011) A multifunctional
comparison of even-aged and uneven-aged forest management in a boreal region. Can J Forest Res 41:851–862
Pukkala T, Lähde E, Laiho O (2013) Species interactions in the dynamics of even- and uneven-aged boreal forests. J Sustain Forest 32:1–33
Puettmann KJ, Wilson S, Baker SC, Donoso PJ, Drössler L, Amente G, Harvey BD, Knoke T, Lu Y, Nocentini S, Putz FE, Yoshida T, Bauhus J (2015) Silvicultural alternatives to conventional even-aged forest management - what limits global adoption? Forest Ecosystems 2:8
Repola J (2009) Biomass equations for Scots pine and Norway spruce in Finland. Silva Fennica 43(4):625–647
Repola J, Ojansuu R, Kukkola M (2007) Biomass functions for Scots pine, Norway spruce and birch in Finland. Working Papers of the Finnish Forest Research Institute 53. pp. 28
Rummukainen A, Alanne H, Mikkonen E (1995) Wood procurement in the pressure of change–resource evaluation model till year 2010. Acta Forestalia Fennica 248:1–98
Salo K (2015) Metsä–Monikäyttö ja ekosysteemipalvelut. Natural Resources Institute Finland. Joensuu, Finland, p. 326
Schütz J-P, Pukkala T, Donoso PJ, Gadow Kv. 2012. Historical emergence and current application if CCF, in: Pukkala, T, von Gadow, K. (eds.), Continuous Cover Forestry. Springer. Dordrecht, The Netherlands, ISBN 978-94-007-2201-9, pp. 1–28
Siiskonen H (2007) The conflict between traditional and scientific forest management in 20thcentury Finland. Forest Ecol Manage 249:125–133
Silvennoinen H, Alho J, Kolehmainen O, Pukkala T (2001) Prediction models of landscape preferences at the forest stand level. Landscape Urban Plann 56(1-2):11–20
Silvennoinen H, Pukkala T, Tahvanainen L (2002) Effect of cuttings on the scenic beauty of a tree stand. Scand J Forest Res 17:263–273
Tahvonen O (2009) Optimal choice between even- and uneven-aged forestry. Nat Res Model 21(4):525–550
Thompson RG, Langemeier L, Lee C, Lee E, Thrall R (1990) The role of multiplier bounds in efficiency analysis with application to Kansas farming. J Econometrics 46:93–108
Tikkanen O-P, Heinonen T, Kouki J, Matero J (2007) Habitat suitability models of saproxylic red-listed boreal forest species in long-term managements: cost effective measures for multi-species conservation. Biol Conserv 140:359–372 Tuomi M, Rasinmäki J, Repo A, Vanhala P, Liski J (2011) Soil carbon model
Yasso07 graphical user interface. Environ Model Softw 26(11):1358–1362 Turtiainen M, Miina J, Salo K, Hotanen J-P (2013) Empirical prediction models for
the coverage and yields of cowberry in Finland. Silva Fenn 47(3):22 Wehenkel C, Corral-Rivas JJ, Gadow K (2014) Quantifying differences between
ecosystems with particular reference to selection forests in Durango/Mexico. Forest Ecol Manag 316:117–124
Zhu J (1996) Data envelopment analysis with preference structure. J Operat Rese Soc 47(1):136–150
Submit your manuscript to a
journal and benefi t from:
7Convenient online submission
7Rigorous peer review
7Immediate publication on acceptance
7Open access: articles freely available online
7High visibility within the fi eld
7Retaining the copyright to your article