Abstract
Background:Machining using vertical CNC end mill is popular in the modern material removal industries because of its ability to remove the material at a fast rate with a reasonably good surface quality.
Methods:In this work, the influence of important common machining process variables like feed, cutting speed and axial depth of cut on the output parameters such as surface roughness and amplitude of tool vibration levels in Al-6061 workpieces has been studied. With the use of experimental result analysis and mathematical modelling, correlations between the cutting process conditions and process outputs are studied in detail. The cutting experiments are planned with response surface methodology (RSM) using Box-Behnken design (BBD). Results:This work proposes a multi-objective optimization approach based on genetic algorithms using experimental data so as to simultaneously minimize the tool vibration amplitudes and work-piece surface roughness. The optimum combination of process variable is further verified by the radial basis neural network model.
Conclusions:Finally, based on the multi-objective optimization approach and neural network models an interactive platform is developed to obtain the correct combination of process parameters.
Keywords:Al-6061 work-piece, Box-Behnken design, Multi-objective optimization, Neural network, Surface roughness, Tool vibration amplitudes
Background
For the metal-working industry, a continuous reduction in manufacturing cost is desirable. An important issue related to reduce overall cost consists of the removal of undesirable or excess work piece material during the machining process. Among different types of material removal operations, end-milling is most important com-mon milling operation due to its capability of producing complex geometric surfaces with reasonable accuracy and surface finish. Over the last two decades, several works focused on the optimum selection of machining parameters based on various criteria such as using basic mathematical models. Some contemporary literature is first presented. Brito et al. (2014) developed a robust parameter design for the process parameters using the
multi-objective methods. The numerical results are vali-dated with the experimental cutting tests. Mathivanan et al. (2016) studied the influence of cutting parameters on milling of the composite materials. A CNC end mill-ing was used to machine the composite laminates at various combinations of speeds and depth of cuts. Numan durakbasa et al. (2015) presented the various end milling process parameters as well as the coatings on the surface quality of the machined parts of AISI H13 hot work steel. Some researchers (eg., Hocheng et al. (1997), Arokiadass (2012) and Surinder (2015)) investigated the machining characteristics of an alumin-ium based composite alloy for the end-milling process. Experiments were conducted based on the central com-posite design and Analysis of Variance (ANOVA) was used to build the mathematical model. Zhang et al. (2016) implemented a systematic optimization approach to obtain the pareto-optimal values of cutting process * Correspondence:[email protected]
Department of Mechanical Engineering, National Institute of Technology Rourkela, Rourkela, Odisha 769008, India
parameters. Dikshit et al. (2014a, 2014b) studied the cutting process parameters in dry machining of alumin-ium alloys. Response surface methodology was planned to carry out the experiments and further genetic algorithms were implemented to obtain the optimal parameters such as the cutting speed, feed per tooth, axial and radial depth of cut. Karkalos et al. (2016) focused on the machining of Titanium alloy with the peripheral down milling process and further optimal control studies were implemented to minimize the surface roughness. Ratnam et al. (2016) studied the turn-milling process in tangential and orthog-onal directions to minimize the surface roughness of ex-truded brass material. Several recent works focussed on the optimal machining parameters for multi-pass milling operations by considering the statistical and artificial intel-ligent techniques (Wang et al. 2005; Sukumar et al. 2014; Venkata Rao and Pawar 2010; Das et al. 2016; Ren et al. 2016). The efficiency of a neural network model was esti-mated by conducting the numerical simulations and ex-periments. Several studies had been focussed on the optimization of important cutting process parameters using intelligent optimization techniques like genetic algo-rithms and radial basis neural networks (Briceno et al. 2002; Mounayri et al. 2010; Mounayri et al. 2005). Using, different neural network models and optimization algo-rithms the impact of the surface roughness on the process parameters are extensively studied (Palanisamy et al. 2007; Palanisamy and Kalidass 2014; Zain et al. 2011; Saffar and Razfar 2010). Khorasani et al. (2016) studied the effects of cutting parameters and cutting fluid pressure intensity on the surface roughness of milled parts. The im-portant parameters were modelled and analysed using both the multi-layer perceptron and radial basis neural networks.
In spite of above works, very few works are found in literature dealing with the optimal process parameter selection based on simultaneously minimization of tool vibration amplitudes during cutting as well as surface roughness average values of the workpiece. The milling experiments are conducted on the CNC vertical milling machining centre by considering three levels of feed rate, spindle speed and axial depth of cut. Using the response surface methodology with Box-Behnken design, a math-ematical model is developed to predict the surface roughness and amplitude of tool vibration levels in terms of the cutting process variables. Using the experi-mental data, neural network model is created to approximate the relationship between the three process parameters and two output variables. Furthermore, the equations obtained from response surface methodology are employed as function-estimators for GA-based optimization module, which attempts to minimize sim-ultaneously the tool vibration amplitude and average roughness. The resulting optimum process parameters
are reported and discussions are made. Thus, data generation, interaction of responses, implementation of multi-objective genetic algorithms, parallel radial basis neural network modelling for comparison of results is explained one after the other.
Methods
Experimental work is conducted on a CNC milling cen-ter (MAXMILL-make MTAB) employing user defined spindle speeds, depth of cut and feed motions. A 12 mm diameter HSS tool with four cutting flutes with 50 mm overhang and a spindle speed of 4000 rpm is employed through-out all the experiments. End milling operations are carried out with full percentage of radial immersion is conducted on the Al6061 work pieces. The chemical composition of this alloy is: 0.3% Cu, 0.04% Mn, 0.85% Mg, 0.04% Ti, 0.5% Si, 0.2% Cr, 0.5% Fe, 0.25% Zn, and rest is aluminium. All the specimens were taken in the form of blocks of sizes 100 × 80 × 10 mm. At the specified spindle speeds and depth of cut, the vibration amplitudes are recorded by the following instruments: an accelerometer (PG 109 M0, frequency range 1 to 10,000 Hz), a 4-channel digital oscilloscope (model-DPO 43034) with charge amplifier (Model: CA 201 A0). The accelerometer is placed at the housing of the spindle and the corresponding data are recorded in the oscilloscope. Figure 1 shows the experimental set-up employed in present work on the machining center.
In order to assess the quality of the product, surface roughness is an important measure. It greatly influences the performance of mechanical parts as well as produc-tion cost. Proper selecproduc-tion of cutting parameters pro-duces a good surface finish. The roughness of the machined surfaces was examined by the Talysurf instru-ment as shown in the Fig. 2.
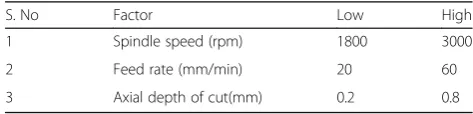
Box-Behnken design (BBD) of response surface meth-odology (RSM) is used to get the fifteen sets experi-ments with a mathematical model. This method generally requires fewer experiments compared to the rotational central composite design (RCCD) of RSM. The three machining parameters are selected to study the feed (mm/min), speed (rpm) and axial depth of cut (b). These three machining parameters are selected based on the preliminary trial tests. Table 1 shows the machining parameters and their levels.
It is generally, sufficient to fit a quadratic model and contains the linear terms, squared terms and products of factors. Table 2 shows the experimental outcomes of the input response parameters.
Response surface modeling
to develop a relation between input parameters and performance characteristics. During modeling of manu-facturing processes using RSM, sufficient data is col-lected through design of experiment. In general, a second-order regression model is mostly developed because first-order models often give some lack-of-fit. All the input process parameters are assumed to be measurable quantity during modeling and the corre-sponding responses can be expressed as follows:
y¼f x1;x2; ::::::;xp
ð1Þ
where x1, x2, x3, …, xp are input process parameters
and y is response. During experimentation, it is assumed that all the input parameters are controllable and have negligible errors. It is also required to find a suitable approximation between input variables and responses. The second-order RSM model used for modeling of the experimental data is given below:
y¼b0þ
Xk
i¼1
bixiþ
Xk
i¼1
biix2i þ
X
i
X
j
bijxixj ð2Þ
where b0 is constant and bi,bii, bij ……, are regression coefficients determined by least squares method. The second-order mathematical model for amplitude of tool vibration level (A) and surface roughness (Ra) has been
developed from the experimental data using Minitab software. The second order mathematical model for predicting the A and Ra are given as:
Amplitude Að Þ ¼ ð−0:064416−0:002188f þ0:000296N−0:556870b þ0:000127f2þ0:476204b2 −0:000002f N−0:007042f bþ0:000124NbÞ
ð3Þ
Surface roughness Rð Þ ¼ ð−a 4:31386−0:00399f
þ0:00554N−4:83889b þ0:00004f2−0:95278b2
−0:00003f Nþ0:07750
f bþ0:00083NbÞ ð4Þ
The coefficients in the above expressions signifies the weightage factorial values on the output responses. The positive and negative signs of the coefficients reflect the respective proportionality.
Fig. 1Experimental set-up employed for in-situ vibration measurements
Fig. 2Talysurf instrument for surface roughness used
Table 1Machining parameters and their levels
S. No Factor Low High
1 Spindle speed (rpm) 1800 3000
2 Feed rate (mm/min) 20 60
Multi-objective optimization
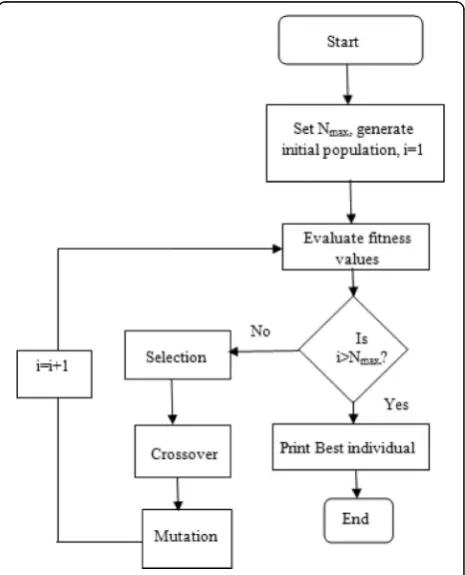
In order to obtain the optimal solutions for different de-sign problems with various input data sets optimization methods are needed severely. In single optimization problem, there is only one output criterion and such work has been studied over the past 50 years. When there is more than one objective, a different treatment is required. The multi-objective problems ascend in the complex real world industries like machining, design, transportation industries etc. It is seen that, all the im-portant real world practical problems involving multiple criteria with several constraints are drawing much atten-tion towards the multi-objective optimizaatten-tion. These problems could be effectively solved with less computa-tional effort and high accuracy. In multi-objective optimization problems, genetic algorithms approach is a better technique compared to other methods and has received considerable attention by the researchers. GA is based on the principle of survival for the fittest. In this method, initially a population of strings is selected ran-domly. These are encoded in binary digits and it is trad-itionally used to signify the chromosomes using with zeros and ones. Further, the fitness value (maximization or minimization problems) is computed. Further to create a new population, operations like reproduction, crossover and mutation were applied consecutively. Once the new population is generated it is further evalu-ated and tested for the conformability.
The aim of this study is to minimize the amplitude of vibrations and at the same time minimize the surface roughness (Ra). Here, the response parameters (A and
Ra) are non-linear functions of feed rate (f ), spindle
speed (N), and axial depth of cut (b). The objective func-tion is defined as follows:
Minimize f Xf ð Þ;g Xð Þg ð5Þ
Subjected to variable bounds
1800≤N≤3000 ð6Þ
20≤f≤60 ð7Þ
0:2≤b≤0:8 ð8Þ
WithX = [N, f, b]Tand N,fandbrepresent the speed, feed and axial depth of cut. The function of f(X) and
g(X) represents the amplitude of vibration and surface roughness, which are unknown and to be fitted from the experimental data.
Once all the genetic algorithm operators are applied successfully, it will produce a new set of population. Fur-ther they are decoded and the corresponding objective function values were calculated. All these operations would complete one generation of genetic algorithm. The iterations will be further continued till the required termination condition is obtained. The flow of genetic algorithm concepts is shown in Fig. 3.
Table 2Experimental layout for the BBD
Std Order
Feed(f) (mm/min)
Speed(s) (rpm)
Axial depth of cut(b)(mm)
Amplitude of vibration level(A)(mv)
Surface roughness (Ra)μm
1 20 1800 0.5 0.0640 0.800
2 60 1800 0.5 0.1430 0.333
3 20 3000 0.5 0.1128 2.200
4 60 3000 0.5 0.0944 0.333
5 20 2400 0.2 0.1780 2.860
6 60 2400 0.2 0.1980 0.530
7 20 2400 0.8 0.2220 0.800
8 60 2400 0.8 0.0730 0.330
9 40 1800 0.2 0.1462 0.200
10 40 3000 0.2 0.0834 1.130
11 40 1800 0.8 0.0634 0.200
12 40 3000 0.8 0.0896 1.730
13 40 2400 0.5 0.0752 1.200
14 40 2400 0.5 0.0752 1.200
15 40 2400 0.5 0.0720 1.200
Results and discussions
All the analysis of the data samples are performed by using the Minitab software. Initially the data of the input and output factors were checked for normality using the probability plots as shown in the Fig. 4. It is observed from the normal probability plots of the amplitude and surface roughness, all the data points are distributed along the normal line which confirms that all the points are normally distributed. The second plot of both the outputs reveals that the all the data points are not followed any particular trend which clearly suggests that this design is well fitted with the given data set and it is varied between the limits between the−2 to 2. The third plots of the response shows the frequency histogram of data distribution. The fourth plot of the responses shows
the residue versus the observation data points highlights the random points which signifies non-significance of experimental order as far as the responses are concerned.
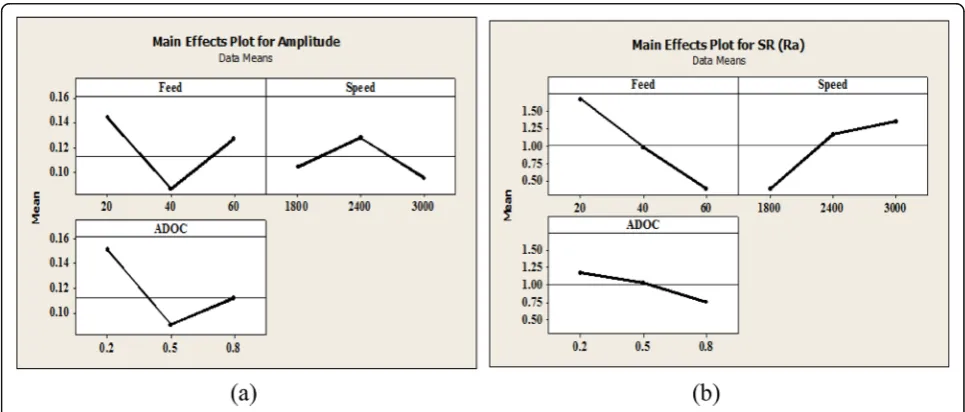
Figure 5 illustrates the main effect plot for means of amplitude of vibration level and surface roughness for the level of process parameters. Main effects plots are drawn to relate several factors at same time and display the response means for each factor level in a sorted order. It graphically compares results of input process parameters at various stages and visualize the results of the response parameters for different combinations of inputs. A relatively flat line shows the mean of all the responses in the data table of the experiments. This indi-cates that the points near to the mean line has less effect
Fig. 4Residual plots for the response.aNormality testing for amplitude.bNormality testing for surface roughness
on the response parameters whereas the points that are lie on the above and below the mean line are having greater effect on the outputs. The effects are the differ-ences between the means and the reference line. For the case of amplitude of vibration (A), the optimum process parameters were feed of 20 mm/min, speed of 2400 rpm and the axial depth of cut 0.2 mm as shown in Fig. 5(a). Similarly, in surface roughness the parameters are feed 20 mm/min, speed of 3000 rpm and axial depth of cut of 0.2 mm.
Interaction plots of responses
The 3-D surface plots are considered as a function of two factors at a time. These response factors at fixed levels provides information of interaction effects with the two input factors, and helps to identify the optimum level for each variable to get the maximum response. Figure 6 shows the surface plots of ampli-tude and surface roughness with variation in the values of feed and speed. It is observed that as the spindle speed increases from 2000 to 2500 rpm the amplitude of the tool vibration level increases and re-duces further. In the surface roughness plots, it is ob-served that as the feed rate increases the roughness
value increases and there less significance due to spindle speeds. The optimal surface roughness is ob-tained with the combination of high spindle speed and with low feed rate values.
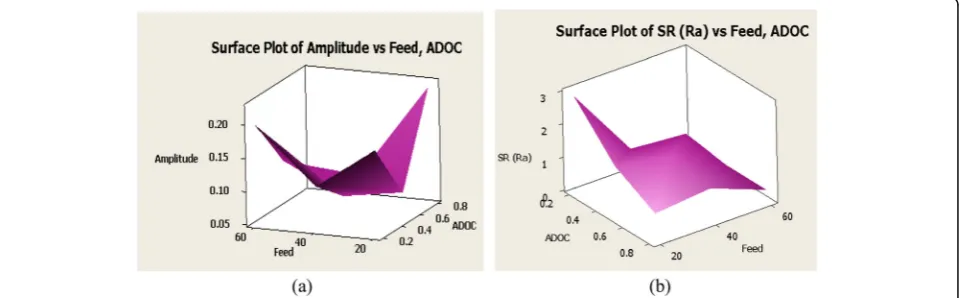
Similarly the surface plots are obtained for the responses versus the axial depth of cut (ADOC) and feed rate as shown in Fig. 7. It is observed that for the feed rate of 40 mm/min and a depth of cut of 0.4 mm, the amplitude of tool vibration levels are low. Thereafter, as the feed and depth of cut increases the vibration levels also raises significantly. The surface roughness value in-creases at a depth of cut 0.2 mm and a feed rate of 20 mm/min. Further, as the feed rate and depth of cut increases, there is a downfall in the surface roughness values.
Further the resposne plots are obtained for the depth of cut and speed as shown in Fig. 8. At a low speeds and depth of cuts the amplitude of vibration levles rises. Similary the surface roughness value is high at 2500 rpm at a feed rate of 0.2 mm depth of cut. As the speed increases there is low surface roughness values at the depth of 0.2 mm. This signifies that high speeds and low depths of cut are preferable to obtain the good surface finish.
Fig. 6Interaction plots of response with feed and speed.aAmplitude.bsurface rourghness
Training with radial basis function (RBF) neural netwoks
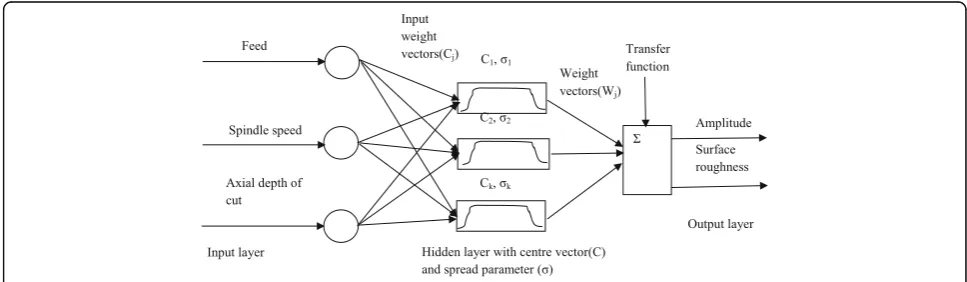
Recently, the radial basis neural network, has been draw-ing attention due to its simple network structure which reduces the lengthy mathematical calculations and the good generalization capability as compared to the other popular neural network techniques. In general, the RBF networks consists of three layers such as (a) the input layer (b) the hidden layer and (c) the output layer. The hidden layer neurons are activated by the radial basis function. The model data shown in the Table 2 is trained using a radial basis neural network model trained with various input vectors so as to reduce the error between the plant data and neural network outputs. In most of these networks, the neuron in the hidden layer generally possesses the transfer function which is radially symmet-rically in nature as shown in the Fig. 9.
In modelling the neurons of the hidden layer of the RBF network, to be radially symmetric it must contain the following three elements.
(i) Centre: It is the input domain vector, generally saved in the output layer weights in the hidden layer neuron.
(ii)Measurements of distance: It is considered as the distance between the hidden node centre (c) and the input parameter vector (x) called the Euclidian distance of measure and it is given as‖x(t)−cj(t)‖. (iii)Transfer function: It describes the functional
mapping of the central nodal vector distance and the output of the neuron. When the distance of measure between the two vectors are small, then preferably transfer such as Gaussian function is used which mainly amplifies the values of the output vector. The Gaussian function parameter width for the kthunit of the hidden neuron vector is evaluated by the following expression:
σk¼
ffiffiffiffiffiffiffiffiffiffiffiffiffiffiffiffiffiffiffiffiffiffiffiffiffiffiffiffiffiffiffi
1
P XP
P¼1
ck−ckp
2
v u u
t ð9Þ
Where the P is the value determined heuristically for the method of the closest neighbors; given a cluster centerck, letk1, k2,……,kPbe the indices of the P nearest neighboring cluster centers.
Fig. 8Interaction plots of response with depth of cut and speed.aAmplitude.bsurface rourghness
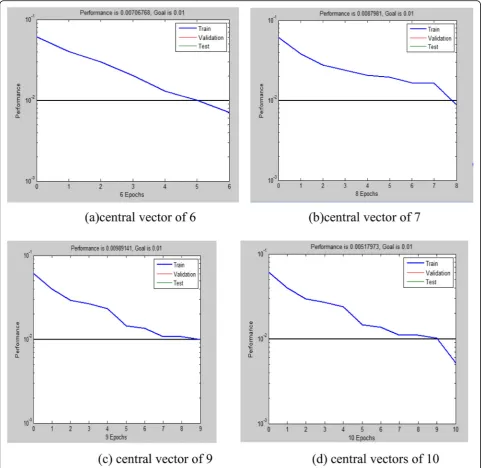
Fig. 10Trained neural network Skelton for different input vectors.acentral vector of 6.bcentral vector of 7.ccentral vector of 9.dcentral vectors of 10
Table 3Output results of the trained neural network model
Case Inputs Outputs
f in mm/ min
N in rpm
b in mm
Amplitude of vibration(A) in mv Surface roughness (Ra) inμm
Initial Value RBF Value % error Initial Value RBF Value % error
1 20 1800 0.5 0.064 0.06479 0.005 0.8 0.824 0.0002
2 20 3000 0.5 0.1128 0.1228 0.001 2.2 1.45 0.07
3 40 1800 0.2 0.1462 0.1189 0.002 0.2 0.49 0.002
4 40 3000 0.8 0.0896 0.0912 0.0001 1.73 1.56 0.0017
data and experimental output data are compared and depicted in Table 3.
Using the RBFN, the percentage of error is less than 1% for the central vector of 9. It is confirmed from these above simulations, that the level of error are acceptable. The modeled algorithms in this work could be imple-mented and it can be further used efficiently in the esti-mation of correct process parameter studies.
Optimization using multi-objective GA
In present work, the above process is simulated with a population size of 60, selection type is tournament, pareto front population fraction, crossover and mutation probability are selected to be 0.35, 1 and 0.001, respect-ively. MATLAB GA toolbox is used in this work. Figure 11 represents the pareto optimal solution for the two objective functions simultaneouly. It is observed that the optimal minimum functional value obtained from the plot as the amplitude of vibrations as 0.251mv and surface roughness as 2.615μm.
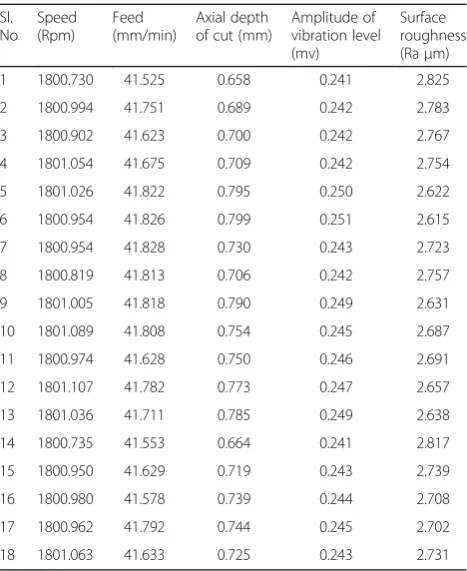
A pareto-optimal set of 18 solutions is obtained as shown in Table 4. Moreover, all the solutions in the Pareto-optimal set are almost close to each other but run 6 the values of amplitude and roughness were nearly minimum. The optimal cutting process parameter set is
obtained as speed of 1800.954 rpm, feed as 41.826 mm/ min and axial depth of cut as 0.799 mm respectively.
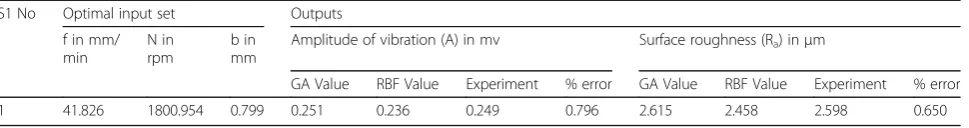
Further confirmation tests are conducted using the trained radial basis neural network model and by the experiments as shown in Table 5. Optimal input set determined from the multi-objective genetic algorithm is used in the simulated neural network model. It is observed that the functional values are close to each other with an error of 0.7%. These optimal combinations of machining parameters which is shown in table, with respect to the reference response parameters, satisfy the real requirement milling operations for the proper ma-chining of Al-6061 alloy.
Conclusions
This work proposed a multi-objective solution of the cutting process parameters for the minimization of amp-litude of vibration levels and surface roughness. Experi-ments were planned using the response surface methodology with the Box-Behnken design in three levels for the machining of Al 6061 alloy. Based on the above numerical simulations and experimental studies the following conclusions were made:
It is evident that the spindle speed and axial depth of cut are having significant influence on the
Fig. 11Pareto optimal plot for the response parameters
8 1800.819 41.813 0.706 0.242 2.757
9 1801.005 41.818 0.790 0.249 2.631
10 1801.089 41.808 0.754 0.245 2.687
11 1800.974 41.628 0.750 0.246 2.691
12 1801.107 41.782 0.773 0.247 2.657
13 1801.036 41.711 0.785 0.249 2.638
14 1800.735 41.553 0.664 0.241 2.817
15 1800.950 41.629 0.719 0.243 2.739
16 1800.980 41.578 0.739 0.244 2.708
17 1800.962 41.792 0.744 0.245 2.702
amplitude of vibrations as compared to the surface roughness. However, the interaction effects signify, that low feed rate with high spindle speed minimizes the surface roughness as well as the amplitude tool vibration levels.
The mathematical model developed in the work gives the good co-relation between the process parameters and the responses. In addition, the Pareto based multi-objective genetic algorithms model can obtain good quality solutions in short time and are suitable for the multi-objective environment due to its population based nature. The confirmatory tests are conducted by using both
the experiment and trained radial basis neural network model gives an additional validation for the correctness of the process parameter for multi-objective response.
With the use of the GA based multi-objective optimization developed in this work, it would be possible to obtain the conditions for good surface finish with a lesser amplitude of vibrations.
Acknowledgements
There are no acknowledgements for this work.
Funding
Not applicable for the current project.
Authors’contributions
All authors contributed widely to the work presented in this paper. All the numerical simulations and experimental works are carried out in National institute of Technology Rourkela. The paper has been carefully written to avoid the mistakes at all stages of the manuscript. Finally, the manuscript has been formulated according to journal guidelines and authors approve final manuscript.
Competing interest
The authors declare that they have no competing interests.
Received: 3 September 2016 Accepted: 17 February 2017
References
Arokiadass R, Palaniradja K, Alagumoorthi N (2012) Prediction and optimization of end milling process parameters of cast aluminium based MMC. Trans Nonferrous Met Soc China 22:1568–1574
Briceno JF, Mounayri H, Mukhopadhayay S (2002) Selecting an artificial neural network for efficient modelling and accurate simulation of the milling process. Int J Mach Tool Manu 42:663–674
Brito TG, Paiva AP, Ferreira JR, Gomes JHF, Balestrassi PP (2014) A normal boundary intersection approach to multi response robust optimization of the surface roughness in end milling process with combined arrays. Precis Eng 38:628–638
Das B, Roy S, Rai RN, Saha SC (2016) Application of grey fuzzy logic for the optimization of CNC milling parameters for Al–4.5%Cu–TiC MMCs with multi-performance characteristics. Engineering Science and Technology, an International Journal 19:857–865
Dikshit MK, Puri AB, Maity A (2014a) Experimental study of cutting forces in ball-end milling of Al2014-T6 using response surface methodology. Procedia Materials Science 6:612–622
Dikshit MK, Puri AB, Maity A, Banerjee AJ (2014b) Analysis of cutting forces and optimization of cutting parameters in high-speed ball-end milling using response surface methodology and genetic algorithm. Procedia Materials Science 5:1623–1632
Hocheng H, Yen YB, Ishihara T, Yen BK (1997) Fundamental turning characteristics of a tribology-favored graphite/aluminum alloy. Composite material [J]. Compos Part A 28:883–890
Karkalos NE, Galanis NI, Markopoulos AP (2016) Surface roughness prediction for the milling of Ti–6Al–4 V ELI alloy with the use of statistical and soft computing techniques. Measurement 90:25–35
Khorasani AM, Gibson I, Goldberg M, Doeven EH, Littlefair G (2016) Investigation on the effect of cutting fluid pressure on surface quality measurement in high speed thread milling of brass alloy (C3600) and aluminium alloy (5083). Measurement 82:55–63
Mounayri H, Kishawy H, Bricenoa J (2005) Optimization of CNC ball end milling: a neural network -based model. J Mater Process Technol 166:50–62 Mounayri H, Briceno JF, Gadallah M (2010) A new artificial neural network
approach to modelling ball-end milling. Int J Adv Manuf Technol 47:527–534
Numan Durakbasa M, Anil A, Ali SV, Asli GB (2015) Optimization of end milling parameters and determination of the effects of edge profile for high surface quality of AISI H13 steel by using precise and fast measurements. Measurement 68:92–99
Palanisamy P, Kalidass S (2014) Prediction of surface roughness for AISI 304 steel with solid carbide tools in end milling process using regression and ANN models. Arab J Sci Eng 39:8065–8075
Palanisamy P, Rajendran I, Shanmugasundaram S (2007) Optimization of machining parameters using genetic algorithm and experimental validation for end-milling operations. Int J Adv Manuf Technol 32:644–655
Rajesh Mathivanan N, Mahesh BS, Anup Shetty H (2016) An experimental investigation on the process parameters influencing machining forces during milling of carbon and glass fiber laminates. Measurement 91:39–45 Ratnam C, Arun Vikram K, Ben BS, Murthy BSN (2016) Process monitoring and
effects of process parameters on responses in turn-milling operations based on SN ratio and ANOVA. Measurement 94:221–232
Ren J, Zhou J, Zeng J (2016) Analysis and optimization of cutter geometric parameters for surface integrity in milling titanium alloy using a modified grey-Taguchi method. Proc Inst Mech Eng B J Eng Manuf 230:2114–2128 Saffar RJ, Razfar MR (2010) Simulation of end milling operation for predicting cutting forces to minimize tool deflection by Genetic Algorithm. Machining Science and Technology: An International Journal 14:81–101
Sukumar MS, Venkata Ramaiah P, Nagarjuna A (2014) Optimization and prediction of parameters in face milling of Al-6061 using Taguchi and ANN approach. Procedia Engineering 97:365–371
Surinder K, Meenu G, Satsangi PS (2015) Multiple-response optimization of cutting forces in turning of UD-GFRP composite using Distance-Based Pareto Genetic Algorithm approach. Engineering Science and Technology, an International Journal 18:680–695
Venkata Rao R, Pawar PJ (2010) Parameter optimization of a multi-pass milling process using non-traditional optimization algorithms. Appl Soft Comput 10: 445–456
Wang ZG, Rahman M, Wong YS, Sun J (2005) Optimization of multi-pass milling using parallel genetic algorithm and parallel genetic simulated annealing. Int J Mach Tool Manu 45:1726–1734
Table 5Confirmation table of optimal process parameter
S1 No Optimal input set Outputs
f in mm/ min
N in rpm
b in mm
Amplitude of vibration (A) in mv Surface roughness (Ra) inμm
GA Value RBF Value Experiment % error GA Value RBF Value Experiment % error
Submit your manuscript to a
journal and benefi t from:
7 Convenient online submission 7 Rigorous peer review
7 Immediate publication on acceptance 7 Open access: articles freely available online 7 High visibility within the fi eld
7 Retaining the copyright to your article