R E S E A R C H
Open Access
Depth estimation of surface-opening crack
in concrete beams using impact-echo and
non-contact video-based methods
Yamin Sun
*, Pingming Huang, Jufeng Su and Tao Wang
Abstract
Surface-opening crack is one of the main defects in concrete bridges, which results in degradation in the load-carrying capacity of these structures. Thus, estimating the depth of such surface-opening crack is vital. This study presents impact-echo (IE) and non-contact video-based methods to estimate the surface-opening crack of concrete beams in the laboratory, and the results are compared with visual inspection. Results show that the IE method estimates a considerably larger crack depth than the non-contact video-based method and visual inspection. Although the difference between the depth measured by non-contact video-based method and visual inspection is small, the depth estimated by non-contact video-based method is slightly larger than that measured by visual inspection because it can identify the unrecognizable micro-crack by visual inspection. Moreover, when adopting the IE method, the depth of inclined crack is more overestimated than the vertical crack.
Keywords:Surface-opening crack, Crack depth, Impact-echo method, Non-contact video-based method, Vertical crack, Inclined crack
1 Introduction
Bridge engineering has considerably developed in the past few decades. However, most of the bridges constructed decades ago have experienced different levels of degrad-ation after being subjected to long-term environment at-tacks and load effects. The USA spend approximately $10 billion annually on the repair and maintenance of their existing bridges [1]. Surface-opening crack is one of the most common defects for concrete bridges; it reduces stiffness and allows aggressive media, such as water and chloride, to corrode the reinforced bars, thereby causing the loss in load-carrying capacity. Therefore, measuring the depth of surface-opening crack to realize appropriate maintenance schedule is of considerable importance.
Nondestructive and destructive methods are com-monly adopted in assessing the service condition of bridges; between the two, destructive methods are often of low efficiency and poor economic effect because they may core, drill, or include load test on the bridge
struc-ture [2]. Nondestructive test methods offer bridge
managers and engineers fast and efficient approaches for bridge inspection and assessment. These methods include audio-visual methods, stress wave methods,
elec-tromagnetic methods, and miscellaneous tests [3]. For
surface-opening cracks, audio-visual methods are the most extensively adopted because they are rapid and inexpensive in inspecting structures. However, such methods cannot measure the depth of surface-opening cracks because they are used to identify the apparent and superficial problems while the depth of the surface-opening crack may be larger than the superficial profile of the crack. A stress wave method called impact-echo (IE) method has been proposed and fre-quently adopted by researchers to identify the defects in concrete structures. The IE method was first used to detect concrete flaws [4] and later widely applied to in-terpret the severity of delamination in bridge deck [5] and detect large voids [6] and corrosion damage [7]. How-ever, research regarding the depth of surface-opening crack is limited. Only few scholars have conducted experiments on concrete beams and slabs to apply this method for determin-ing the depth of surface-opendetermin-ing crack [8–12].
* Correspondence:[email protected]
School of Highway, Chang’an University, Xi’an, Shaanxi 710064, People’s Republic of China
technology offers a way for researchers and engineers to access structure information considering multiple sections in a remote distance but with high resolution. Moreover, this method does not need to access the crit-ical areas of structures when these areas are untouch-able. In view of this, several researchers [13–17] have applied non-contact video-based measurement to field tests and verified the accuracy of this method by comparison with other conventional measurements.
However, in the current literature, the use of
non-contact video-based methods mainly focuses on the structure displacement, thereby ignoring the strain of the structure.
In this study, several concrete beams are loaded in the laboratory to generate surface-opening cracks. During the loading procedure, the non-contact video-based method combined with visual inspection is adopted to monitor the occurrence of crack. The crack tip is identified when the strain of the concrete exceeds the cracking strain. The crack depth is then estimated by measuring the distance between the tip and the surface of the crack. Meanwhile, the IE method is utilized to estimate the depth of such
cracks using the time-of-flight (TOF) technique.
Finally, the different methods are compared.
2 Method
When the IE method is applied, a transient mechanical impact is generated by a hammer or a ball impactor on the beam surface. This mechanical impact will introduce stress waves, which include dilatational (P-) wave, distor-tional (S-) wave, and Rayleigh (R-) wave. The IE method
rival time of the P-wave, can be used to estimate the crack depth.
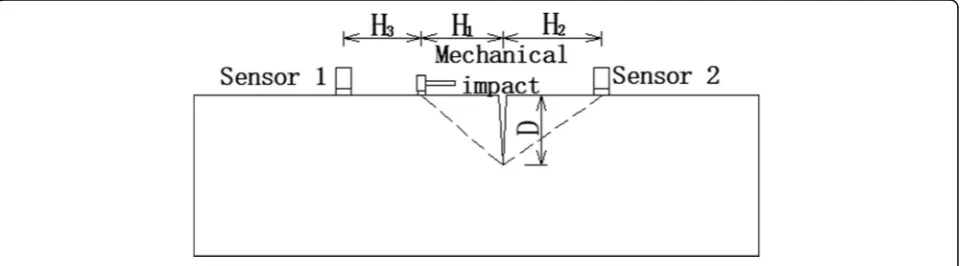
Figure 1 shows a schematic of the testing
configur-ation for the estimconfigur-ation of the crack depth. Figure 2
presents the recorded waveforms demonstrating
P-wave arrivals. If a surface-opening crack exists, then the shortest travel path of P-wave generated by the mechanical impact starts from the impact point to the crack tip and then arrives at the sensor 2, which
is illustrated by the dashed line in Fig. 1. The depth
of the surface-opening crack D can then be calculated
according to [9] as follows:
D¼
ffiffiffiffiffiffiffiffiffiffiffiffiffiffiffiffiffiffiffiffiffiffiffiffiffiffiffiffiffiffiffiffiffiffiffiffiffiffiffiffiffiffiffiffiffiffiffiffiffiffiffiffiffiffiffiffiffiffiffiffiffiffiffiffiffi
CPΔt
ð Þ2þH
12−H22
2CpΔt
" #2
−H12
v u u
t ; ð1Þ
where H1is the distance between the impact point and the crack, H2 represents the distance between the sec-ond sensor and the crack, H3 denotes the distance be-tween the impact point and the first sensor, CP is the travel velocity of the P-wave, and Δt denotes the travel time for the P-wave from the start of the impact to the arrival of the P-wave at sensor 2.
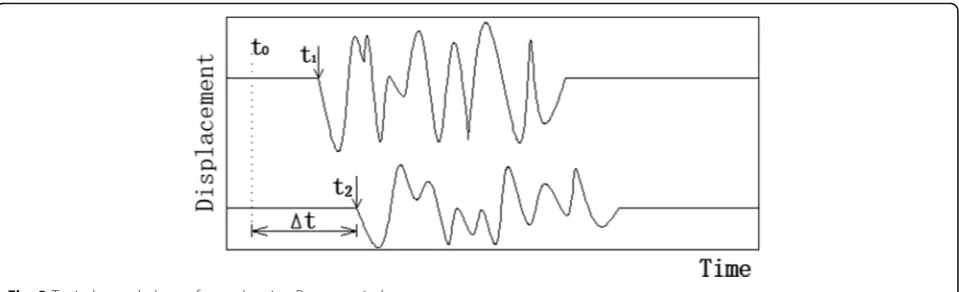
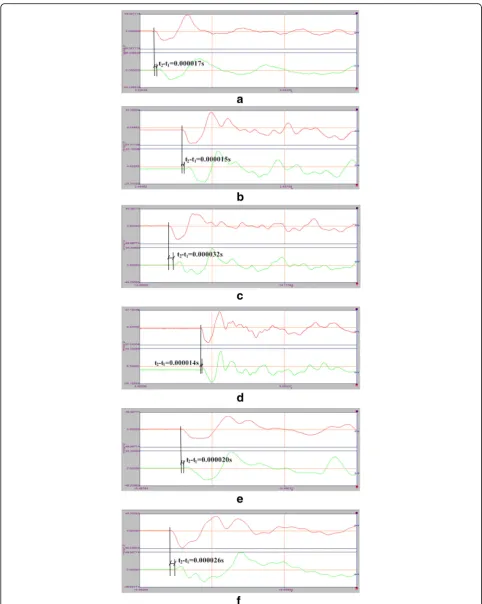
Figure 2 shows that the time for data acquisition is
earlier than the occurrence time of the mechanical im-pactt0; meanwhile, t0cannot be read from the data
ac-quisition system. However, Δt can be calculated by the
difference between the arrival times from the impact point to the first and second sensors. In Fig.2, the upper part shows the waveform recorded by the sensor 1, whereas the lower part is the waveform recorded by the sensor 2. t1and t2 represent the time from the start of
data acquisition to the arrival of the P-wave at the first and second sensors, respectively. Consequently, the fol-lowing relationships are obtained:
t1−t0¼H3=CP: ð2Þ
Hence, Δt=t2−t0can be further expressed as Eq. (3) in combination with Eq. (2), as shown as follows:
Δt ¼t2−t1þH3=CP: ð3Þ
Figure 3 shows that two sensors can be placed at the
top of an intact concrete beam with a certain distanceL to determine the travel velocity of the P-wave. A mech-anical impact is then exerted on the surface of the con-crete beam. The travel velocity of P-wave can be determined as follows:
CP¼L= t02−t
0
1
; ð4Þ
wheret01 andt02represent the time from the data acquisi-tion to the arrival of P-wave at the first and second sen-sors placed at the top of the intact concrete beam, respectively. Thus, the depth of the surface-opening crack can be estimated in combination with Eqs. (1), (3), and (4).
2.1 Non-contact video-based method
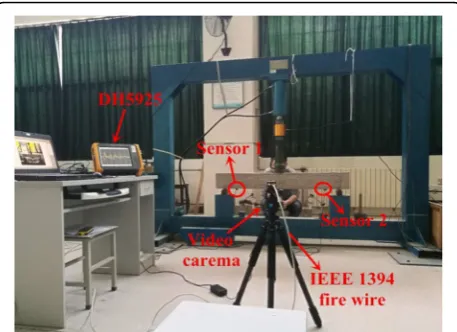
The non-contact video-based measurement system mainly comprises the following three components: a high-speed video camera with proper lens, the right tar-get attached or labeled on the measured object, and a data acquisition and processing system. These compo-nents are shown in Fig.4.
Cameras with various frame rates and resolutions are available. High-resolution cameras tend to have excellent resolution when tracking targets but may have low frame rates because they transfer a large amount of data per frame. Moreover, the choice of lens affects the size of the area viewed in the image. The size of this area is known as the field-of-view of the camera. Fitting differ-ent lens to the camera enables the measuremdiffer-ent system to operate on objects from only a few millimeters in size up to several hundred meters.
The targets help the measurement system to track the object response. Five types of target pattern, namely speckles, blobs, dashes, concentric rings, and natural fea-tures of the object, are used to track the object response. Speckled patterns are ideal for precise measurement of displacement and strain and are produced by spraying with a light dusting of white spray paint followed by a light dusting of black paint. Blobs and dashes are suit-able in cases where the strain and displacement are large. They do not usually need to be drawn precisely in
Fig. 2Typical recorded waveforms showing P-wave arrivals
a regular shape and can be drawn freehand. Concentric rings are ideal for measuring displacement on compo-nents and structures because they are circularly symmet-ric and will work well even with large amounts of rotation. An easy way to produce these targets is to gen-erate them in a graphics program and then print them out onto sticky labels. Many objects have natural fea-tures or patterns that make them suitable as targets without the need for additional markings. Some mate-rials have a natural texture (such as concrete or brick), whereas some components might have bolt or rivet heads that can be used as targets.
The measurement principle of the non-contact
video-based measurement system can be illustrated as fol-lows. After the targets are drawn onto the object surface, the pixels in the measured area on the object surface cap-tured by the camera can be obtained and calculated by the data acquisition system. Once the object is applied to the external load, the object will be deformed, resulting in the change in the number of pixels in the measured area. If the difference in the number of pixels between different times in a certain direction is obtained, then the object displacement in this direction can be acquired by conver-sion through the data processing system. Meanwhile, if the change in the number of pixels between two different targets is obtained, then the deformation, rotation, or the strain value between the two targets can also be derived.
3 Experiment
3.1 Specimen
Two groups of specimens, which included six reinforced concrete beams, were casted and cured to conduct the experiment. Each group contained three concrete beams. These concrete beams, with length of 140 cm, width of 9 cm, and depth of 16 cm, were reinforced with two identical reinforcing bars placed 2 cm above the bottom of the beams. Two identical spacer bars were also de-signed and placed 2 cm from the top surface of the beams. However, the spacer bars were disconnected in the middle zone of the beam with a length of 40 cm. Stirrups were also designed with a spacing of 5 cm. The diameters of the reinforcing bars in the first and second groups are 12 mm and 16 mm, respectively, whereas the diameters of the spacer bar and stirrup were all 6 mm. The reinforcing bars were designed with grade HRB335 with yield strength of 300 MPa according to Chinese
GB50010-2010 [18]. Meanwhile, the grade of the spacer
bar and stirrups were HPB235 with yield strength of 210 MPa. The concrete mix followed the mixing propor-tion of cement:water:aggregate:sand = 1:0.47:3.39:1.59, resulting in the C25 concrete mix that exhibited com-pressive and tensile strength of 11.9 MPa and 1.27 MPa, respectively. The Young’s modulus of the reinforcing bar and the concrete mix were 200 GPa and 28.0 GPa, re-spectively. The dimensions of the concrete beam are
Fig. 4Components of the non-contact video-based measurement system
shown in Fig. 5. The specimens were labeled with the diameter of the reinforcing bar and the beam number (e.g., 12-1# represents the first beam in which the diam-eter of the reinforcing bar is 12 mm.).
As dashed targets are convenient to drawn freehand and any shape of the target can be identified by the camera, dash-type targets were used for the camera to capture the response of the concrete beam in this study. The dashes were hand-drawn with ticks using a black marker with a random distance between two nearby marks. A beam drawn with dashed targets is shown in Fig. 6.
3.2 Loading
The concrete beam specimens were loaded under a single-point loading to generate vertical surface-opening cracks, as shown in Fig. 5. From the figure, the tensile force initiated at the bottom of the beam; thus, the crack first occurred at the bottom of the beam and then devel-oped toward the upper region. The load was applied at 100 N/s and stopped when a visible crack occurred at the bottom of the beam. Under this single-point loading, several evenly distributed cracks may occur on the beam surface. However, only the most evident crack was se-lected to measure its depth using IE and non-contact
video-based method in the experiment. Table 1 shows
that the theoretical ultimate load when 12-1#, 12-2#, and 12-3# beams completely failed was 13.88 kN. For 16-1#, 16-2#, and 16-3# beams, the theoretical ultimate load was 16.68 kN. In this experiment, the applied load
when the visible crack occurred for each beam was ap-proximately 30–40% of their theoretical ultimate load. Besides, the applied load for each beam deviates each other much. This is because the applied load stops when a visible crack occurs. At this moment, several cracks may exist and the degree of cracking of each beam is un-controlled. So the applied load of each beam has nothing to do with when the most visible crack occurs.
3.3 Measurement apparatus
The overview of the laboratory loading and
measure-ment test is shown in Fig. 7. For the IE method, two
capacitive sensors with a frequency range of 0–1000 Hz were adopted to raise the P-wave in the concrete beam. The sensors were attached on the top surface of the beam to determine the travel velocity of the P-wave in the concrete beam conveniently. However, the sensors were glued at the bottom surface of the concrete as the crack initiated at the bottom surface of the concrete. The dynamic signal testing and analysis system DH5925 was adopted to acquire and handle the vibration signals obtained by the sensors. This DH5925 system had eight channels to enable simultaneous acquisition and hand-ling of eight vibration signals. An industrial camera with 5 million pixels, which can capture 120 frames per sec-ond, was adopted for the non-contact video-based
Fig. 6Beam drawn with dash type targets
Fig. 7Overview of the laboratory loading and measurement test
Table 1Theoretical ultimate load and applied load when
visible crack occurs for each specimen
Specimen Pultimate(kN) Papplied(kN) (Papplied/Pultimate)%
12-1# 13.88 5.24 37.75
12-2# 4.35 31.34
12-3# 4.82 34.73
16-1# 16.68 6.10 36.57
16-2# 5.47 32.79
method. The camera was placed right in front of the test beam with a proper distance to obtain a clear and full view of the beam. IEEE 1394 fire wire connected the camera and the laptop to satisfy a transmission speed of 400 Mbps. The specified software was installed on the laptop to help save the image files obtained from the camera for post-processing. To avoid the influence of light source on the test result, natural light without any other source of light was adopted in this study.
3.4 Travel velocity of P-wave
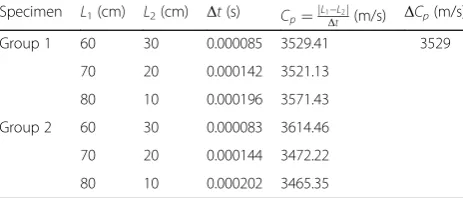
Two beams with different through bars were tested to determine the travel velocity of P-wave in the concrete beams. The two sensors were attached on the top sur-face of the beam with a fixed distance of 90 cm. By changing the impact position, the transmission distances from the impact position to the two sensors were corres-pondingly different, thereby causing varying arrival times of the P-wave at each sensor. Then, the TOF technique can be used to calculate the travel velocity of the P-wave. The difference of the distance between the im-pact position to the two sensors was designed as 30, 50, and 70 cm in this test. In this experiment, the test con-figuration for the travel velocity of the P-wave is shown in Fig.8, and the test results are summarized in Table2. The results showed that for concrete beams in groups 1
and 2, the travel velocity of the P-wave demonstrated a slight difference and fluctuated around 3500 m/s. This finding indicated that the reinforcement ratio nearly had no influence on the travel velocity of the P-wave in the concrete beams. To this end, the average travel velocity of the P-wave in the two different groups of concrete
beams, that is, ΔCp= 3529 m/s, was adopted to
repre-sent the travel velocity of the P-wave in the concrete beams in this experiment.
4 Test results and discussions
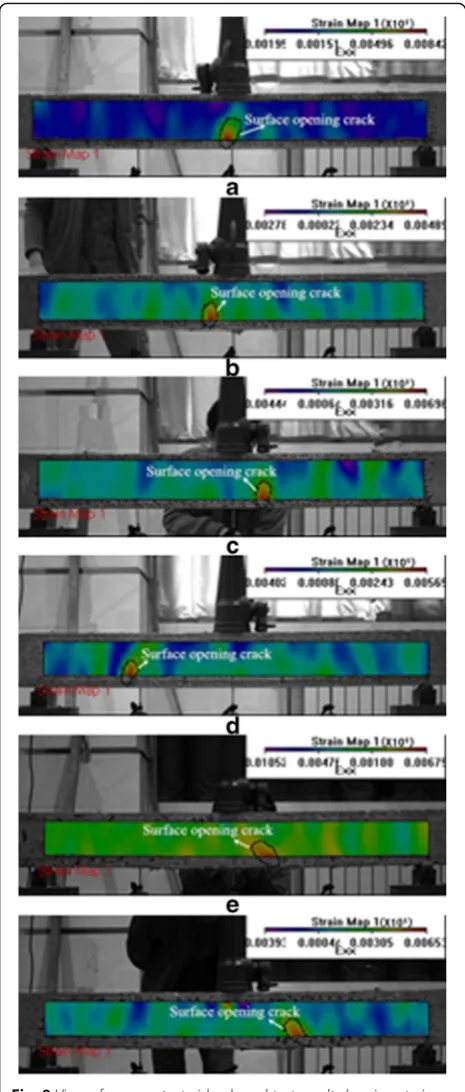
Given that the tensile strength and Young’s modulus of the concrete were 1.27 MPa and 28.0 GPa, respectively, the cracking strain of the concrete was easily calculated as 0.4536 × 10⁻⁴The spans and the cross sections of the beams in this study were all small. The maximum tensile strain under self-weight was 0.66 × 10⁻⁵, which was small compared with the crack strain of the concrete. So the initial strain caused by self-weight of the beam was ig-nored when adopting non-contact video-based method. Based on this, if the strain of the concrete exceeded the cracking strain of 0.4536 × 10⁻⁴, then a tensile crack would occur correspondingly. Through the non-contact video-based method, the strain map of the concrete would be drawn with different colors by the camera and the software. The strain of each point of the concrete beam could be obtained in the post-process. Thus, the tip and depth of the crack could be determined using the post-process software. For the 12-1# beam, the most evident crack was located 3 cm left to the mid-span of the beam, and the crack depth measured by the
non-contact video-based method was 6.04 cm (Fig. 9a).
In the IE method, the distance values of H1, H2, andH3 were set as 0.05, 0.05, and 0.10 m, respectively, to meas-ure the crack depth for the 12-1# beam. The recorded waveforms showing the P-wave arrivals at each sensor are shown in Fig.10a. The difference between the arrival times of the two sensors was 0.000017 s. By adopting
Fig. 8Test configuration for the travel velocity of P-wave
Table 2Theoretical ultimate load and applied load when
visible crack occurs for each specimen
Specimen L1(cm) L2(cm) Δt(s) Cp¼jL1−L2j
Δt (m/s) ΔCp(m/s)
Group 1 60 30 0.000085 3529.41 3529
70 20 0.000142 3521.13
80 10 0.000196 3571.43
Group 2 60 30 0.000083 3614.46
70 20 0.000144 3472.22
Eqs. (1) and (3), the crack depth determined by the IE method was calculated as 6.24 cm. The most evident crack for the 12-2# beam emerged at 6.4 cm left to the mid-span of the beam (Fig.9b). The crack depth was es-timated as 5.23 cm by the non-contact video-based
method. By adopting the IE method, the distance values ofH1, H2, andH3were set as 0.05, 0.08, and 0.12 m, re-spectively, to measure the crack depth for the 12-2# beam. The difference between the arrival times of the
two sensors was 0.000015 s (Fig. 10b). Then, the crack
depth for the 12-2# beam was estimated as 5.61 cm ac-cording to Eqs. (1) and (3). For the 12-3# beam, the most evident crack appeared at 13.7 cm right to the
mid-span of the beam (Fig. 9c). The estimated crack
depth by the non-contact video-based was obtained from the post-process software as 6.58 cm. By placing the two sensors and the impact position with the dis-tance values ofH1,H2, andH3as 0.10, 0.12, and 0.15 m, respectively, the time P-wave traveled to sensor 2 was 0.000032 s later than its travel to sensor 1 (Fig. 10c). The crack depth for the 12-3# beam was calculated as 7.18 cm using the IE method. The most evident crack for the 16-1# beam emerged at 36.2 cm left to the
mid-span of the beam (Fig. 9d). By adopting the
non-contact video-based method, the crack depth was estimated as 5.92 cm. By adopting the IE method, the difference between the arrival times of the two sensors of the P-wave was 0.000014 s when the distance values ofH1, H2, andH3were set as 0.10, 0.05, and 0.15 m, re-spectively. The crack depth was then calculated as 6.22 cm according to Eqs. (1) and (3).
Figure 9 clearly shows that the cracks on 12-1#,
12-2#, 12-3#, and 16-1# beams were all vertical cracks. However, cracks that appeared on 16-2# and 16-3# beams were inclined cracks. The crack surface for the 16-2# beam was located 10.5 cm right to the
mid-span of the beam (Fig. 9e). Nonetheless, the
crack surface for the 16-3# beam emerged at 27.8 cm
right to the mid-span of the beam (Fig. 9f ). To test
the depth of the inclined cracks by non-contact video-based method, the crack tip was also identified by preventing the strain of the concrete from
exceed-ing the crackexceed-ing strain of 0.4536 × 10⁻⁴. Then, the
depth of the inclined crack was the perpendicular dis-tance between the crack tip and surface. According to the non-contact video-based method, the depths of most evident cracks for 16-2# and 16-3# beams were 6.71 cm and 6.24 cm, respectively. When measuring the crack depth for the 16-2# beam using the IE
method, the distance values of H1, H2, and H3 were
set as 0.05, 0.10, and 0.15 m, respectively. The differ-ence in the arrival time for the P-wave to the two
sensors was 0.000020 s (Fig. 10e), and the crack
depth was calculated as 7.88 cm according to Eqs. (1)
and (3). Similarly, the distance values of H1, H2, and
H3 for the 16-3# beam were designed as 0.10, 0.05,
and 0.12 mm, respectively, and the difference in the arrival time for the P-wave to the two sensors was 0.000026 s (Fig. 10f ). By adopting Eqs. (1) and (3),
the crack depth for the 16-3# beam was estimated as 7.26 cm using the IE method.
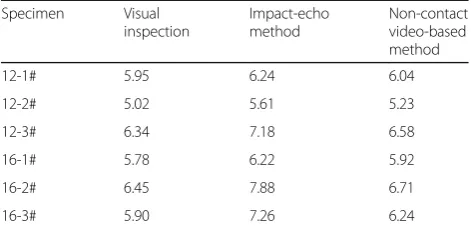
4.1 Comparison among different methods
The depth of each crack was also measured by visual in-spection using a ruler, which read the scale from the tip to the top surface of the crack. Table3summarizes the crack depth of each specimen measured by the following three methods, namely IE method, non-contact video-based method, and visual inspection.
Table3shows that the IE method estimated the largest crack depth, followed by the non-contact video-based method. The crack depth was measured slightly smaller by visual inspection than that by the non-contact video-based method. Two reasons may explain why the IE method provided a larger crack depth estimation than those of the two other methods. First, the crack depth was not uniform in the cross-sectional area, wherein the crack depth was large inside the cross-section and small at the side surface of the cross-section. When adopting the IE method, the crack depth represented the depth inside the cross-section of the crack because the P-wave is a type of body wave rather than surface wave. Second, the concrete mixture was an unrealistic homogeneous material. Once defects existed, such as micro-crack or delamination near the crack tip, the travel distance of the P-wave increased, resulting in an overestimated crack depth. Moreover, the visual inspection measured a smaller crack depth than the non-contact video-based method. This finding could be attributed to inconspicu-ous micro-crack near the crack tip, which was difficult
to observe by visual inspection. However, the
micro-crack could be identified by the non-contact video-based method using the post-process software. Thus, the crack depth may be underestimated by the vis-ual inspection.
On the basis of the preceding description, the measured cracks for specimens 16-2# and 16-3# were inclined cracks, whereas those for other specimens were vertical
cracks. Table3shows that when adopting the IE method,
specimens 16-1# and 16-2# showed a larger deviation
from the two other methods than the other specimens. This finding revealed that the IE method overestimated more the depth of the inclined crack than the vertical crack. This result could be attributed by the important angle between the crack and sensor 2 when measuring the depth of the inclined crack. A large angle implies a larger crack depth estimation [19].
For inclined cracks on 16-2# and 16-3# beams, the IE method can directly estimate the depth of the crack. When it comes to the length of inclined crack, the in-clined angle of the crackθ is needed and the length can
be calculated as D/ sinθ indirectly. Besides, when a
beam has already worked with a crack, the depth of the crack cannot be estimated using the non-contact video-based method. However, the change in the strain of the crack can be obtained by non-contact video-based method. Thus, change in the stiffness of the beam and the change in the depth of the crack can be estimated by the non-contact video-based method.
5 Conclusions
This study presents two methods, namely IE method and non-contact video-based method, for estimating the depth of surface-opening crack in concrete beams. Depths of vertical and inclined cracks are investigated. The estimated depth by the two methods is compared with visual inspection. The key conclusions drawn from this study on the surface-opening cracks are as follows.
1. The IE method estimates a considerably larger depth than the non-contact video-based method and visual inspection mainly because the crack depth is not uniform in the cross-sectional area and the depth inside the cross-section is larger than that at the side surface.
2. The non-contact video-based method estimates a slightly larger depth than that of the visual inspec-tion. However, the difference in the crack depth es-timated by the two methods is small because the non-contact video-based method can identify the unrecognizable micro-crack by visual inspection. However, the post-process of the non-contact video-based method requires expertise to identify the crack tip accurately.
3. When adopting the IE method, the depth of inclined crack is more overestimated than the vertical crack. This finding is strongly associated with the angle between the crack and sensor 2. 4. The trajectory of the inclined crack in this study
can be determined by the non-contact video-based method using the strain map. However, the IE method cannot achieve this goal, thus requiring fur-ther research.
Table 3Comparison of depth measurements among different
methods (unit: cm)
Specimen Visual inspection Impact-echo method Non-contact video-based method
12-1# 5.95 6.24 6.04
12-2# 5.02 5.61 5.23
12-3# 6.34 7.18 6.58
16-1# 5.78 6.22 5.92
16-2# 6.45 7.88 6.71
Availability of data and materials Please contact the authors for data requests.
Authors’contributions
Sun did the experiments and finished the manuscript. All authors take part in the discussion of the work described in this paper. All authors read and approved the final manuscript.
Competing interests
The authors declare that they have no competing interests.
Publisher’s Note
Springer Nature remains neutral with regard to jurisdictional claims in published maps and institutional affiliations.
Received: 17 September 2018 Accepted: 23 November 2018
References
1. H.B. Xie, W.J. Wu, Y.F. Wang, Life-time reliability based optimization of bridge maintenance strategy considering LCA and LCC. J. Clean. Prod.176, 36–45 (2018)
2. M. Seher, C.-W. In, J.-Y. Kim, et al., Numerical and experimental study of crack depth measurement in concrete using diffuse ultrasound. J. Nondestruct. Eval.32, 81–92 (2013)
3. S.K.U. Rehman, Z. Ibrahim, S.A. Memon, et al., Nondestructive test methods for concrete bridges: a review. Constr. Build. Mater.107, 58–86 (2016) 4. N.J. Carino, M. Sansalone, Flaw detection in concrete using the impact-echo
method. Ndt. & E. Int.30(1), 263 (1997)
5. S.K. Verma, S.S. Bhadauria, S. Akhtar, Review of nondestructive testing methods for condition monitoring of concrete structures. J. Constr. Eng.
2013, 1–11 (2013)
6. C.U. Grosse, H.W. Reinhardt, R. Beutel, Application of impact-echo techniques for crack detection and crack parameter estimation in concrete. Biochim. Biophys. Acta47, 417–422 (2005)
7. M.T. Liang, P.J. Su, Detection of the corrosion damage of rebar in concrete using impact-echo method. Cement. Concrete. Res.31, 1427–1436 (2001) 8. N. Dawood, H. Marzouk, A. Hussein, et al., Nondestructive assessment of a Jetty bridge structure using impact-Echo and Shear-wave techniques. J. Bridg. Eng.18, 801–809 (2013)
9. Y.C. Lin, W.C. Su, Use of stress waves for determining the depth of surface-opening cracks in concrete structures. J. Mater.93, 494–501 (1996) 10. M.J. Sansalone, J.M. Lin, W.B. Streett, Determining the depth of
surface-opening cracks using impact-generated stress waves and time-of-flight techniques. ACI Mater. J.95, 168–177 (1998)
11. K. Arne, C.-W. In, J.-Y. Kim, et al., Nondestructive estimation of depth of surface opening cracks in concrete beams. AIP. Conf. Proc.1581, 793–798 (2014)
12. E Çam, S Orhan, M Lüy. An analysis of cracked beam structure using impact echo method. Ndt & E International.38(5), 368-373 (2005)
13. D. Ribeiro, R. Calçada, J. Ferreira, et al., Non-contact measurement of the dynamic displacement of railway bridges using an advanced video-based system. Eng. Struct.75, 164–180 (2014)
14. J.J. Lee, M. Shinozuka, A vision-based system for remote sensing of bridge displacement. Ndt. &. E. Int.39, 425–431 (2006)
15. A.M. Wahbeh, J.P. Caffrey, S.F. Masri, Direct measurement of displacements in vibrating structures through vision-based approaches. Emir. J. Eng. Res.9, 105–110 (2004)