Suchith et al. World Journal of Engineering Research and Technology
THEORETICAL ANALYSIS OF INFLUENCE OF ATTACK ANGLE
ON COEFFICIENT OF DRAG OF A RE-ENTRY VEHICLE USING CFD
TOOLS
Pradev. D.1, Suchith. K. S.2* and Kushal Kumar G.3
1
M.Tech Final Year Student, CBIT, Kolar.
2
Asst. Professor, Department of Mechanical Engineering, MVJCE, Bangalore.
3
Asst.Professor, Department of Mechanical Engineering, CBIT, Kolar.
Article Received on 11/07/2016 Article Revised on 01/08/2016 Article Accepted on 22/08/2016
ABSTRACT
Here, Flow simulations are carried on design configurations of Fire II
re-entry capsule using CFD. Here, the purpose is to determine the
co-efficient of drag of a blunt shaped re-entry capsule. Here the
importance of the angle of attack and its effect on the motion of
re-entry capsules, especially at supersonic and hypersonic speeds is
studied, even a slight change in angle of attack can severely alter the activity of the re-entry
capsule. Here we are finding co-efficient of drag of re-entry capsule for different angle of
attack and hence also discussed about temperature and pressure variations around the re-entry
capsule.
KEYWORDS: Re-entry capsule, CFD, Co-efficient of drag, Angle of attack.
1. INTRODUCTION
Here, the re-entry vehicle chosen is re-entry capsules, Re-entry capsules require a sphere
shape fore body that will give higher aerodynamic drag and its body length is made shorter,
for reducing its weight and ballistic co-efficient. Here Apollo shaped re-entry capsules are
preferred rather than the using space shuttles because Apollo shaped blunt body capsules
creates more drag than other re-entry vehicles. Hence, we explore the analysis on re-entry
capsules.
World Journal of Engineering Research and Technology
WJERT
www.wjert.org
SJIF Impact Factor: 3.419*Corresponding Author
Suchith. K. S
Asst. Professor,
Department of Mechanical Engineering, MVJCE, Bangalore.
Aim is to determine, theoretically, the co-efficient of drag of FIRE II re-entry capsules at
supersonic and hypersonic speeds. Objective of the project is to perform CFD simulations on
FIRE II re-entry capsules using FLUENT software, and determine co-efficient of drag for
different angle of attack with different altitudes.
2.BLUNT BODY RE-ENTRY CAPSULES
Since there are many re-entry vehicles but blunt body re-entry vehicles are preferred because
it creates more drag than other re-entry vehicles. The heat load experienced by a re-entry
capsule was inversely proportional to co-efficient of drag. If drag is higher, heat load will be
less. In blunt body shaped re-entry capsules, air does not escape easily, and air will act as
cushion to move the shock waves and heated shock layers away from the capsules.
3. RELATED WORK
1. Shiva Prasad U and Srinivas G, carried flow simulations on re-entry bodies using fluent software and they observed the effect of aerodynamic force on motion of re-entry vehicles
and characteristic features of re-entry vehicles is observed.
2. R. Balu and L. Prince Raj, both did analysis on re entry configurations, they compared flight measured values of two missions using CFD which shows good result of heat
flux.
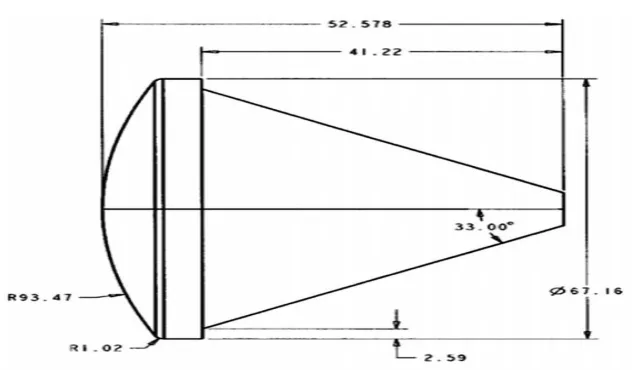
4. STRUCTURE OF FIRE II RE-ENTRY CAPSULE
Fig 1: Structure of FIRE II re-entry capsules.
These are inexpensive than lifting ones and for direct entry they require low ballistic factor.
Low ballistic factor contributes to high coefficient of drag, low mass and large area of
5. MODELING OF FIRE II RE-ENTRY CAPSULE
Modeling of FIRE II re-entry capsule is done using ANSYS design modeler software,
Modeling procedure is as follows.
Sketch for re-entry capsule, sketch for domain, creation of surface for sketching, subtract
surface for re-entry capsule from domain, creation of name selection for pressure far field,
wall facing flow, wall sides, wall after body, surface body, and face split operations are
performed.
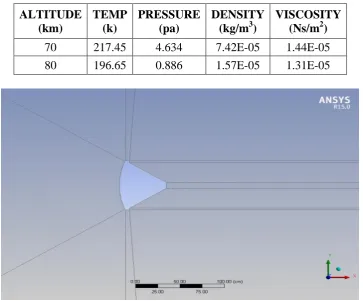
ALTITUDE (km)
TEMP (k)
PRESSURE (pa)
DENSITY (kg/m3)
VISCOSITY (Ns/m2) 70 217.45 4.634 7.42E-05 1.44E-05
80 196.65 0.886 1.57E-05 1.31E-05
Fig 2: Close up view of modeled sketch of FIRE II Re-entry capsule.
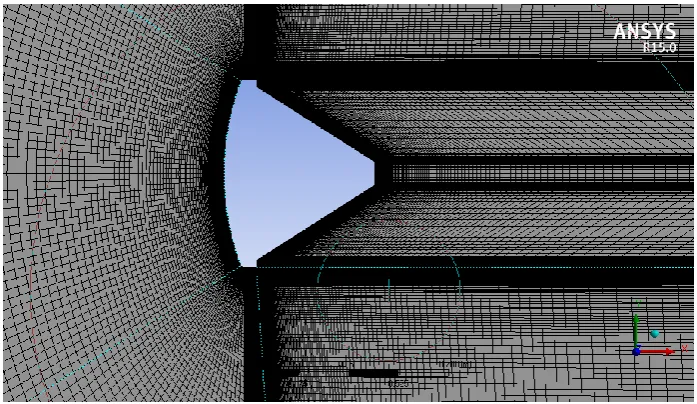
6. MESHING
Meshing of FIRE II re-entry capsule is done using ANSYS meshing, meshing procedure is as
follows.
Mesh show- mappable, Physics preference- CFD, Solver preference –FLUENT, Sizes for all
Fig 3: Meshing of FIRE II re-entry capsule.
7. BOUNDARY CONDITIONS
Following assumptions are carried out they are as follows.
1) Air is clean 2) Air is dry 3) Air is perfect gas mixture 4) Specific heat ratio, Gamma (γ)
=1.4.
Table 1: Standard atmosphere properties.
Calculation of area for FIRE II re-entry capsules Area (A)=π/4×(L)2
, Length(L) = 67.16×10⁻²m
Area (A) =π/4× (67.16×10-2 )2
Area (A) =0.354m2
8. SIMULATIONS FOR MODEL OF FIRE II RE-ENTRY CAPSULES USING FLUENT
Here, simulations are carried out on the model of FIRE II re-entry capsule using FLUENT for
different angle of attacks like 200,450,600 for 70km and 80km altitudes by applying boundary
conditions as stated above.
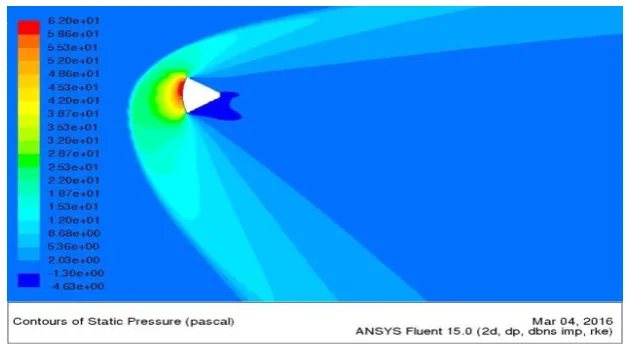
Fig 4: Contours of Mach number for 200 angle of attack and 70km altitude.
The co-efficient of drag for 200 angle of attack and 70km altitude at supersonic speed was
found to be Cd=0.966. Figure of Contours for temperature and pressure for 200 angle of
attack and 70km altitude at supersonic speeds are shown below.
Fig 5: Contours of temperature for 200 angle of attack and 70km altitude.
9. RESULTS AND DISCUSSIONS
The following results were obtained from simulation of the model re-entry vehicle. For a
given altitude, Mach number and Angle of attack, coefficient of drag is obtained as an output.
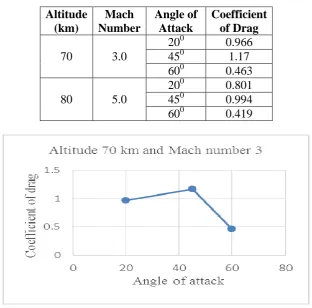
Table 2: Co-efficient of drag for different angle of attack. Altitude
(km)
Mach Number
Angle of Attack
Coefficient of Drag
70 3.0
200 0.966 450 1.17 600 0.463
80 5.0
200 0.801 450 0.994 600 0.419
Graph 1: (a) Coefficient of drag Vs Angle of attack at an Altitude of 70km and Mach number 3.
Graph 2: (b) Coefficient of drag Vs Angle of attack at an Altitude of 80km and Mach number 5.
It can be seen from the graphs 1 and 2 that, for 70 km altitude, 200 angle of attack the
angle of 450, and at 600 attack angle the drag coefficent decreases to nearly half of the value
at 200.For 80 km altitude, 200 angle of attack the coefficient of drag is 0.801. The coefficient
of drag increases to a value of 0.994 for an attack angle of 450, and at 600 attack angle the
drag coefficent decreases to nearly half of the value at 200. As it is known that the greater the
coefficent of drag the lesser the speed of the vehicle; lesser speed results in relatively low
friction with atmospheric air. Hence, an angle of attack that results in greater drag is
desirable. The coefficient of drag at 450 angle of attack is greater than the corresponding
values at 200 and 600. Therefore, results obtained from the simulations show that the drag at
450 is maximum and from analysis it be said that an angle of attack of 450 should be
considered as desirable for the said re-entry vehicle configuration.
10. CONCLUSION
1. A re-entry vehicle should be designed and should be so positioned while re-entering the
Earth’s atmosphere such that the coefficient of drag is maximum for the configuration.
2. Coefficient of drag is maximum at 450 angle of attack for both 70 km altitude and 80 km
altitude, when compared to 200 and 600 angle of attack.
3. Greater is the coefficent of drag, the lesser is the speed of the vehicle; lesser speed results
in relatively low friction with atmospheric air. Hence, an angle of attack that results in
greater drag is desirable.
4. Therefore, it can be concluded that, for a maximum drag on the re-entry vehicle, the angle
of attack should be 450.
11. REFERENCES
1. Flow Simulation over Re-Entry Bodies at Supersonic& Hypersonic Speeds by Shiva
Prasad U and Srinivas G, International Journal of Engineering Research and
Development, 2012; 4.
2. Simulation and Optimization of Spacecraft Re-entry Trajectories by Derrick G. Tetzman.,
May 2010.
3. Analysis of heat transfer in hypersonic flow over re-entry configurations by R. Balu and
L. Prince Raj, June 2012; 3.
4. Aero-Thermodynamic Analysis of Expert Capsule reentry Vehicle Using CFD by
Narendranath Alokam, B. Dinesh Kumar, D.Muppala, International Journal of Science