Open Access
Research
How equitable are GP practice prescribing rates for statins?: an
ecological study in four primary care trusts in North West England
Paul R Ward*
1, Peter R Noyce
2and Antony S St Leger
3Address: 1Department of Public Health, Flinders University, Adelaide, Australia, 2School of Pharmacy and Pharmaceutical Sciences, University of Manchester, UK and 3School of Epidemiology and Health Sciences, University of Manchester, UK
Email: Paul R Ward* - [email protected]; Peter R Noyce - [email protected]; Antony S St Leger - [email protected]
* Corresponding author
Abstract
Background: There is a growing body of literature highlighting inequities in GP practice prescribing rates for a number of drug therapies. The small amount of research on statin prescribing has either focussed on variations rather than equity per se, been based on populations other than GP practices or has used cost-based prescribing rates.
Aim: To explore the equity of GP practice prescribing rates for statins, using the theoretical framework of equity of treatment (also known as horizontal equity or comparative need).
Methods: The study involved a cross-sectional secondary analysis in four primary care trusts (PCTs 1–4) in the North West of England, including 132 GP practices. Prescribing rates and health care needs indicators (HCNIs) were developed for all GP practices.
Results: Scatter-plots revealed large differences between individual GP practices, both within and between PCTs, in terms of the relationship between statin prescribing and healthcare need. In addition, there were large differences between GP practices in terms of the relationship between actual and expected prescribing rates for statins. Multiple regression analyses explained almost 30% of the variation in prescribing rates in the combined dataset, 25% in PCT1, 31% in PCT3, 51% in PC4 and 58% in PCT2. There were positive associations with variables relating to CHD hospital diagnoses and procedures and negative associations with variables relating to ethnicity, material deprivation, the proportion of patients aged over 75 years and single-handed GP practices.
Conclusion: Overall, this study found inequitable relationships between actual and expected prescribing rates, and possible inequities in statin prescribing rates on the basis of ethnicity, deprivation, single-handed practices and the proportion of patients aged over 75 years.
Background
The authors of this paper published a recent paper in this journal which attempted to explain the variations in GP prescribing rates for a range of coronary heart disease (CHD) drugs [1]. The findings were based on multiple
regression analyses, whereby the dependent variables were prescribing rates for different CHD drugs, and the independent variables were specifically developed proxies of healthcare need (e.g. CHD mortality and morbidity rates, demographics of the patient population,
socio-eco-Published: 27 March 2007
International Journal for Equity in Health 2007, 6:2 doi:10.1186/1475-9276-6-2
Received: 31 March 2006 Accepted: 27 March 2007
This article is available from: http://www.equityhealthj.com/content/6/1/2 © 2007 Ward et al; licensee BioMed Central Ltd.
nomic status of the patient population etc). The paper showed that variations in GP prescribing rates could be explained to vastly differing degrees and were also related to different proxies of healthcare need. For example, there were negative relationships between prescribing rates and patient age, deprivation and ethnicity. From these find-ings, and other related papers published by the authors [2-5], we concluded that GP prescribing rates were inequita-ble. The present paper uses data from the same study to further explore the issue of equity of prescribing. This time, we specifically examine the equity of statin prescrib-ing usprescrib-ing a variety of descriptive, visual and multivariate analyses. Our focus on statin prescribing stems from the huge international interest in the prescribing of drugs to reduce cholesterol and the associated problems of pre-scribing statins to all those people who 'need' them. In other words, prescribing of statins represent an important case-study on which to situate an exploration of equity.
Aims of the paper
The overall aim of this paper is to provide further evidence on the equity of GP practice prescribing rates for statins across and within 4 primary care trusts (PCTs) in the North West of England. This is mainly achieved by explor-ing the associations between statin prescribexplor-ing rates and proxies of health care need (called health care needs indi-cators (HCNIs) throughout this paper), although we also explore the associations between actual and expected pre-scribing rates for statins.
Importance of statins in the management of CHD
Statins are a group of drugs which are widely used in the primary and secondary prevention of coronary heart dis-ease (CHD), and their clinical effectiveness is well known [6-9]. There has been an increasing amount of evidence about the effectiveness of statins since the mid 1990s, which has lead to increased pressures on general medical practitioners (GPs) to prescribe these drugs, although the financial implications of prescribing statins to all eligible patients may mean that such a strategy is not affordable [10]. This conundrum lead one commentator to pose the question, "How can GPs prescribe in line with the evidence yet manage to remain within budget?" [11], and for others to suggest that statin prescribing should be prioritised for those patients with the highest levels of health care need [12]. Therefore, since statins cannot be prescribed to all patients with clinical need (due to financial considera-tions), research around the equity of statin prescribing is extremely important and timely.
Since publication of the trials on the effectiveness of stat-ins, there has been an overall increase in the level of statin prescribing within the UK, although this has not occurred to the same extent across GP practices [13-15] or across all patient groups with established coronary heart disease
within GP practices [16,17]. Whilst we recognise that var-iations in statin prescribing exist, less consensus exists on how to quantify and understand the equity of such varia-tions. The need to understand the nature and cause of such variation remains paramount since consistency of service for its own sake may be pointless [18].
Studies attempting to explain the variation in statin pre-scribing rates have been modest, with most studies explaining around 20 per cent of the variation [14,16,19,20]. The prevalence of CHD explained 12 per cent of the variation in statin prescribing in men, and 7 per cent in women [16], deprivation explained 14 per cent [14], and a combination of nitrate prescribing rates and population aged between 35 and 74 years explained 18 per cent [20]. Therefore, the majority of variations in sta-tin prescribing rates remain unexplained.
Importance of researching the equity of GP prescribing
One of the most important principles of health care sys-tems in the developed world is based around the notion of equity. Within the UK, the National Health Service (NHS) was set up to provide a universal entitlement to the same quality of health care services solely on the basis of clinical need [21,22]. There are large literatures around how to define, operationalise and measure equity in rela-tion to health care services [22-24], although equity is generally taken to mean 'fair' or 'just'. Equity has been divided into three domains: equal access to health care for people in equal need; equal treatment for people in equal need; and equal outcomes for people in equal need [22]. Whilst this is a simplification of the nature of equity, it is useful in delineating the various domains in which ineq-uities may arise.
does not necessarily mean that the population of GP prac-tice B is not in need – the prescribing rates of GP pracprac-tice B may not be at an adequate level. This approach merely attempts to assess comparative need (or equity), and makes no judgements about the appropriateness of pre-scribing.
The concept of equity of prescribing is extremely impor-tant in the area of prescribing, since it informs us of the groups of patients who are currently receiving these drug therapies (and maybe do not need the drugs) and those who are currently not receiving these drug therapies (and maybe do need the drugs). There is a sound evidence base in terms of the effectiveness and which patients may ben-efit from statins [6,9,27-29] although our evidence base in terms of who actually receives the drugs in practice is less well developed. Obviously, it is also crucial to understand which patients also benefit from the drugs (equity of out-comes), although that is not within the remit of this paper. This paper is aimed at the interface between who could benefit from these drugs (eg older populations, South Asian populations, deprived populations, popula-tions with a high prevalence of CHD and/or a high mor-tality rates from CHD), and who actually receives the drugs.
Evidence on the equity of statin prescribing
Although there is overwhelming evidence as to the effec-tiveness of statins, there seems to be a "treatment gap" [30] between those people for whom treatment is indicated, and those people who actually receive it. Indeed, at a con-ference held by the Royal College of Physicians in Edin-burgh, it was suggested that although the use of statins has increased substantially in Great Britain over the last few years, "many people who would benefit from the drugs are still not receiving them" [31].
A number of studies have explored the treatment gap for statins at the individual level, although these have not explored the equity of prescribing per se. Some UK studies have found that only around 20 to 30 per cent of people with CHD are prescribed statins [32], although studies in the US and Europe have found higher prevalences (around 40 per cent) of statin use in patients with CHD [33-37]. Sub-optimal treatment has also been found for patients with cholesterol concentrations above recognised treatment limits. In two UK based studies, the majority of people with a history of CHD were not taking a statin, but had cholesterol levels above that at which treatment with statins is recommended [32,38]. In addition, over half those who were taking statins still had high cholesterol levels, possibly due to the low doses prescribed.
Whilst a number of studies have highlighted variations in the access to, and provision of CHD hospital
interven-tions on the basis of patient age, gender, ethnicity and socio-economic status, [39-43] there is only a small, but growing, literature which has focussed on the equity of statin prescribing rates at a population level. Statin pre-scribing has been shown to vary between health authori-ties, PCTs and GPs [4,5,13-16] and between patients on the basis of gender, age and ethnicity [4,16,19,43-46]. Pre-scribing rates of statins are positively associated with GP diagnoses of CHD [16] and with expected rates of CHD prevalence [4,19]. However, characteristics of GP practices such as their training status, the number of GPs, or their single-handed status have been found to have no relation-ship with prescribing rates for statins [14,20].
Methods
This section focuses on the setting for the study and the data sources and methods used to develop actual and expected prescribing rates and proxies for health care need (called health care needs indicators (HCNIs) in this paper), which were developed for each GP practice in the 4 PCTs. More details of the data sources and methods used can be found in our previous paper [1] and else-where [4,5]. Local Research Ethics Committee approval was granted for this study.
Setting
The cross-sectional, ecological study was undertaken in four primary care trusts (PCTs) in the North West of Eng-land (called PCT1, PCT2, PCT3, and PCT4 throughout this paper). GP practices with fewer than 1000 registered patients were excluded from analysis (n = 16). After excluding these GP practices, there were 132 GP practices (50 in PCT1, 24 in PCT2, 31 in PCT3, and 27 in PCT4) with a combined registered population of over 350,000 patients aged over 35 years.
Developing actual prescribing rates for statins
When an NHS prescription is dispensed in primary care, the prescription form is sent to the Prescription Pricing Authority for processing, which collates these data and provides them to GP practices and PCTs in the form of Prescribing Analysis and Cost (PACT) data. PACT data are available for all GP practices in England, and allow detailed interrogation in terms of drugs prescribed along with their dosages, pack sizes and formulations. For exam-ple, for a specific time period, we can collect data on which statins were prescribed by a GP practice in addition to the dosages and pack sizes. This allows for a complex and timely analysis of PACT data. Useful critiques of PACT data can be found elsewhere [47,48].
available to prescribe in primary care. These statins were Atorvastatin, Cerivastatin, Fluvastatin, Pravastatin, and Simvastatin, and PACT data were collected for all of them. However, Cerivastatin was withdrawn from use in 2001. Nevertheless, since Cerivastatin was licensed for use dur-ing the period of data collection, it remains part of the PACT data used in subsequent analysis. The prescribing rate was calculated for all statins combined.
The denominator for the prescribing rate was the total reg-istered (and resident) patient population aged over 35 years. This age group was chosen since the prevalence of CHD is particularly low in people aged less than 35 years [49]. The numerator was Average Daily Quantities, which are discussed in more detail in our previous paper [1] and elsewhere [50-52].
Developing expected prescribing rates for statins
Data were collected in the General Practice Research Data-base on age-sex rates of prescribing for statins, which are presented in Table 1.
The General Practice Research Database derives data from a representative sample of GP practices in England (211 GP practices with a combined population of around 1.4 million patients) about the NHS care received by their reg-istered patients [49]. This group of GP practices regularly collects data for the General Practice Research Database. From these data, expected prescribing rates of statin pre-scribing were calculated by applying the age-sex specific rates to the same age-sex groups within the registered pop-ulations of all GP practices in the study. In this way, an expected rate of statin prescribing was calculated, based on the demographics of the GP practice registered popu-lation. It should be remembered that these prescribing rates are not the 'clinically correct' prescribing rates, but a nationally representative sample on which to compare GP prescribing within our study sample.
Developing health care needs indicators (HCNIs)
Again, the data sources and methods used to develop the HCNIs are discussed in much more detail in our previous paper [1]. However, we will briefly outline them here in order for the reader to be able to interpret the findings from this paper.
In total, 24 HCNIs were developed for each GP practice in this study, and all of these were entered into multiple regression models. A list of the HCNIs developed are pro-vided in Appendix A, although the only HCNIs discussed here are those included in the final regression models (i.e. those HCNIs which had independent, statistically signifi-cant associations with statin prescribing rates). It is recog-nised that all of the variables discussed here do not relate specifically to health care need (some relate to supply and others to administrative factors), although the term is used here to identify the set of variables used in the anal-yses.
Demographic HCNIs were developed directly from GP practice list data, and these relate to the percentage of patients aged 55–74 years, and the percentage aged over 75 years. Both of these demographic groups are indicators of health care need for CHD drugs [49]. The Low Income Scheme Index was used as a proxy for low income since it represents the percentage of prescriptions which are exempt from prescription charges due to low income [53]. The percentage of patients from all ethnic minority groups was estimated for each GP practice using data from the 1991 census. The method of patient weighted attribution was used to develop these estimates using data at enumer-ation district level [54-56].
Data were also obtained from hospital episode statistics on specific hospital procedures (coronary artery bypass graft (CABG), percutaneous transluminal angioplasty (PTCA) and coronary angiogram) and diagnoses (primary diagnosis of CHD) [57]. Although hospital episode statis-tics relate to the supply, as opposed to need for health care services, it was hypothesised that in the absence of other CHD morbidity data, they may represent a useful proxy of CHD morbidity in GP practice populations. Crude rates (per 1000 patients aged over 35 years) were calculated for CHD procedures (CABGs, PTCAs and angiograms) and CHD diagnoses. In addition, overall rates of CHD hospi-tal episodes were calculated (diagnoses + procedures) which are called CHD hospital episode statistics through-out this paper.
Two additional variables were examined: number of full-time equivalent GPs per 1000 registered patients and whether the practice was single-handed. Whilst these var-iables do not relate specifically to health care need, they
Table 1: Age-sex prescribing rates for specific CHD drug groups
Sex 35–44 45–54 55–64 65–74 75–84 85+
Male 6.1 26.0 56.7 67.5 25.5 2.6
Female 2.0 10.4 38.5 57.0 21.6 2.4
have been shown to affect service provision and the equity of health care, and therefore were included in analyses.
Data analysis
Correlations between actual and expected prescribing rates were calculated using Spearman's Rank Correlation Coefficient and the Mann-Whitney test was used to detect differences in mean prescribing rates between single-handed and multiple partner practices. Multiple linear regression modelling was undertaken for in each PCT in addition to the combined dataset (all data were normally distributed). Analysis was undertaken within both PCTs and the overall dataset in order to further understand dif-ferences between PCTs – by solely focusing on the com-bined dataset, we would ignore any important differences between PCTs.
The dependent variable in each model was the statin pre-scribing rate and the independent variables were the HCNIs developed in the study. The forward-stepwise approach was taken and the final models were checked for collinearity and normality of residuals. The final regres-sion models only contained the HCNIs which had statis-tically significant (p < 0.05) independent associations with the dependent variable, and each model was checked for collinearity and normality of residuals. Overall, for each multiple regression model, all 24 HCNIs were entered as independent variables, and the final model included only those variables that were statistically signif-icant and added to the fit of the model.
Results
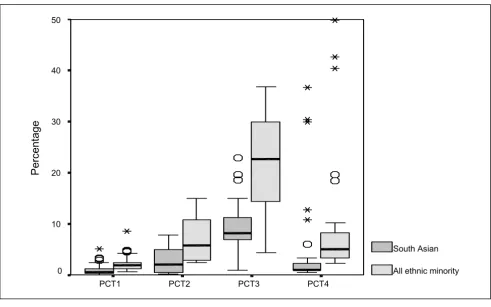
Details about the 'health needs' of populations of the PCTs are provided in Figures 1, 2, 3, 4. These represent the demographics (Figure 1), ethnicity (Figure 2), multiple deprivation (Figure 3) and CHD hospital interventions (Figure 4). A general overview of comparative health care need suggests that PCT4 had the highest levels of CHD related health care needs within the study, whereas PCT1 had the lowest health care needs. PCT4 was the most deprived of all PCTs and had the highest proportions of patients aged over 75 years. In contrast, PCT1 may be seen as the 'least needy' of all PCTs on the basis of the HCNIs developed in this study. PCT1 was the least deprived, had the lowest proportions of South Asian groups and the lowest median rate of CHD hospital procedures. How-ever, PCT1 had the highest median percentage of patients aged between 55 and 74 years which may well be the tar-get age-group for prescribing within CHD.
Associations between actual and expected prescribing rates
There were statistically significant correlations (p < 0.05) between actual and expected prescribing rates in PCT2 (r = 0.407), PCT3 (r = 0.366), PCT4 (r = 0.43) and the
com-bined dataset (r = 0.438). Although statistically signifi-cant, the magnitude of associations were rather low, suggesting that actual prescribing rates are not highly associated with expected prescribing rates based on the data in the General Practice Research Database. Indeed, in PCT1, the correlation was non-significant. Whilst this does not infer inequitable prescribing, it does suggest that prescribing patterns in these PCTs does not conform to what we may expect given their age-sex compositions.
Figure 5 presents a scatter-plot to show the variation between the 132 GP practices and PCTs in terms of the association between actual and expected prescribing rates. The generally positive association in the combined dataset can be seen in the scatter-plot, although the large degree of variation between individual GP practices is also appar-ent. For example, in PCT3, one GP practice has the lowest expected prescribing rate and another has the third high-est, although their actual prescribing rates are fairly simi-lar. If one draws a vertical line on the scatter-plot with an actual prescribing rate of 15 Average Daily Quantities per patient aged over 35 years, there is around a two-fold dif-ference in the expected prescribing rates between the GP practices.
Associations between statin prescribing rates and HCNIs
The multiple regression models for each PCT in addition to the combined dataset are presented in Table 2, reveals that between 25% and 58% of the variation in prescribing rates could be explained between the individual PCTs. When regression analysis was undertaken for the com-bined dataset, we could explain almost 30% of the varia-tion.
In PCT4, all three variables had negative beta coefficients, suggesting that single-handed practices and those with higher proportions of ethnic minority patients and patients aged over 75 years were more likely to have lower prescribing rates. The mean prescribing rate in single-handed practices throughout the combined dataset was 18.6 (SD 9.5) Average Daily Quantities per patient aged over 35 years and the corresponding rate for multiple part-ner practices was 20.7 (SD 7.1). This difference was statis-tically significant (p = 0.042) using the Mann Whitney test.
The Low Income Scheme Index score explained 11% of the variation in prescribing rates in PCT3, and the beta coefficient was negative, suggesting that GP practices with higher Low Income Scheme Index scores had lower pre-scribing rates. Figure 7 shows a scatter-plot of prepre-scribing rates and the Low Income Scheme Index score. This is sug-gestive of a negative association in PCTs 2 to 4, and a lack of association in PCT1. Again, this scatter-plot reveals large difference within PCTs. For example, in PCT4, there are a number of GP practices with prescribing rates
around 10 to 20 Average Daily Quantities per patient aged over 35 years, although their Low Income Scheme Index scores almost 4-fold. Again, this is suggestive of inequities in prescribing rates.
Discussion
The regression models explained more variation in pre-scribing rates than those found in other studies. For exam-ple, most studies have explained around 20 per cent of the variation [14,16,19,20], whereas 30 per cent of the varia-tion was explained in the combined dataset. In addivaria-tion, analyses for individual PCTs revealed that 50 per cent of the variation in PCT4 and almost 60 per cent in PCT2 could be explained.
The HCNIs developed from hospital episode statistics were present in the regression models for three PCTs, and were positively related to prescribing rates. Another study [58] also used hospital episode statistics for primary diag-noses of CHD as a proxy for health care need, although the authors did not find a positive relationship between rates of statin prescribing and CHD hospital episode
sta-Box-plot of patient demographics by PCT Figure 1
Box-plot of patient demographics by PCT.
PCT4 PCT3
PCT2 PCT1
Percentage of patients in age group
30
20
10
0
% 55-74 years
tistics. Nevertheless, other studies have also found posi-tive relationships between rates of PTCAs and statin prescribing [35,38,59].
The percentage of patients aged 55–74 years was generally positively related to prescribing rates, suggesting that pre-scribing rates are related to health care need. Whilst this
HCNI only explained 3 per cent of the variation in pre-scribing rates, a number of studies have found that statin prescribing is higher in this age group, than in older age groups [16,32,36,59], with one study finding that the pro-portion of patients aged 35–74 years explained 5 per cent of the variation in statin prescribing rates between GP practices [20]. The percentage of patients aged over 75
Table 2: Multiple regression models
PCT R2 Needs indicator Standardised beta coefficient % variance explained
PCT1 (n = 50)* .245 CHD diagnoses rate .489 15.0 WTE GPs/1000 patients -.327 9.5
PCT2 (n = 24)* .583 CHD hospital episode statistics rate .763 58.3
PCT3 (n = 31)* .313 CHD procedures rate .490 20.7 Low Income Scheme Index -.327 10.6
PCT4 (n = 27)* .505 Single handed -.340 27.0 Ethnicity -.538 12.5 % patients aged >75 -.373 11.0
Combined (n = 132)* .289 CHD hospital episode statistics rate .350 14.7 % patients aged >75 -.240 4.2
Ethnicity -.233 3.1 % patients aged 55–74 .199 2.9 * n refers to the number of GP practices in each PCT which were contained in the regression model
Box-plot of ethnicity by PCT Figure 2
Box-plot of ethnicity by PCT.
PCT4 PCT3
PCT2 PCT1
Percentage
50
40
30
20
10
0
South Asian
years had a negative relationship with prescribing rates in PCT4 and the combined dataset. A number of studies found that older patients were much less likely than younger patients to receive a prescription for a statin [16,32,36,59], which may result from the lack of research evidence on the efficacy of statins in elderly populations. Therefore, although the percentage of patients aged over 75 years is a proxy for CHD prevalence, it may not repre-sent a useful proxy of the potential to benefit from statins.
The findings from this study provide conflicting evidence as to the relationship between prescribing rates and depri-vation. In PCT1, PCT2 and PCT4, there was little evidence of associations between deprivation and prescribing rates, although statin prescribing rates in PCT3 were associated with the Low Income Scheme Index score (negative asso-ciation). Therefore, there does not seem to be a simple relationship between prescribing rates and deprivation which applies in all PCTs. Since CHD prevalence increases in deprived populations, one would expect a positive association between prescribing rates and the Low Income Scheme Index score, and therefore the negative associa-tion in PCT3 and lack of associaassocia-tion in the other PCTs is suggestive of inequities in prescribing rates.
The estimated proportion of patients from ethnic minor-ity groups was negatively associated with prescribing rates in PCT4 and the combined dataset, which is similar to findings elsewhere [44,46]. However, the construction of the ethnic minority HCNI in this study was based on enu-meration district populations, often with low numbers of ethnic minority populations, and therefore further work would be required to provide a rigorous assessment of the suggestion being made in this study. Nevertheless, these patterns add further weight to suggestions about the ineq-uity of prescribing rates on the basis of ethnicity.
Although the HCNIs developed from GMS data do not necessarily reflect health care needs, they were neverthe-less important in explaining variations in prescribing rates. In general, single-handed GP practices had lower prescribing rates than multiple partner GP practices and the number of WTE GPs per 1000 patients had negative associations with rates of statin prescribing PCT1. A number of studies have found that organisational factors such as the ones used in this study were not associated with statin prescribing rates [14,20]. However, the impor-tance and impact of health care supply has been recog-nised in the recent allocation formula for prescribing
Box-plot of multiple deprivation by PCT Figure 3
Box-plot of multiple deprivation by PCT.
PCT4 PCT3
PCT2 PCT1
Z Score
120
110
100
90
80
70
Townsend
budgets, which includes variables related to training and single-handed GP practices in addition to the number of GPs per patient [60]. Indeed, in developing the allocation formula, the authors also found that prescribing rates were negatively associated with single-handed GP prac-tices.
Main strengths of the paper
Firstly, the study explicitly focussed on the equity of pre-scribing, as opposed to solely explaining the variation in prescribing rates. In this way, this paper extends our pre-vious paper in this journal. Secondly, the study was based on all GP practices (with practice lists over 1000 patients aged over 35 years) in 4 PCTs, rather than a random sam-ple such as those in the General Practice Research Data-base. Therefore, the results are directly applicable to the PCTs and enable them to develop local policies/guidance without the need to infer from GP practices in other areas. Thirdly, we used prescribing rates based on Average Daily Quantities, which are more applicable to UK general prac-tice, and also based on the population at risk from CHD (those aged over 35 years). As already stated, international comparisons may wish to use Defined Daily Doses. Fourthly, we used a wide range of data sources for the
HCNIs, rather than relying solely on the 1991 Census. Fifthly, we developed expected prescribing rates for all GP practices which may be used by the PCTs to audit changes in the equity of prescribing rates over time. Finally, we produced scatter-plots which enable the identification of individual GP practices which seem to either have higher or lower actual than expected prescribing rates. Further work could then be undertaken within these GP practices in order to understand the reasons behind their apparent inequitable prescribing rates and subsequently to provide education and support to make their prescribing rates more equitable.
Main weaknesses of the paper
Firstly, ecological analyses cannot be used to infer causal relationships or to infer similar relationships at an indi-vidual level (the ecological fallacy). Future studies may take an approach based on multi-level analysis, although this was outside the scope of this study. Secondly, the study size was determined by considerations of practica-bility rather than study power. Thus although the positive findings remain valid and interesting it is possible that true, but lower magnitude, relationships exist between Statin prescription and some of the variables that dropped
Box-plot of hospital procedures and diagnoses by PCT Figure 4
Box-plot of hospital procedures and diagnoses by PCT.
PCT4 PCT3
PCT2 PCT1
6-year crude rate (per
1000 patients over 35 years)
160
140
120
100
80
60
40
20
0
CHD procedures
out of our regression models. Thirdly, PACT data refer only to NHS scripts that have been dispensed at pharma-cies, rather than all prescriptions issued by GPs. Thirdly, hospital episode statistics data can be limited by lack of accuracy and completeness and only refers to diagnoses and procedures in NHS hospitals. Finally, the data on sta-tin prescribing rates is based on 1999–2000 data, which may be slightly out of date given the recent increases in statin prescribing. However, we have no evidence that this increase has increased the equity of prescribing rates, since it may have increased at a similar rate across all GP prac-tices. Nevertheless, it may be useful to provide data for 2005–2006 to confirm or reject this.
Conclusion
Overall, this study has found that statin prescribing rates may be explained (to differing degrees between PCTs) by a mixture of HCNIs relating to both health care need and
supply. Rates of CHD procedures and diagnoses were gen-erally positively associated with prescribing rates, although the percentage of ethnic minority patients, the percentage of older (>75 years) patients, deprivation and GP administrative factors were negatively associated in some PCTs. Therefore, the findings from this study show that GP practice prescribing rates for statins are generally inequitable, although the strength of this inequity and the patient groups involved (ethnic minority, older and deprived patients) differ between PCTs.
The National Service Framework for coronary heart dis-ease [61] has highlighted variations in the quality and access to CHD services in the UK. However, the equity of CHD services such as GP prescribing rates has been a neglected area of research. This study adds to weight to the assertions of the National Service Framework about the inequitable supply of CHD services and may form the
Scatter-plot of actual and expected statin prescribing rates Figure 5
Scatter-plot of actual and expected statin prescribing rates.
0.00 10.00 20.00 30.00 40.00 50.00
Actual prescribing rate
14.00 16.00 18.00 20.00 22.00 24.00 26.00 28.00 30.00 32.00
Expected prescrib
ing
rate
baseline for further studies to assess the effectiveness of the National Service Framework in reducing the inequities in prescribing rates.
Competing interests
The author(s) declare that they have no competing inter-ests.
Authors' contributions
PW was awarded funding for this study, was involved in the conception, design and managed the day to day run-ning of the study, undertook all data collection and anal-ysis, and wrote the paper. PN and ASL were involved in the conception and design of the study, made active con-tributions in project meetings, were involved in an advi-sory capacity in all aspects of the project and advised on drafts of the paper. PW is the guarantor.
Appendix A – List of health care needs indicators
(HCNIs) developed during the study
• Proportion of patients aged between 55 and 74 years
• Proportion of patents aged over 75 years
• Proportion households with no car
• Proportion males who are economically inactive
• Townsend Score
• Proportion of households receiving council tax benefits
• Proportion unemployment
• Index of Multiple Deprivation
• Income Deprivation Index
• Low Income Scheme Index (LISI) score
• Standardise mortality rate (SMR) for CHD under 75 years
Scatter-plot of statin prescribing rates and CHD HES rate Figure 6
Scatter-plot of statin prescribing rates and CHD HES rate.
0.00 10.00 20.00 30.00 40.00 50.00
Total ADQs patient aged over 35 years
50.00 100.00 150.00 200.00
Crud
e HES rate (per 10
00 p
atients ag
ed o
ver 35 yea
rs)
PCT1PCT2• 6-year crude rate of coronary artery bypass grafts (CABGs) per 1000 patients
• 6-year crude rate of percutanious transluminal angi-oplasty (PTCAs) per 1000 patients
• 6-year crude rate of coronary angiograms per 1000 patients
• 6-year crude rate of CHD hospital procedures (CABGs + PTCAs + angiograms) per 1000 patients
• 6-year crude rate of CHD hospital diagnoses per 1000 patients
• 6-year crude rate of CHD prevalence (diagnoses + proce-dures) per 1000 patients
• Regionally specific prevalence, age and sex standardised prescribing units per patient over 35 years (PASS-PUs)
• Proportion of population defining themselves as 'non-white'
• Proportion of population defining themselves as 'South Asian'
• Proportion of population over 30 with a limiting long-term illness (LLI)
• Health Deprivation Index
• Proportion of households with more than 2 cars
• Access Deprivation Index
Acknowledgements
Paul Ward received a Health Services Research Training Fellowship from the North West NHS Executive to carry out the study on which this paper is based. We thank all anonymous reviewers, health authority, PCT and Local Authority staff who provided access to PACT data, GP practice list data, hospital episode statistics and a variety of other data sources.
Scatter-plot of statin prescribing and LISI score Figure 7
Scatter-plot of statin prescribing and LISI score.
0.00 10.00 20.00 30.00 40.00 50.00
Total ADQs patient aged over 35 years
0.00 10.00 20.00 30.00 40.00 50.00
LISI sc
ore
References
1. Ward PR, Noyce PR, St Leger AS: Exploring the equity of GP practice prescribing rates for selected coronary heart dis-ease drugs: a multiple regression analysis with proxies of
healthcare need. International Journal for Equity in Health 2005, 4:.
2. Ward PR, Noyce PR, St Leger AS: Differential associations between actual and expected GP practice prescribing rates for statins, ACE inhibitors, and beta-blockers: a
cross-sec-tional study in England. Therapeutics and Clinical Risk Management
2005, 1:61-68.
3. Ward PR, Noyce PR, St Leger AS: Multivariate regression analy-sis of associations between general practitioner prescribing rates for coronary heart disease drugs and healthcare needs
indicators. J Epidemiol Community Health 2005, 59:86-87.
4. Ward PR, Noyce PR, St Leger AS: Are GP practice prescribing rates for coronary heart disease drugs equitable? A cross
sectional analysis in four primary care trusts in England. J
Epi-demiol Community Health 2004, 58:89-96.
5. Ward PR, Noyce PR, St Leger AS: Developing prevalence-based prescribing units for analysing variations in general
practi-tioner prescribing: a case study using statins. J Clin Pharm Ther
2003, 28:23-29.
6. Shepherd J, Cobbe S, Ford I, Isles CG, Lorimer AR, MacFarlane PW, McKillop JH, Packard CJ: Prevention of coronary heart disease with pravastatin in men with hypercholesterolemia. West of
Scotland Coronary Prevention Study Group. N Engl J Med
1995, 333:1301-1307.
7. Downs JR, Clearfield M, Weis S, Whitney E, Shapiro DR, Beere PA, Langendorfer A, Stein EA, Kruyer W, Gotto AM Jr.: Primary pre-vention of acute coronary events with lovastatin in men and women with average cholesterol levels: results of AFCAPS/ TexCAPS. Air Force/Texas Coronary Atherosclerosis
Pre-vention Study. JAMA 1998, 279:1615-1622.
8. Group SSSS: Randomised trial of cholesterol lowering in 4444 patients with coronary heart disease: the Scandinavian
Sim-vastatin Survival Study (4S). Lancet 1994, 344:1383-1389.
9. Sacks FM, Pfeffer MA, Moye LA, Rouleau JL, Rutherford JD, Cole TG, Brown L, Warnica JW, Arnold JM, Wun CC, Davis BR, Braunwald E:
The effect of pravastatin on coronary events after myocar-dial infarction in patients with average cholesterol levels.
Cholesterol and Recurrent Events Trial investigators. N Engl
J Med 1996, 335:1001-1009.
10. Freemantle N, Barbour R, Johnson R, Marchment M, Kennedy A: The use of statins: a case of misleading priorities? [Editorial.]. BMJ 1997, 315:826-828.
11. Evans PH: The primary prevention of coronary heart disease
with statins: practice headache or public health? Br J Gen Pract
2000, 50:695-697.
12. Bradshaw N, Walker R: Prescription of statins: cost implica-tions of evidence-based treatment applied to a health
authority population. J Clin Pharm Therapeutics 1997, 22:379-389.
13. Baxter C, Jones R, Corr L: Time trend analysis and variations in
prescribing lipid lowering drugs in general practice. BMJ 1998,
317:1134-1135.
14. Packham C, Robinson J, Morris J, Richards C, Marks P, Gray D: Statin prescribing in Nottingham general practices: a
cross-sec-tional study. J Public Health Med 1999, 21:60-64.
15. Packham C, Pearson J, Robinson J, Gray D: Use of statins in
gen-eral practices, 1996-8: cross sectional study. BMJ 2000,
320:1583-1584.
16. Majeed A, Moser K, Maxwell R: Age, sex and practice variations in the use of statins in general practice in England and Wales. J Public Health Med 2000, 22:275-279.
17. Whincup PH, Papacosta O, Walker M, Lennon L, Thomson A: Lipid lowering drug use in older British men with established
cor-onary heart disease: evidence of underuse. Heart 2001, 85:5.
18. McPherson K: How should health policy be modified by the
evidence of medical practice variations? In Controversies in
Health Care Policies. Edited by: Marinker M. London, BMJ Publishing Group; 1994:55-74.
19. Gibson A, Asthana S, Brigham P, Moon G, Dicker J: Geographies of need and the new NHS: methodological issues in the defini-tion and measurement of the health needs of local
popula-tions. Health & Place 2002, 8:47-60.
20. Bradshaw N, Fone DL, Walker R: Explaining variation in statin
prescribing: a practice based analysis. Pharm J 1999, 263:R19.
21. Le Grand J: The Strategy of Equality. London, Allan & Unwin; 1982. 22. Goddard M, Smith P: Equity of access to health care services:
theory and evidence from the UK. Soc Sci Med 2001,
53:1149-1162.
23. Whitehead M: The concepts and principles of equity and
health. Int J Health Services 1992, 22:429-445.
24. Williams A, Cookson R: Equity in health. In Handbook of Health Economics Edited by: Culyer AJ and Newhouse J. Amsterdam, Elsevier; 2000.
25. Bradshaw J: A taxonomy of social need. In Problems and Progress in Medical Care Edited by: McLachlan G. Oxford, Nuffield Provincial Hospital Trust; 1972.
26. Bradshaw J: The conceptualisation and measurement of need.
In Researching the people's health Edited by: Popay J and Williams G. London, Routledge; 1994:45-57.
27. Pignone M, Phillips C, Mulrow C: Use of lipid lowering drugs for primary prevention of coronary heart disease: meta-analysis
of randomised trials. BMJ 2000, 321:983-986.
28. Ebrahim S, Davey-Smith G, McCabe C, Payne N, Pickin M, Sheldon T, Lampe F, Sampson F, Ward S, Wannamthee G: Cholesterol and
coronary heart disease: screening and treatment. Quality in
Health Care 1998, 7:232-239.
29. Byington RP, Jukema W, Salonen JT, Pitt B, Bruschke AV, Hoen H, Furberg CD, Mancini J: Reduction in cardiovascular events dur-ing pravastatin therapy. Pooled analysis of clinical events of
the pravastatin atherosclerosis intervention program.
Circu-lation 1995, 92:2419-2425.
30. Isles CG: Patients with acute coronary syndrome should start
a statin while still in hospital. Heart 2002, 88:5-6.
31. Christie B: Statins being prescribed for those "least in need". BMJ 1999, 318:827.
32. Reid FDA, Cook DG, Whincup PH: Use of statins in the second-ary prevention of coronsecond-ary heart disease: is treatment
equi-table? Heart 2002, 88:15-19.
33. EUROASPIRE II Group.: Liefstyle and risk factor management and use of drug therapies in coronary patients from 15 coun-tries: principal results from EUROASPIRE II Euro Heart
Sur-vey Programme. Eur Heart J 2001, 22:554-572.
34. EUROASPIRE I and II Groups: Clinical reality of coronary pre-vention guidelines: a comparison of EUROASPIRE I and II in
nine countries. Lancet 2001, 357:995-1001.
35. Steg PG, Iung B, Feldman LJ, Cokkinos D, Deckers J, Fox KAA, Keil U, Maggioni AP: Impact of availability and use of coronary interventions on the prescription of aspirin and lipid
lower-ing treatment after acute coronary syndromes. Heart 2002,
88:20-24.
36. Danchin N, Grenier O, Ferrieres J, Cantet C, Cambou JP: Use of secondary preventive drugs in patients with acute coronary syndromes treated medically or with coronary angioplasty:
results from the nationwide French PREVENIR survey. Heart
2002, 88:159-162.
37. Majumdar SR, Gurwitz JH, Soumerai SB: Undertreatment of hyperlipidaemia in the secondary prevention of coronary
artery disease. J Gen Intern Med 1999, 14:711-717.
38. Whincup PH, Emberson JR, Lennon L, Walker M, Papacosta O, Thomson A: Low prevalence of lipid lowering drug use in older
men with established coronary heart disease. Heart 2002,
88:25-29.
39. MacLeod MC, Finlayson AR, Pell JP, Findlay IN: Geographic, demo-graphic, and socioeconomic variations in the investigation and management of coronary heart disease in Scotland. Heart 1999, 81:252-256.
40. Gatrell A, Lancaster G, Chapple A, Horsley S, Smith M: Variations in use of tertiary cardiac services in part of North-West
Eng-land. Health & Place 2002, 8:147-153.
41. Dong W, Ben-Shlomo Y, Colhoun H, Chaturvedi N: Gender differ-ences in accessing cardiac surgery across England: a
cross-sectional analysis of the health survey for England. Soc Sci Med
1998, 47:1773-1780.
42. Majeed FA, Cook D: Age and sex differences in the
manage-ment of ischaemic heart disease. Public Health 1996, 110:7-12.
43. Hippisley-Cox J, Pringle M, Crown N, Meal A, Wynn A: Sex inequal-ities in ischaemic heart disease in general practice: cross
sec-tional survey. BMJ 2001, 322:832.
Publish with BioMed Central and every scientist can read your work free of charge
"BioMed Central will be the most significant development for disseminating the results of biomedical researc h in our lifetime."
Sir Paul Nurse, Cancer Research UK
Your research papers will be:
available free of charge to the entire biomedical community
peer reviewed and published immediately upon acceptance
cited in PubMed and archived on PubMed Central
yours — you keep the copyright
Submit your manuscript here:
http://www.biomedcentral.com/info/publishing_adv.asp
BioMedcentral
mixed composition affect volume and cost? J Clin Pharm
Thera-peutics 2004, 29:537-546.
45. Primatesta P, Poulter NR: Lipid concentrations and the use of lipid lowering drugs: evidence from a national cross sectional
survey. BMJ 2000, 321:1322-1325.
46. Patel MG, Wright DJ, Gill PS, Jerwood D, Silcock J, Chrystyn H: Pre-scribing of lipid lowering drugs to South Asian patients:
eco-logical study. BMJ 2002, 325:25-26.
47. Chapman SR: Prescribing information systems; making sense
of primary care data. J Clin Pharm Therapeutics 2001, 26:235-239.
48. Majeed A, Evans N, Head P: What can PACT tell us about
pre-scribing in general practice? BMJ 1997, 315:1515-1519.
49. Office of National Statistics: Key Statistics from General
Prac-tice. London, ONS; 1998.
50. Walley T, Roberts DJ: Average daily quantities: a tool for
meas-uring prescribing volume in England. Pharmacoepidemiol Drug
Safety 2000, 9:55-58.
51. Prescribing Support Unit.: Defined Daily Doses, Prescribed Daily Doses and Average Daily Quantities Leeds, Prescribing Support Unit; 1997. 52. Prescribing Support Unit.: Average Daily Quantities and STAR(97)-PUs
Leeds, PSU; 2000.
53. Lloyd DC, Harris CM, Clucas DW: Low income scheme index: a new deprivation scale based on prescribing in general
prac-tice. BMJ 1995, 310:165-169.
54. Majeed FA, Cook DG, Poloniecki J, Martin D: Using data from the
1991 census. BMJ 1995, 310:1511-1514.
55. Haynes RM, Lovett AA, Gale SH, Brainard JS, Bentham G: Evalua-tion of methods for calculating census health indicators for
GP practices. Public Health 1995, 109:369-374.
56. Crayford T, Shanks J, Bajekal M, Langford S: Analysis from Inner London of deprivation payments based on enumeration
dis-tricts rather than wards. BMJ 1995, 311:787-788.
57. Kerrison S, Macfarlane A: Official Health Statistics. An Unofficial Guide.
London, Arnold; 2000.
58. Bradshaw N, Fone DL, Walker R: Equity of health care: a
ward-based analysis of primary care prescribing. Pharm J 1998,
261:R11.
59. Fonarow GC, French WJ, Parsons LS, Sun H, Malmgren JA: Use of lipid-lowering medications at discharge in patients with acute myocardial infarction: data from the National Registry
of Myocardial Infarction 3. Circulation 2001, 103:38-44.
60. Rice N, Dixon P, Lloyd DC, Roberts D: Derivation of a needs based capitation formula for allocating prescribing budgets to health authorities and primary care groups in England:
regression analysis. BMJ 2000, 320:284-288.
61. Department of Health.: National Service Frameworks for Coronary Heart Disease London, Stationary Office; 2000.
62. Office for National Statistics.: Key Statistics from General Prac-tice. Table 5C3: Persons prescribed drugs in selected BNF categories per 1000 patients by age, sex and calendar year