ISSN: 2278-067X, Volume 1, Issue 4 (June 2012), PP.06-16
www.ijerd.com
Performance Analysis of OFDMA/CDMA Based System
towards New Multiple Access Technique
Ashesh Vasalya
1, N. Amutha Prabha
21,2
School of Electrical Engineering, Vellore Institute of Technology University, Vellore-632014, Tamil Nadu, India
Abstract—The main aim of the project is to study the effect of the variation of major parameters on OFDMA systems
and to find channel estimation for CDMA/OFDMA communication systems, in which the bit/symbol error rate of a time varying channel has to be estimated in order to correct the channel interference prior to the decoding of information symbols. Also to propose a system that makes full use of the advantages of OFDMA and WCDMA to improve the performance of the overall system. With the advantages of WCDMA and OFDMA a new multiple access technique has been developed called OWCFDMA Multiple Access, by properly combining WCDMA and OFDMA, the system makes good use of their superiority and greatly improves the performance. The whole project is done with MATLAB.
Keywords— MATLAB, OFDMA, CDMA, WCDMA, Multiple Access, OWCFDMA
I.
INTRODUCTION
CDMA and OFDMA are two very potential multiple access techniques, which will be the key techniques of the next generation of wireless communications. Now 3G has adopted CDMA, while OFDMA would be the most important multiple access scheme of next generation (4G) [1]. In recent years, CDMA and OFDMA have been rapidly developed. They have their own respective advantages and disadvantages, and so far there is no evidence to conclude which one is better. Thus it is assumed that the performance of the system may be greatly improved if the advantages of them are well integrated. In order to develop new multiple access technique WCDMA is used instead of CDMA because it uses a larger 5MHz bandwidth relative to 2G CDMA which has a bandwidth of 1.25MHz bandwidth.
The current 3G systems use a wideband code division multiple access (WCDMA) scheme within a 5MHz bandwidth in both the downlink and the uplink. In WCDMA, multiple users potentially using different orthogonal Walsh codes [4] are multiplexed on to the same carrier. In a WCDMA downlink, the transmissions on different Walsh codes are orthogonal when they are received at the UE. This is due to the fact that the signal is transmitted from a fixed loca tion base station on the downlink and all the Walsh codes are received synchronized. Therefore, in the absence of multi-paths, transmissions on different codes do not interfere with each other. However, in the presence of multi-path propagation, which is typical in cellular environments, the Walsh codes are no longer orthogonal and interfere with each other resulting in inter-user and/or inter-symbol interference (ISI). The multi-path interference can possibly be eliminated by using an advanced receiver such as linear minimum mean square error (LMMSE) receiver.
Taking into account the LTE requirements and scalability and complexity issues associated with WCDMA, it was deemed necessary to employ a new access scheme in the LTE downlink therefore, with the proper combination of WCDMA and OFDMA a new multiple access technique is developed called OWCFDMA (orthogonal wideband code frequency division multiple access) multiple access. The rest of the paper is organized as follows. In section II, channel estimation of OFDMA and CDMA are discussed. In section III various major properties of OFDMA system are discussed. In section IV comparison of DL capacities were discussed. In section V new hybrid multiple access technique has been developed. In section VI all results have been shown and section VII gives the conclusion.
II.
CHANNEL
ESTIMATION
In wireless communications, channel state information (CSI) refers to known channel properties of a communication link. This information describes how a signal propagates from the transmitter to the receiver and represents the combined effect of, for example, scattering, fading, and power decay with distance. The CSI makes it possible to adapt transmissions to current channel conditions, which is crucial for achieving reliable communication with high data rates in multi antenna systems. CSI needs to be estimated at the receiver and usually quantized and feedback to the transmitter.
A. Minimum Mean Square Estimation (MMSE)
A minimum mean square error (MMSE) estimator describes the approach which minimizes the mean square error (MSE), which is a common measure of estimator quality. Let be an unknown random variable, and let Y be a known random variable (the measurement). An estimator
X̂(y) is any function of the measurement Y, and its MSE is given by
If the channel and noise distributions are known, then this a priori info can be exploited to decrease the estimation error. This approach is known as Bayesian estimation and for Rayleigh fading channels it exploits that
vec(H) ~ϹN (0,R), vec(N) ~ CN(0,S) (2)
The MMSE estimator is the Bayesian counterpart to the least-square estimator and becomes
HMMSE-estimate = (R-1 + (PT I)) H S-1 (PT I))-1 (PT I) H S-1 vec(Y) (3)
where denotes the Kronecker product and the identity matrix I has the dimension of the number of receive antennas. The estimation Mean Square Error (MSE) is
tr (R-1 + (PT I) H S-1 (PT I))-1 (4)
and is minimized by a training matrix P that in general can only be derived through numerical optimization. As opposed to least-square estimation, the estimation error for spatially correlated channels can be minimized even if „N’ is smaller than the number of transmit antenna. Thus, MMSE estimation can both decrease the estimation error and shorten the required training sequence. It needs however additionally the knowledge of the channel correlation matrix „R‟ and noise
correlation matrix „S‟. In absence of an accurate knowledge of these correlation matrices, robust choices need to be made
to avoid MSE degradation.
B. Least- Square Estimation (LSE)
If the channel and noise distributions are unknown, then the least-square estimator is:
HLS-estimate = YPH (PPH)-1 (5)
where (PPH) denotes the conjugate transpose. The estimation Mean Square Error (MSE) is proportional to
tr(PPH)-1 (6)
where tr denotes the trace. The error is minimized when (PPH)is a scaled identity matrix. This can only be achieved when N is equal to (or larger than) the number of transmit antennas. The simplest example of an optimal training matrix is to select P as a (scaled) identity matrix of the same size that the number of transmit antennas.
III.
OFDMA
SYSTEM
ANALYSIS
A. Effect of total power on signal to interference plus noise ratio SINR
Te= (P*G0)/ (N0*Rα)) (7)
Where Te is the SINR, P is the total power, G0 is the antenna gain, N0 is the noise density, α is the path loss component and R is the radius of the cluster.
B. Effect of the cluster size on the SIR due to increase in the number of users within the cell
SIR= 1
2∗ 𝑄−1 −4 + 2∗ 𝑄 −4 + 2∗ 𝑄+1 −4 (8)
where Q is called as co-channel reuse factor, which is given by Q= 3𝑁
and N is the cluster size. If Q is large then high quality transmission will be received and on other hand with smaller Q
the capacity will be higher as capacity of system depends upon the SINR.
C. Performance interference due to multiple access interference.
The signal to interference plus noise ratio includes both noise and multiple access interference received by the modem.
SINR = Eb K −1
𝑄 ∗Eb+ N0
(9)
= Eb
N0∗ Dg
The parameter Dg is the degradation in single- user performance due to the multiple access interference. It depends upon the operating Eb/N0and the no of users K; and the spreading factor Q, therefore
Dg= (1+Eb
N0
*K−1
𝑄 ) -1
(10)
IV.
DOWNLINK
CAPACITIES
OF
OFDMA/WCDMA
In New Generation Wireless Network, with assigning the subsets of sub-carriers individual users the OFDMA technology has highly contributed to the overall system performance in terms of data rates, low interference, frequency diversity, etc. In OFDMA, the interference from neighboring cells is averaged by using different carrier permutations (subsets) between users located in separate cells.
A. Capacity of OFDMA System
In orthogonal frequency-division multiplexing (OFDM), only one-tap equalization and cyclic-prefix is used, hence there is no effect of multipath interference. The capacity limit of an OFDM with the assumption of equal power can be given as
C= BW x log2 (1+SINR) [b/s] (11)
where 𝐵𝑊 represents bandwidth and the SINR is signal-to interference- noise ratio given by
SINR= P
N0+P∗If (12)
where 𝐼𝑓 is the interference factor, the ratio between other-cell and own-cell signal. Taking into account the effect of
cyclic prefix overhead for the OFDMA case; the capacity of OFDMA can be given as
c= (1- Δ
Ts) BW x log2 (1+SINR) [b/s] (13)
where Δ and 𝑇𝑠 are the cyclic prefix duration and symbol duration, respectively.
In Fig.9 it can be observed that the higher 𝐼𝑓 the further the user is located from the cell center and benefits less
from OFDMA. Hence 𝐼𝑓 is higher for the cell-edge users which mean more interference and this is the biggest drawback
for OFDMA systems. Therefore, the scheduling scheme used for the assignment the sub-carriers for the user in the cell-edge becomes more important and crucial than the users in the cell center.
B. Air interference capacity of LTE system
In this section, the air interface capacity of an OFDMA system in terms of number of subscribers is presented [10]. The total cell site capacity with the consideration of the Quality of Service (QoS) data rate is given by
Nsubs =
K∗Ns ∗Seff ∗BW ∗BHL
R (14)
where a cell site is assumed to have 𝑁𝑠 sectors and 𝑁𝑠𝑢𝑏𝑠, 𝐾, 𝑆𝑒𝑓𝑓 , 𝐵𝑊, 𝐵𝐻𝐿 and 𝑅 are number of subscribers, over-subscribe factor, spectral efficiency, bandwidth, busy hour loading and QoS data rate, respectively.
In order to provide a more practical point of view for the number of subscribers, the above equation can be modified for the downlink (DL) scenario to provide the impact of interference on the number of subscribers. Then, the number of subscribers for the DL can be approximated as
NDL, subs =
(1−Pcoh )K∗Ns ∗Seff ∗BW ∗BHL
Vaf ∗γ∗ If∗R (15)
where 𝑃𝑐𝑜ℎ, 𝛾 and 𝑣𝑎𝑓 represents percentage of channel overhead power, signal-to-noise ratio and voice activity factor,
respectively.
The average DL spectral efficiency for the different air interfaces such as 3GPP Long Term Evolution (LTE), Worldwide Interoperability for Microwave Access (WiMAX), Evolved High Speed Packet Access (HSPA+) and HSPA are given as 1.5, 1.4, 0.8 and 0.5 (b/s/Hz/sector), respectively. The typical values for the parameters used in OFDMA systems are shown as follows: 𝑃𝑐𝑜ℎ:10%, 𝐾:15, 𝑁𝑠:3, 𝐵𝑊:10, 20 and 100MHz, 𝐵𝐻𝐿: 60%, 𝑅:128 Kbps, 256 Kbps, 1.0
Mbps, 𝐼 :0.5.
Instead of providing numerous figures to show the performance of the different scenarios, for brevity, the DL capacity of LTE for different BWs and QoS data rates are shown in Fig.10 and Fig.11, respectively. As expected, the impact of bandwidth is considerable important in low SNRs, and an increase in data rate requirement results lower number of subscribers in the cell.
C. Capacity of WCDMA System
In a WCDMA system using a Rake receiver, the signal-to-interference-plus-noise ratio (SINR) for the signal received at nth multi-path component ρncan be expressed as [4]:
𝜌n =
Pn fP +N0+ N −1 Pi }
i =0,i ≠n
Where Pn is the received power on the nth multi-path component from the cell of interest. Also, f represents the ratio
between other-cell and own-cell signal. For simplicity of analysis, let us assume that equal power of P/N is received on each of the N multi-path components where P is the total received power on all the multi-path components. With this assumption, above equation can be simplified as:
ρn= P/N
f.P+No +(N−1)PN (17)
In deriving above two equations, we assumed that a single-user is scheduled at a time in a TDM (time-division multiplexed) fashion using all the cell resources. Therefore, there is no need to account for the interference among users in the same cell. Further assuming a maximum-ratio combining (MRC) for signals received at different Rake fingers (multi-paths), the average received signal-to-noise ratio can be expressed as the sum:
ρWCDMA = ρ
(N−1) n=0 n =
(N−1) n=0
P/N f.P+No +(N−1)P
N
= P
f.P+No + 1−N1 P = ρ f.ρ+1+(1−1
N)ρ
(18)
Where ρ = P/N0 is the SINR when all the power is received on a single-path and there is no interference from the other
cells. This should actually be referred to as SNR rather than SINR as the interference is zero. For a single-path frequency-flat fading channel (N = 1), the SINR in a WCDMA system becomes:
ρWCDMA =
ρ
ρ.f+No (19)
For a very large number of multi-paths, that is N >>1
ρWCDMA = ρ
ρ f+1 +1 (20)
It can be noted that the maximum achievable SINR in a WCDMA system is limited to zero dB when the WCDMA signal is received with a large number of multi-path components (N>>1). The capacity limit for a WCDMA system can then be written as:
CWCDMA = log2 (1+ ρWCDMA) [b/s/Hz] (21)
With maximum SINR limited to zero dB, the peak data rate achievable with WCDMA will be limited to 1 b/s/Hz when the signal is received with an arbitrarily large number of multi-path components.
D. Capacity comparison
In Fig. 13 Note that the performance of WCDMA and OFDMA are compared w.r.t the equations (11), (21) and it is found that the capacity of WCDMA is similar to that of OFDM for the case of single-path (N = 1) channel. It can be noted that OFDMA provides greater capacity advantage for the cases when the other-cell interference fis relatively small. This is usually the case for the users closer to the base station. For these good users, the performance is dominated by the multi-path interference for WCDMA and, therefore, eliminating multi-path interference by employing OFDMA improves capacity significantly. However, for the weak users at the cell edge with relatively larger f, the performance is dominated by interference from a neighboring cell rather than the own-cell multi-path interference. Therefore, OFDMA provides little advantage for the weak users in the cell. It can also be observed that the performance difference between OFDM and WCDMA is small for smaller ρ. In general, multi-path interference has greater impact on users with good channel conditions compared to the users with relatively weaker channel conditions.
V.
NEW
MULTIPLE
ACCESS
TECHNIQUE
A. Reuse partitioning
The concept of reuse partitioning in cellular system design is first introduced by Samuel W. Halpern during early 80‟s. The purpose of reuse partitioning is to increase system capacity over that can be achieved with a single reuse factor for a given performance objective. The underlying principle behind it is to degrade SIR performance for those users that already have more than adequate transmission quality while offering greater protection to those users that require it. Reuse partitioning is first used in TDMA and FDMA systems and it is implemented by dividing the spectrum allocation into two or more groups‟ mutually exclusive channels. Channel assignment is then determined by the reuse factor of that group. In order to achieve this cell is divided into two or more regions with different reuse factors. Mobile users with the best quality of signals received will be assigned to the group of channels having the smalle st reuse factor value, while those with the worst signal quality will be assigned to the group of channels having the largest reuse factor value.
codes are multiplexed on to the same carrier. In a WCDMA downlink (Node-B to UE link), the transmissions on different Walsh codes are orthogonal when they are received at the UE. This is due to the fact that the signal is transmitted from a fixed location (base station) on the downlink and all the Walsh codes are received synchronized. Therefore, in the absence of multi-paths, transmissions on different codes do not interfere with each other and the key feature of OFDMA systems is that it can achieve a good performance with channel coding when the co-channel interference is small. But it is weak to resist the co-channel interference. After combining WCDMA with cyclic prefix which was initially introduced for OFDMA, it can implement a system design with reuse factor 1 by averaging co-channel interference. Fig. 2 Demonstrate the hybrid spectrum of OFDMA and WCDMA.
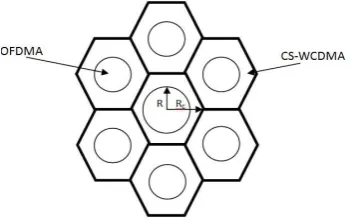
Therefore after properly combining WCDMA and OFDMA a new multiple access technique has been developed named as OWCFDMA (orthogonal wideband code frequency division multiple access), in our new multiple access technique system, the inner region adopts OFDMA to improve the capacity and the outer region uses CP-CS-WCDMA to resist co-channel interference. This ensures the capacity of the system is large, and the users at the edge of the cell can work well.
Fig 1.OWCFDMA Multiple Access Cellular System
Fig 2.Hybrid Spectrum of OFDMA and WCDMA
After suitably combining CP-CS-WCDMA and OFDMA, a new cellular system has been developed which increases the overall capacity and performance of the system considerably. Suppose all the usable frequency resource is Btotal; the frequency each cell really uses for data transmission is Bcell; the reuse factor of the inner region (OFDMA) is
NO; and the reuse factor of the outer region (CP-CS-WCDMA) is NC. If p stands for the ratio of frequency allocated to the inner region, we have
Bcell = ( P No+
1−p
Nc)* Btotal (22)
Then, in a cell, the ratio of the really used frequency resource in OFDMA to the total used frequency resource in the system is given by
fo =
Bo Bcell =
p NoBtotal
(p
No + 1−p
Nc)Btotal
= pNc
pNc + 1−p No (23)
where BOis the really used frequency resource in OFDMA.
Thus, the total reuse factor NSof the system is
Ns = Btotal
Bcell = NoNc
pNc +(1−p)No = foNo + (1-fo) NC (24)
B. Determination of Reuse factor
VI.
RESULTS
\
Fig 3.Plot of SNR Vs SER for an CDMA System with MMSE/LSE Estimator Based Receivers for BPSK
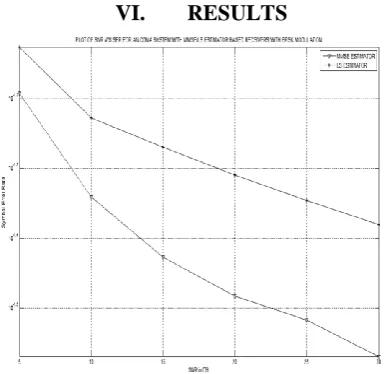
Fig 4.Plot of SNR Vs SER for an OFDMA System with MMSE/LSE Estimator Based Receivers
Fig 5.Plot of SNR Vs MSE for an OFDMA System with MMSE/LSE Estimator Based Receivers
5 10 15 20 25 30
10-1.9 10-1.8 10-1.7 10-1.6 10-1.5 10-1.4 10-1.3 10-1.2
SNR in DB
S
y
m
b
o
l
E
r
r
o
r
R
a
te
PLOT OF SNR V/S SER FOR AN OFDM SYSTEM WITH MMSE/LS ESTIMATOR BASED RECEIVERS
ser-mmse ser-ls
5 10 15 20 25
10-4 10-3 10-2 10-1
SNR in DB
m
e
a
n
s
q
u
a
re
d
e
rr
o
r
PLOT OF SNR V/S MSE FOR AN OFDM SYSTEM WITH MMSE/LS ESTIMATOR BASED RECEIVERS
Fig 6.Performance degradation due to multiple-access interference
Fig 7.Performance of SIR Vs cluster size
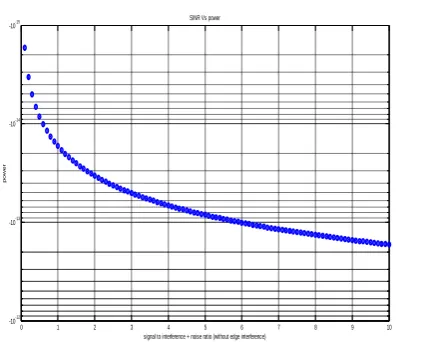
Fig 8.Performance of SINR Vs Power
1 2 3 4 5 6 7 8 9 10
0 0.01 0.02 0.03 0.04 0.05 0.06 0.07 0.08
Eb/No(dB)
D
e
g
ra
d
a
ti
o
n
d
B
performance degradation due to multiple-access interference
K/Q=1 K/Q=.75 K/Q=.5 K/Q=.25
2 3 4 5 6 7 8 9 10
0.2 0.4 0.6 0.8 1 1.2 1.4 1.6 1.8 2 2.2
signal to interference ratio (worse case)
c
lu
s
te
r
s
iz
e
SIR Vs cluster size
0 1 2 3 4 5 6 7 8 9 10
-10-12 -10-13 -10-14 -10-15
signal to interference + noise ratio (without edge interference)
p
o
w
e
r
Fig 9.DL capacity of OFDMA; Interference factor Vs Capacity limit
Fig 10.DL capacity of LTE; SNR [dB] Vs no of subscribers per cell for different BWs
Fig 11.DL capacity of LTE; SNR [dB] Vs no of subscribers per cell for different QoS
0 0.5 1 1.5 2 2.5 3 3.5 4 4.5 5
0 5 10 15 20 25 30 35
The interference factor, I
C a p a c it y li m it [M b p s ]
DL CAPACITY OF OFDMA
BW 5Mbps BW 10Mbps
0 0.1 0.2 0.3 0.4 0.5 0.6 0.7
0 5 10 15 20 25 30 SNR[dB] n o o f s u b c a rr ie rs p e r c e ll ,N s u b
DL CAPACITY OF LTE
BW 10Mbps BW 20Mbps BW 100Mbps
0 0.1 0.2 0.3 0.4 0.5 0.6 0.7
0 1 2 3 4 5 6 SNR[dB] n o o f s u b c r ib e rs p e r c e ll , N s u b
DL CAPACITY OF LTE
Fig 12.DL capacity of WCDMA
Fig 13.DL capacity comparison of WCDMA/OFDMA
Fig 14.The SIR Vs bit error probability for a OFDMA cellular System
0 0.5 1 1.5 2 2.5 3 3.5 4 4.5 5
0 0.2 0.4 0.6 0.8 1 1.2 1.4
The interference factor, f
C
a
p
a
c
it
y
l
im
it
[
M
b
p
s
]
DL CAPACITY OF WCDMA
BW 5Mbps BW 10Mbps
0 0.5 1 1.5 2 2.5 3 3.5 4 4.5 5
0 0.5 1 1.5 2 2.5 3 3.5
The interference factor, f
C
a
p
a
c
it
y
li
m
it
[
M
b
p
s
]
DL CAPACITY COMPARISON OF OFDMA/WCDMA
OFDMA WCDMA N=10 WCDMA N1=4 WCDMA N2=2
0 1 2 3 4 5 6 7 8 9 10
10-6 10-5 10-4 10-3 10-2 10-1
SIR
BER
Fig 14.The relationship of reuse factor and mobile user‟s SIR at the edge of the cells
Fig 16.Fraction of resource allocated to OFDMA versus f0 and the total reuse factor
VII.
CONCLUSION
Simulation was done using MATLAB coding. A total of major 18 MATLAB programs were written and executed. As a result more than 24 output graphs were obtained.
As the part of simulation for CDMA/OFDMA, first the programs for BPSK and QPSK modulation were written. The channel characteristics and noise was added to the modulated data and then it was transmitted. A program was written for LSE and MMSE estimator separately and this BPSK/QPSK modulated data was fed into them at receiver side. The corresponding graph was obtained in terms of Binary error rate (BER) for varying SNR values for both the estimators. This helped in finding out the better estimator techniques out of the two.
Analysis of various major parameters of OFDMA system was done with respect to SINR, Cluster Size, Capacity, Quality of Service, total Power and spreading factor also the capacities of both OFDMA and WCDMA were compared and it has been found out that the capacity of OFDMA systems are far better than CDMA Systems.
Finally, with the proper combination of WCDMA and OFDMA technologies a new multiple access technique HMA (OWCFDMA Multiple Access) has been developed also developed a new reuse partitioning system. The system makes good use of their superiority and greatly improves the performance. Theoretical analysis and simulation results have verified that the new reuse partitioning system of HMA significantly increase the capacity of cellular system.
Futurework involves the development of other Hybrid Multiple Access techniques using OTDMA-CDMA & OTDMA-OFDMA.
1 2 3 4 5 6 7 8 9 10
-10 -5 0 5 10 15 20 25
Reuse Factor (N)
S I R a t t h e e d g e (d B )
The relationship of reuse factor and mobile user’s SIR at the edge of the cells
Th=0 Th=(pi/6)
0 0.1 0.2 0.3 0.4 0.5 0.6 0.7 0.8 0.9 1
0 0.5 1 1.5 2 2.5 3
fraction of resource allocated to OFDMA (p)
t o t a l r e u s e fa c t o r (N s ) a n d f r a c t io n o f u s e d r e s o u r c e in O F D M A ( f o )
Fraction of resource allocated to OFDMA versus fO and the total reuse factor
VIII.
REFERENCES
[1]. Feng Wang, Bingli Jiao and Yuping Zhao “On Hybrid Multiple Access and Its Reuse Partitioning” IEEEcommunication society, IEEE Globecom 2010, ISSN: 1930-529X.
[2]. Baum, K.L Thomas, T.A. Vook, F.W. Nangia, V. “Cyclic-Prefix CDMA: An Improved Transmission Method for Broadband DS-CDMA Cellular Systems”, WCNC-2002 IEEE, 183 - 188 vol.1
[3]. Sabit Ekin, Serhan Yarkan, Khalid A. Qaraqeand Erchin Serpedin “On the Statistics of Sub-carrier Collisions for Cell-edge Users and Air Interface Capacity in OFDMA Systems”, ISSCS 2011, ISNB -10.1109/ISSCS.2011.5978682.
[4]. Farooq Khan, “4G Mobile Broadband Air Interface Technologies and Performance”, Cambridge University Press 2009,
ISBN: 0521882214.
[5]. Hidehiro Andoh, Mamoru Sawahashi, and Fumiyuki Adachi, “Channel estimation filter using time-multiplexed pilot channel for coherent Rake combining in DS-CDMA mobile radio”, IEICE Trans. Commun, Vol. E81-B, No.7
[6]. Yong Soo Cho, Wong young Yang “MIMO-OFDM wireless communication with MATLAB”, IEEE Press, ISBN- 978-0-470-82561-7.
[7]. Anna Zhuang, and Markku Renfors, “Combined pilot aided and decision directed channel estimation for the Rake receiver”,
in Proc. VTC 2000, pp. 7 10-71 3.3GTS 25.101 V3.3.1 (2000-06): 31d Generation Partnership Project; Technical Specification Group Radio Access Networks; UE Radio transmission and Reception (FDA) (Release 1999).
[8]. Paul Guanming Lin “OFDM Simulation in MATLAB”, California Polytechnic State University, June 2010
[9]. Hongbing Cheng “on the design of comb spectrum code for multiple access scheme”, IEEE Trans. Communication, VOL. 57, NO. 3, MARCH 2009.
[10]. Intel “WiMAX, 3G, LTE A capacity analysis” Intel corporation 2010
[11]. Simon Haykin & Michael Moher “Modern Wireless Communications” 2nd edition.
![Fig 10. DL capacity of LTE; SNR [dB] Vs no of subscribers per cell for different BWs](https://thumb-us.123doks.com/thumbv2/123dok_us/1368874.1646650/8.595.227.415.306.453/fig-capacity-lte-snr-subscribers-cell-different-bws.webp)


