Comparative Analysis of Performance of
Phase Coded Pulse Compression
Techniques
P. Keerthi Silpa1, N. Deepika Rani2 and N. Bala Subrahmanyam3
I.INTRODUCTION
RADAR is used in military for surveillance, controlling and guiding weapons, for navigation of ship etc. In many of these applications, system employs pulse compressed waveform good performance. Lewis B.L. and Kretschmer F.F. [1]-[2] describes the evolution of Frank, P1, P2, P3 and P4 phase codes from LFM and summarized on the derivation of poly-phase codes. Rawat C.D. and Sarate A.D. [3] compared peak side-lobe level, range resolution of both frequency and phase modulated pulse compression techniques simulating in MATLAB. The importance of matched filter in the receiver section for detecting the presence of the targets demonstrated by Skolnik M.I. [4]. Eustice D., Baylis C. and Marks R. J. [6] described and detailed the properties of Woodward’s ambiguity function which is output of matched filter.
In this paper, implementation of matched filter is described in section II. Dependency of range resolution on pulse width is illustrated in section III. Various phase coding techniques and corresponding matched filter responses are explained in section IV. The work is summarized in in section V by comparing the PSL of various phase codes. II.MATCHED FILTER
Basic operations performed by RADAR in the receiver section is detecting the presence of the target. Matched filter is the basic important block in the receiver section whose output is used to extract information and to detect the presence of target. Matched filter is a network whose frequency-response function leads to maximum output peak signal to mean noise power ratio (SNR). It is a linear time invariant (LTI) system and causal system whose impulse response determined maximizes the SNR. In the receiver section, the received echo signal is demodulated therefore signal
1Department of Electronics and Communication Engineering Gayatri Vidya Parishad College of Engineering (Autonomous), Visakhapatnam, A.P, India 2Department of Electronics and Communication Engineering Gayatri Vidya Parishad College of Engineering (Autonomous), Visakhapatnam, A.P, India 3Department of Electronics and Communication Engineering Gayatri Vidya Parishad College of Engineering (Autonomous), Visakhapatnam, A.P, India
International Journal of Latest Trends in Engineering and Technology
Vol.(7)Issue(3), pp. 573-580
DOI:
http://dx.doi.org/10.21172/1.73.577
e-ISSN:2278-621X
Abstract- RADAR performance is measured by its sensitivity of detecting targets at farther distance and
range resolution capability. To improve the detection ability long pulse is needed and to improve range resolution capability short pulse is needed. Thus, there exists trade-off between detection and range resolution. To overcome this problem, pulse compression techniques are employed. Pulse compression can be done either by using frequency modulation or phase modulation to simple pulse. Utilization of frequency modulated pulse compression techniques leads to arousal of high lobes at the matched filter output. Presence of high side-lobes leads to target masking in presence of multiple targets. To reduce peak side-lobe levels phase coded pulse compression technique is employed. In this paper, the PSL of various phase coding techniques are compared through simulations in LabVIEW.
processing is done on the envelope of the echo. Therefore, the input to matched filter is only envelope of the echo signal. If is the input to the matched filter, then the impulse response of matched filter is given as [4],
(1)
where the time instant where maximum SNR is obtained. Then the output of the matched filter is obtained by convolving the input with impulse response of the matched filter
(2)
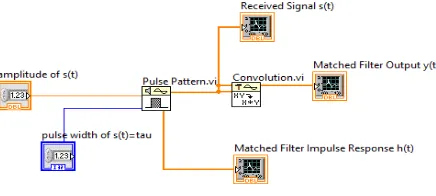
For real signals Then the response of the matched filter is equivalent to cross correlation between envelope of received and transmitted signal Implementation of the filter matched to simple pulse of unit amplitude extending from 0 to µs is shown in the Figure 1.
Figure 1. Block diagram of filter which matched to simple pulse of width and
In Figure 1, Pulse pattern.vi is used to generate pulse of 10 µs width and unit amplitude. Matched filter response is obtained Convolution.vi. For a target at range , corresponding round trip time delay , the complex envelope of
echo received will be instead of . Now is fed as input to the filter matched to as shown in
Figure 2(a).
Figure 2. (a) Implementation of matched filter whose impulse response is matched to and as input (b) Response of the filter when input is with delay
In Figure 2(a), Y[i] = X[i-n].vi is used to delay by 2µs. From Figure 2(b), it is observed that peak occurs at 12µs. The range of the target from RADAR is calculated by using
(3)
where is the time instant where peak occurs in the matched filter output. Then the range calculated using eq. (3) is obtained as 0.3km.
III.RELATION BETWEEN RANGE RESOLUTION AND PULSE WIDTH
Range resolution [5] is one of the useful metric that describes the ability of RADAR to detect the targets as distinct objects even if they are spaced closely. The RADAR is able to resolve two targets if and only if separation between two targets is equal to .
(4)
Am
pl
it
ud
e
Time (µs) (b)
P. Keerthi Silpa, N. Deepika Rani and N. Bala Subrahmanyam 575 ____________________________________________________________________________________
where velocity of light , pulse width of the transmitted signal. Therefore, Range resolution is proportional to pulse width.
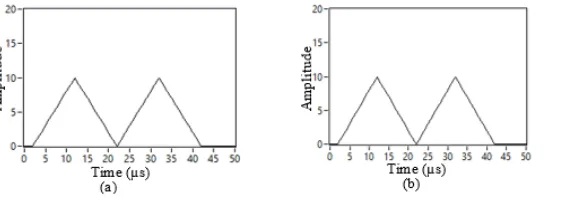
In order to examine the range resolving capability of radar, consider two targets at ranges and which are separated by . For the simple pulse of duration , the resolving capability of radar in range dimension is 1.5km according to eq.(4).Assuming one target is fixed at range = 0.3km and other target position is varied accordingly to verify the range resolution eq. (4). Based on the position of second target, three different cases are seen. For these cases, composite filter responses are shown in Figure 3, Figure 4 and Figure 5, where (a) indicates composite response obtained if individual target responses are added in phase and (b) indicates composite response obtained when target responses are added out of phase.
Figure 3. Composite response of matched filter in case 1: with when responses are added (a) in phase (b) out of phase
From Figure 3(a), a trapezoid with small flat region is seen but from Figure 3(b), user is unable to detect the presence of targets since peaks are degraded here. Similarly in case2: is chosen to be 1.5km. Then the composite responses are presented in the Figure 4.
Figure 4. Composite response of matched filter in case 2: with when responses are added (a) in phase (b) out of phase
In Figure 4(a) trapezoid with flat region extended for more duration compared to case 1 is observed and in Figure 4(b) two separate peaks are observed which indicate the presence of two different targets. In the case3: , target 2 is at range , the composite responses for this case are shown in Figure 5.
Figure 5. Composite response of matched filter in case 3: with when responses are added (a) in phase (b) out of phase
III.PHASE CODING PULSE COMPRESSION
Phase modulation or phase coding [5] is an intra-pulse modulation technique in which simple pulse of width is divided into smaller pulses named as chips. Each chip is assigned a phase. Then, the envelope of phase coded waveform can be modelled as collection of M continuous sub-pulses each of duration .
(5)
(6)
where is referred to as chip duration, phase of mth chip. Hence, the total pulse width of phase coded waveform . The number of chips is M, renamed as length of the code.
A. Bi-phase codes –
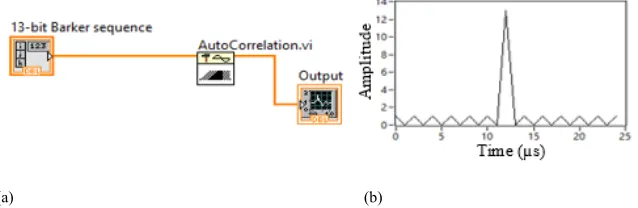
In binary phase coding, can be either 0 or π. Therefore in case of binary phase coding, takes values either +1 or -1. Barker code belongs to family of binary phase codes. For 13-bit Barker code, the phase elements are given
by . The response of filter matched to 13 bit barker code is obtained using eq. (2)
with Figure 6(a) represents the implementation of matched filter for Barker code with . AutoCorrelation.vi is used to perform auto-correlation for given input.
(a) (b)
Figure 6. (a) Implementation of matched filter for 13-bit Barker code (b) Matched filter response for 13-bit Barker code
B. Poly-phase codes –
In The phase can take any value within the interval [0, π]. Poly-phase codes that are used commonly are Frank Codes, P1, P2, P3, P4 codes.
C. Frank code –
The phase sequence is given by [1]
(7)
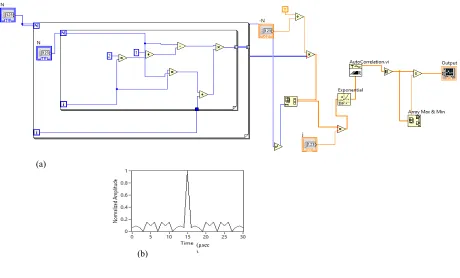
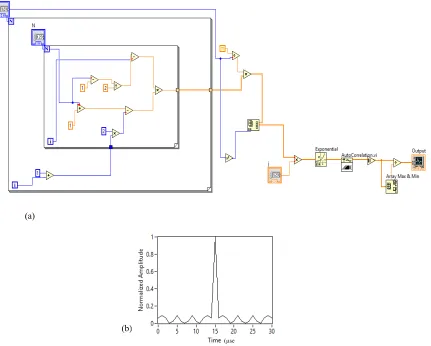
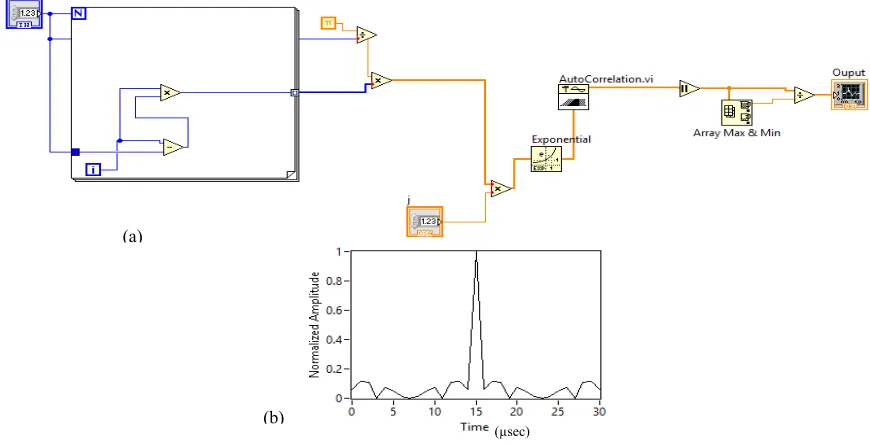
where m=1,2,…N and n=1,2,…N, N is a positive integer , is the code sequence length chosen as . Frank code of M-bit is generated using the eq. (5), eq. (6) and eq. (7). Matched filter implementation is shown in Figure 7(a). In Figure 7(a), is given as input to ‘Exponential block’ to generate and ‘Array Max & Min’ block is used to normalize the amplitude of the response.
D. P1 code –
The phase sequence is given by [1]
(8)
where m=1,2,…N and n=1,2,…N, N is a positive integer, is the code sequence length chosen as . P1 code of M-bit is generated using the eq. (5), eq. (6) and eq. (8) and matched filter implementation is shown in Figure. 8(a).
E. P2 code –
The phase sequence is given by [1]
(9)
P. Keerthi Silpa, N. Deepika Rani and N. Bala Subrahmanyam 577 ____________________________________________________________________________________
Figure 7. (a) Implementation of matched filter for M-bit Frank code (b)Matched filter response for 16-bit Frank code
Figure 8. (a) Implementation of matched filter for M-bit P1 code (b) Matched filter response for 16-bit P1 code
(a)
(µsec )
(b) (a)
Figure 9. (a) Implementation of matched filter for M-bit P2 code (b) Matched filter response for 16-bit P2 code
F. P3 code –
The phase sequence is given by [2]
(10)
where m=1, 2,…M, M is a positive integer that defines the code sequence length.P3 code of M-bit is generated using the eq. (5), eq. (6) and eq. (10) and implementation of matched filter is shown in fig. 10(a).
G. P4 code –
The phase sequence is given by [2]
(11)
where m=1, 2,…M, M is a positive integer that defines the code sequence length.P4 code of M-bit is generated using the eq. (5), eq. (6) and eq. (11) and implementation of matched filter is shown in Figure 11(a).
(a)
(b)
P. Keerthi Silpa, N. Deepika Rani and N. Bala Subrahmanyam 579 ____________________________________________________________________________________
Figure 10. (a) Implementation of matched filter for M-bit P3 code (b) Matched filter response for 16-bit P3 code
Figure 11. (a) Implementation of matched filter for M-bit P4 code (b) Matched filter response for 16-bit P4 code
(a)
(b)
(µsec)
(a)
(b)
IV.RESULTS AND DISCUSSIONS
To compare the performance of the phase codes mentioned in the paper Peak Side-lobe Level (PSL) is chosen as metric. PSL is defined as ratio of peak side lobe amplitude to main lobe amplitude. PSL in dB is given by [3]
(12)
PSL of 13-bit Barker code = -22.3 dB. The major disadvantage of Barker codes is that they are limited in number
[5]. Poly-phase codes like Frank code, P1 code, P2 code, P3 code and P4 codes are implemented for different lengths and
corresponding PSL value of matched filter responses are tabulated in Table -1.
Table-1 Comparison of PSL for code lengths M=16, M=64 and M=100
Code PSL(in dB) for M=16 PSL(in dB) for M=64 PSL(in dB) for M=100
Frank -20.91 -27.95 -30.45
P1 -16.47 -21.93 -24.43
P2 -20.91 -27.95 -30.45
P3 -19.17 -24.43 -26.02
P4 -19.17 -24.43 -26.02
Table-1 shows that, the PSL of Frank is equal to PSL of P2 code and PSL of P3 code is equal to PSL of P4 code. It is also found that Frank code, P2 code have less PSL values when compared with other poly-phase codes. It is known that Frank code, P1 code, P2 codes are applicable only if the code length is a perfect square. Therefore, P3 code and P4 code are used if the length of the code is not a perfect square and this produces relatively lower PSL but higher than Frank code and P2 code.
IV.CONCLUSION
Since Barker codes are limited in number they are not used in RADAR applications. Poly-phase codes Frank code, P1 code, P2 code, P3 code and P4 code are preferred than bi-phase codes. To avoid masking of targets the value of PSL must be as low as possible. P3 codes and P4 codes are chosen in RADAR applications in multiple target environment.
REFERENCES
[1] Lewis, B. L., and Kretschmer, F. F., “A New Class of Poly-phase Pulse Compression Codes and Techniques”, IEEE Transactions on Aerospace and Electronic Systems, 1981, Vol. AES-17, No. 3, pp. 364-372.
[2] Lewis , B. L., and Kretschmer Jr, F. F., “ Linear Frequency Modulation Derived Poly-phase Pulse Compression
Codes”, IEEE Transactions on Aerospace and Electronic Systems, 1982, Vol. AES-18, No. 5, pp. 637-641.
[3] Rawat, C. D. and Sarate, A.D., “Effectiveness of Pulse Compression Signal Processing Techniques of
RADAR”, in Proceedings of International Conference on Advances in Communication and Computing Technologies, 2014, pp. 1-4.
[4] Skolnik M. I., Introduction to RADAR Systems, 3rd Edition, Tata McGraw Hill, 2001.
[5] Richard M. A., Fundamentals of RADAR Signal Processing, Tata McGraw Hill, 2005.