111003-06-8484 IJCEE-IJENS © December 2011 IJENS
I J E N S
Soil Stabilization Techniques Using Sodium Hydroxide Additives
Olaniyan, O.S., Olaoye, R.A, Okeyinka, O.M, and Olaniyan, D.B
Department of Civil Engineering, Ladoke Akintola University of Teechnology Ogbomoso
Oyo State Nigeria
Email address – [email protected]
1.0 INTRODUCTION
Soil stabilization is the alteration of one or more soil properties, by mechanical or chemical means, to create an improved soil material possessing the desired engineering properties. There are three purposes for soil stabilization. These include increasing strength of an existing soil to enhance its load-bearing capacity, permeability improvement and enhancement of soil resistance to the process of weathering, and traffic usage among others (ASTM, 1992).
The mechanical and physical techniques of soil stabilization are based on decreasing the void rate by compacting or physically altering the grain size factions involving the adjustment of the particle size composition of soil. The chemical technique is also a common soil stabilization approach, since it produces a better quality soil with higher strength and durability than mechanical and physical techniques. The chemical techniques are dependent on reaction between chemical additives and soil particles which then produce a strong network that bind the soil grains. Mineral polymers are class of amorphous to semi-crystalline materials formed at near ambient temperature. Chemically, mineral polymers consist of cross-linked units of AlO4
–
and SiO4 tetrahedral, where charge balancing cations (Na+, k+, Li+, Ca2+, Ba2+, H3O+) are provided by alkali metals (Davidovids, 1991; ASTM, 1992).
Sodium hydroxide in a solution is a white, odourless, non-volatile solution. It doesn’t burn but highly reactive. It reacts violently with water and numerous commonly encountered materials, generating enough heat to ignite nearby combustible materials. Its principal advantages are that it can easily react with water which results into a powerful compaction aid giving a higher density for the same compactive effort. Sodium hydroxide reacts very effectively with soil rich in aluminium (Alshaaer, 2000; Olaniyan, 2008).
Aim and Objectives
The aim of this thesis is to stabilize local Kaolinitic soil material using Sodium Hydroxide. The objectives Includes the following:
• To evaluate the property and suitability of kaolinitic soil before and after stabilization by chemical polymerization techniques.
• To Investigate the mechanical properties of the mineral polymer with respect to mix proportion, such as soil to sand ratio, percentage of stabilizing agent, water content and filler material granulometry.
•
To evaluate the compressive strength, durability under wet condition and water absorption degree.Scope of Study
111003-06-8484 IJCEE-IJENS © December 2011 IJENS
I J E N S
Limitation of Study
Percentages of sodium hydroxide and filler (the sand rate) were only varried in this project . Three filler composition 50%, 150% and 200% filler composition were considered. The percentages of stabilizing agent considered are 7%, 10%, 13% and 16%.
2.0 LITERATURE REVIEW
Soil Classification System
Early attempts to classify soils were based primarily on grain size. These are the textural classification systems. In 1908, a system that recognized other factors was developed by Atterberg in Sweden and primarily used for agricultural purposes.
Somewhat later, a similar system was developed and used by the Swedish Geotechnical Commission. In the United States, the Bureau of Public Roads System was developed in the late twenties and was in widespread use by highway agencies by the middle thirties. This system has been revised over time and is widely used today.
The main objective of any soil classification system is predicting the engineering properties and behavior of a soil based on a few simple laboratory or field tests. Laboratory and/or field test results are then used to identify the soil and put it into a group that has soils with similar engineering characteristics. Probably no existing classification system completely achieves the stated objective of classifying soils by engineering behavior because of the number of variables involved in soil behavior and the variety of soil problems encountered. Soil classification should not be regarded as an end in itself but as a tool to further your knowledge of soil behavior.
2.2 Soil Stabilization
Soil stabilization is the alteration or preservation of one or more soil properties to improve the engineering characteristics and performance of a soil. The two general methods of stabilization are mechanical and and chemical stabilization. The effectiveness of stabilization depends upon the ability to obtain uniformity in blending the various materials. Mixing in a stationary or travelling plant is preferred; however, other means of mixing, such as scarifies, plows, disks, graders, and rotary mixers, have been satisfactory (Muyad, 2007; Olaniyan, 2008).
The method of soil stabilization is determined by the amount of stabilizing required and the conditions encountered on the project. An accurate soil description and classification is essential to the selection of the correct materials and procedures (Olaniyan, 2008; Gogo, 1985).
In the construction and maintenance of transportation facilities, geomaterials—soils and rocks—must be stabilized through chemical and mechanical processes. Chemical stabilization includes the use of chemicals and emulsions as compaction aids to soils, as binders and water repellents, and as a means of modifying the behavior of soil. It also includes deep mixing and grouting. Chemical stabilization can aid in dust control on roads and highways, particularly unpaved roads, in water erosion control, and in fixation and leaching control of waste and recycled materials (Graves and Smith, 1988).
Mechanical stabilization includes compaction, and fibrous and other non biodegradable reinforcement of geomaterials to improve strength. In applying these techniques, it is necessary to ensure the properties of stabilized geomaterials and their mixtures as applicable for use in the design of foundations, embankments, shoulders, subgrades, bases, and surface courses.
However, as technology advances and economic conditions change, many more chemical agents will be introduced into subgrades to improve their compactability, durability, and strength. At the same time, more performance-based testing will be necessary to prove the effectiveness of these stabilization agents. In addition, there are chemicals being used today in the petrochemical industry whose use in soils is as yet unexplored. Another area for research is such processes as injection and spray-on techniques for more economical treatment. Application of recycled and waste products has improved chemical and mechanical stabilization techniques. Such waste materials as crushed old asphalt pavement, copper and zinc slag, paper mill sludge, and rubber tire chips (Osipov and Filimonov, 2002; Gogo, 1985).
111003-06-8484 IJCEE-IJENS © December 2011 IJENS
I J E N S future highways and may reduce the cost of construction. Since many of the traditional materials design criteria are empirical and inappropriate, increased emphasis is likely to be placed on the development of mechanistic evaluation tests and techniques for stabilized materials (e.g. triaxial repeated loading tests and criteria) (Chaddock, 1996; Gogo, 1985).
3.0 METHODOLOGY
Atterberg Limit Test is first carried out on the soil sample. The materials used for the laboratory mineral polymerization analysis are clay soil (from Odo Oru in Ogbomoso, Oyo State Nigeria West Africa), sodium hydroxide in form of pellet, and sand as a filler. Filler percentage considered are 50%, 150% and 200% respectively while keeping the percentage of other constituents constant. The percentages of other constituents used are 13% Sodium hydroxide (NaOH), 18% water and 100% clay soil. The procedures used in this analysis are:
The clay soil used was classified using AASHTO classification.
Atterberg Limits test were carried out on the clay soil used.
Based on the calculated mass of the constituents, the masses of clay, water, NaOH and filler are weighed and prepared.
The NaOH pellets are added to water to obtain NaOH solution. The bottle is closed immediately and continuo stirring was done by hand shaking to obtain the violent reaction between NaOH and water. The stirring was done under continuos cooling of the plastic bottle to protect the bottle and moderate the exothermic reaction.
The NaOH solution was added to the clay-sand mixture. A hand mixing using spatula was done to ensure proper mixing of the constituent. Hopart machine was also use to shake the mixture to ensure proper mixing. In between this time, it was necessary to stop the machine to perform manual mixing at interval.
After proper mixing, the mixtures were moulded into a cylindrical specimen with approximately 50 mm height and 25 mm diameter. Eleven specimens were moulded from each composition. One of the cylindrical specimens was used for efflorescence measurement.
As soon as the specimens were weighted, they were put in an oven at 80°c for 24 hours. After this period of time, the height and diameter of each specimen were measured again.
Three of the specimens from each mix (50%, 150% and 200% filler composition) were put in an oven at 40°c for 2 weeks. The weight, height and diameter were also determined from those dried specimens. The other three of the specimen from each from each mix (50%, 150% and 120% filler) were put in plastic recipients, with demineralised water for 2 weeks. The weight, height and diameter of the soaked specimen were also determined.
The remaining three of the specimen with 50% filler and four specimens from both 150% and 200% filer were all subjected to cycles of wetting and drying. These specimens alternate between demineralised water and oven on a daily basis. The cycling process was repeated for two weeks and the weight, height and diameter were measured
The remaining specimen were used to check efflorescence
For another batch, the percentage filler was fixed as 100% while the NaOH percentage varied as 7%, 10%, 13% and 16% respectively.
3.1 Calculations
The following calculation were necessary for this experiment
Density
In order to evaluate the degree of packing of the grains, the densities of the specimen are determined by considering the weight and dimensions of the specimen after moulding and curing.
111003-06-8484 IJCEE-IJENS © December 2011 IJENS
I J E N S Where:
W = weight (kg),
d =diameter (m)
L = Length (m)
The densities were calculated for the specimen after moulding (d1), after curing at 80°c (d2) and for those dried for the second time at 40°c for the two weeks (d3). The change in density was calculated as follows:
... 3.2
Where:
∆d1: change of density percentage after curing
∆d2: change of density percentage after post curing (dried specimen)
Water Absorption
Water absorption of the immersed specimens was calculated for each series. The average absorption was calculated as follows:
... 3.3
Where:
A (%) = absorption of water expressed as percentages
Ww = weight of the immersed specimen after curing (g) which is indicated by W2 in the laboratory data
Porosity
Porosity is one of the important properties of a stabilized soil. The material that has less porosity (more impervious) will be better for the strength and water storage purposes. Porosity is a measure of the open void space in a specimen. When a specimen is completely soaked in demineralised water, most of the void portions will be occupied by water. Open porosity can be expressed as the ratio of void volume which is filled by water during soaking to the solid volume, which is the total volume of the specimen.
n = Vv/Vt ... 3.4
Where:
n = Porosity
Vv= Volume of the void(m3),
Vt
=
Total volume (m3)
Uniaxial Compression Test
The Uniaxial compression test was applied to calculate the unconfined compressive strength as shown below:
S = F/A ... 3.5
Where:
111003-06-8484 IJCEE-IJENS © December 2011 IJENS
I J E N S F=maximum load applied before failure (N)
A= cross section area of the specimens (mm2)
4.0 RESULTS AND DISCUSSION
4.1 Results Presentation
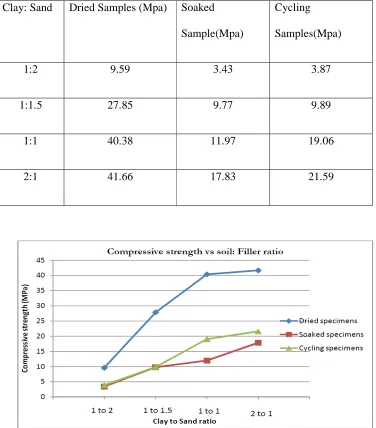
Table 4.1 Average Compressive strength
Clay: Sand
Dried Samples (Mpa)
Soaked
Sample(Mpa)
Cycling
Samples(Mpa)
1:2
9.59
3.43
3.87
1:1.5
27.85
9.77
9.89
1:1
40.38
11.97
19.06
2:1
41.66
17.83
21.59
111003-06-8484 IJCEE-IJENS © December 2011 IJENS
I J E N S
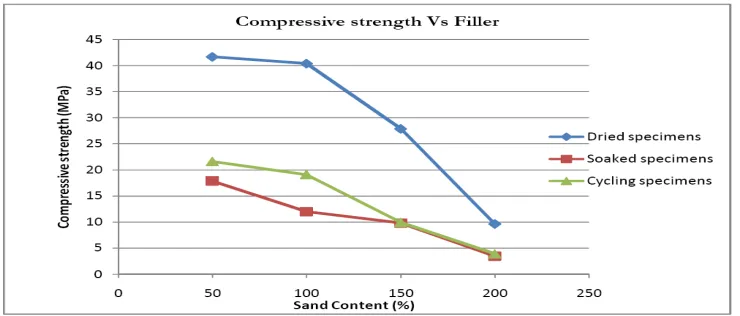
Figure 4.2 Graph of Compressive Strength versus Filler Content
From the results shown above (Figures 4.1 and 4.2), the maximum strengths obtained are 41.66 Mpa for dried samples, 17.83 Mpa for soaked samples and 21.59 Mpa for cycling samples. All those maximum values occur at clay to sand ratio of 2:1. This implies that the increase in sand ratio modified the grain fraction which makes the mixing process easier. It also reduced the cohesion between the soil particles. When the clay to sand ratio increases, this in turn increases the kaolin activity and speed up the mineral polymerization process. Higher kaolin activity gives more amounts of hard geopolymeric products (feldspatoid and hydroxysodalite) which increase the strength.
However, an increase in sand fraction supposed to increase the obtained strength which was not the case in this analysis. From the obtained result, NaOH content of 13 % was not enough to increase the strength by compensating the decrease in cohesion that result by increasing sand content. The compressive strength of cycled samples is higher than soaked samples. This means that such a stabilized kaolinitic soil is less resistant to compressive loads under wet conditions. The soaked and cycling samples have almost the same compressive strength value at 1:2 and 1: 1.5 clay/sand ratios.
4.2 Density
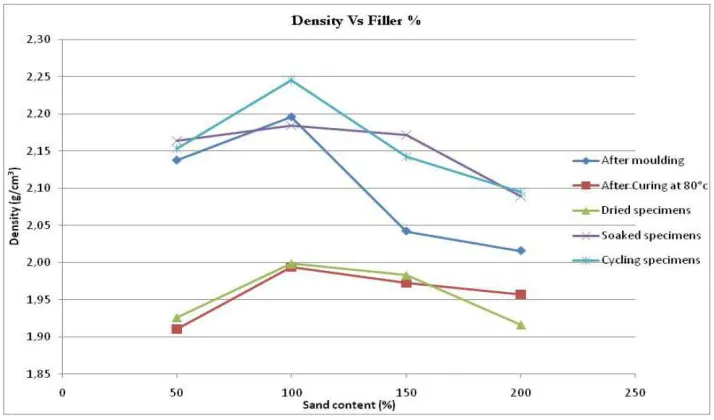
Table 4.2 Samples density at different sand content
Sand Content
(%)
After
Moulding
After
curing at
80°c
Dried
Samples
Soaked
Samples
Cycling
Samples
50
2.14
1.91
1.93
2.16
2.15
100
2.20
1.99
2.00
2.18
2.25
150
2.04
1.97
1.98
2.17
2.14
111003-06-8484 IJCEE-IJENS © December 2011 IJENS
I J E N S
Figure 4.3 Graph of Density versus Filler Content
The maximum densities are obtained for the filler content of 100% i.e. for clay to sand ratio of 1:1 (see Figure 4.3). This implies that increasing the sand content does not generate to the closest parking of the soil particles. The optimum clay to sand ratio of 1:1 gives maximum densities under all scenarios.
Table 4.3 Density at Different NaOH Content
NaOH %
7
10
13
16
Density after Moulding
2,183
2,184
2,196
2,195
111003-06-8484 IJCEE-IJENS © December 2011 IJENS
I J E N S
Figure 4.4 Graph Showing Density Against NaOH Percentages
The densities of the specimens under all NaOH content have increased after moulding with increase in NaOH content. The bonding created by alkaline solution and the subsequent isomorphous substitution of Aluminium (Al) has indeed increased the packing between the grains. The densities of the specimens under all NaOH content has decreased after curing than it were after moulding. This is due to the loss of water during the curing at 80 c. The maximum density after moulding was 2.195g/cm3 at 13%NaOH, while the minimum was 2.183g/cm3 under 7% NaOH. After curing, the maximum density was obtained for 7% NaOH samples while the minimum value of 1.994 g/cm3 was obtained at 13% NaOH.
Also from the graph above, the density response after the curing turns out to be more or less the reverse of what was noted after moulding. The unexpected result is the decrease in the density obtained with increase in NaOH after curing. A careful investigation of the plot of density against NaOH content shows an increase in density after 13%. If the NaOH content increased more than 13%, the best packing between the grains may have being obtained.
Table 4.4 Water Absorption/Open Porosity of Samples
Sand Content
(%)
Soaked
Samples
Porosity
(Soaked
Samples)
Cycling
Samples
Porosity
(Cycling
Sample)
50
12.986
11.914
24.865
22.916
100
10.263
10.151
20.331
20.679
150
10.419
9.290
20.492
18.213
111003-06-8484 IJCEE-IJENS © December 2011 IJENS
I J E N S
Figure 4.5 Water Absorption/ Open porosity versus Percentage Filler
The open porosity and water absorption of cycling samples are higher than soaked samples (Figure 4.5). The maximum water absorption /and open porosity were obtained at 50% Filler percentage. The maximum water absorption and open porosity obtained is 24.86 and 22.9 for cycling specimen with 50% filler content. The minimum water absorption is 10.26 for 100% filler content and minimum open porosity is 9.13 for 200% filler content. During cycling, the different weather condition affects the soil structure which n turn affect the stability of the soil. Cycling procedure decreases the durability of the sample as shown from lower compressive strength (Table 3.1). Thus, cycling samples are less durable than soaked samples.
Table 4.5 Water Absorption and Open Porosity for Cycled Samples
NaOH %
7
10
13
16
Water Absorption for Cycled
Sample
9.862
10.014
10.263
10.801
111003-06-8484 IJCEE-IJENS © December 2011 IJENS
I J E N S
Table 4.6 Water Absorption and Open Porosity for Wet Samples
NaOH %
7
10
13
16
Water Absorption for Wet Sample
8.360
9.093
10.151
10.068
Open Porosity for Wet Sample
17.54
17.92
20.68
20.01
111003-06-8484 IJCEE-IJENS © December 2011 IJENS
I J E N S
Fig 4.7 Water Absorption/Open porosity versus %NaOH for Wet Samples
There are variations of water absorption as percentage of NaOH changes. The water absorption more or less increases with increases in the percentage of NaOH. Although, the increase is not uniform and it is relatively low compare to other variation.
For the cycling specimen, there is no significant difference in water absorption/open porosity with the increase in NaOH content. Though, a slight increase was observed by increasing the NaOH content to 16%. This observation is different for soaked samples as the maximum open porosity and water absorption were noted at NaOH content of 13%.
Also, the cycling samples have relative ly higher water absorption and open porosity then the wet samples. Thus, the durability of such stabilized soil will be better under wet condition than cycling periods.
4.3 Effect of varying NaOH content
111003-06-8484 IJCEE-IJENS © December 2011 IJENS
I J E N S
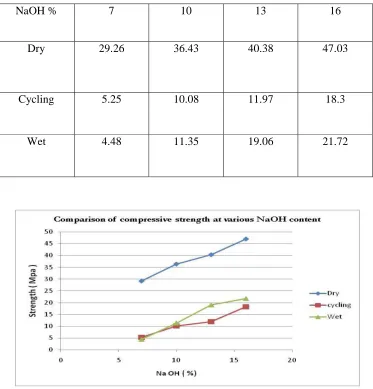
Table 4.7 Compressive Strength at Different Percentages of NaOH
NaOH %
7
10
13
16
Dry
29.26
36.43
40.38
47.03
Cycling
5.25
10.08
11.97
18.3
Wet
4.48
11.35
19.06
21.72
Figure 4.8 Graph showing Compressive strength at various NaOH conten
The dry specimen show greater strength than cycled and wet specimen. Although, they did not show disintegration, the immersed samples showed the least strength than the dried and cycle samples. The maximum strength is obtained for dried specimen with 16% NaOH while the minimum compressive strength is obtained for wet specimen with 7% NaOH content. The compressive strength of cycled samples is higher than soaked samples. Thus, such a stabilize soil is less resistant to compressive loads under wet conditions.
111003-06-8484 IJCEE-IJENS © December 2011 IJENS
I J E N S
4.4 Discussion
The laboratory activity is intended to investigate the mechanical properties of the mineral polymer with respect to mix proportions, i.e. soil to sand ratio and sodium hydroxide content. The analysis considered in this project work focussed on compressive strength, durability under wet conditions, water absorption and open porosity.
The use of filler material in the mineral polymerization process has three objectives. They includes to modify the grain fraction that makes the mix process easier by reducing the cohesion between particles, to improve the grain packing of the end products and finally to reduce the cost. Three filler percentages considered in this thesis are 50%, 150% and 200% while keeping the percentages of other constituents constant, 13% NaOH, 18% water and 100% clayey soil and 100% filler content. Table 4.1 below shows the result of compressive strength obtained for the three conditions.
5.0
CONCLUSION AND RECOMMENDATION
5.1 Conclusion
This laboratory activity was performed to have an overview of optimizing the mix proportion for mineral polymerization technique such as soil to sand ratio and sodium hydroxide percentage. It also provides more understanding on the granulometry of the filler material to supplement the sodium hydroxide which in turn minimise the cost of the mineral stabilization techniques.
Based on the obtained results, the following were observed and the conclusion drawn;
1. Clay soil to sand ratio of 100:50, among 100:100, 100:150 and 100:200 ratios, was the best ratio from the compressive strength point of view. However, from economical point of view, this ratio doesn’t give the best. The clay soil to sand ratio of 100:100 gives the closest packing and decrease the cohesion between particles. This makes the mixing relatively than a soil to sand ratio of 100:50. The same is for the cost consideration. Thus, it was concluded that a different sand granulometry should be tried and comparison be made to conclude on the influence of filler content on such mixes.
2. NaOH content of 13% gives the Optimum compressive strength. Although, NaOH of 13% was fixed to analyse the effect of the filler, yet 13% NaOH is not sufficient to increase the strength by compensating the decrease in cohesion that result due to increasing sand content.
3. Though an unexpected result of a decrease in density with increase in NaOH after curing was observed. A careful investigation of the plot of density with NaOH contents shows a start of increase in density after NaOH content of 13%. Thus, it was concluded that if NaOH content is in fact increased than this, say 20% the best packing between the grains would have been obtained.
4. The strength of cycled sample is greater than the wet samples while the durability is a reversed.
5.2 Recommendation for Further study
• Trying out a higher NaOH percentage beyond 16% is contemplated. The obtained result may not be sufficient to conclude the optimum sodium hydroxide content that is required for stabilization.
• Different ratio should be tried out to obtain the closest packing
• Zero percent filler should also be tried. Although, the use of filler is very important in this mineral stabilization technique to reduce the cost.
111003-06-8484 IJCEE-IJENS © December 2011 IJENS
I J E N S