R E V I E W
Open Access
On community structure in complex
networks: challenges and opportunities
Hocine Cherifi
1, Gergely Palla
2, Boleslaw K. Szymanski
3*and Xiaoyan Lu
3*Correspondence:
[email protected]; [email protected]
3Department of Computer Science
& Network Science and Technology Center Rensselaer Polytechnic Institute, 110 8thStreet, Troy, NY 12180, USA
Full list of author information is available at the end of the article
Abstract
Community structure is one of the most relevant features encountered in numerous real-world applications of networked systems. Despite the tremendous effort of a large interdisciplinary community of scientists working on this subject over the past few decades to characterize, model, and analyze communities, more investigations are needed in order to better understand the impact of community structure and its dynamics on networked systems. Here, we first focus on generative models of communities in complex networks and their role in developing strong foundation for community detection algorithms. We discuss modularity and the use of modularity maximization as the basis for community detection. Then, we follow with an overview of the Stochastic Block Model and its different variants as well as inference of
community structures from such models. Next, we focus on time evolving networks, where existing nodes and links can disappear, and in parallel new nodes and links may be introduced. The extraction of communities under such circumstances poses an interesting and non-trivial problem that has gained considerable interest over the last decade. We briefly discuss considerable advances made in this field recently. Finally, we focus on immunization strategies essential for targeting the influential spreaders of epidemics in modular networks. Their main goal is to select and immunize a small proportion of individuals from the whole network to control the diffusion process. Various strategies have emerged over the years suggesting different ways to immunize nodes in networks with overlapping and non-overlapping community structure. We first discuss stochastic strategies that require little or no information about the network topology at the expense of their performance. Then, we introduce deterministic strategies that have proven to be very efficient in controlling the epidemic outbreaks, but require complete knowledge of the network.
Keywords: Community detection, Stochastic block model, Time evolving networks, Immunization, Centrality, Epidemic spreading
Introduction
Complex systems are found to be naturally partitioned into multiple modules or com-munities. In the network representation, these modules are usually described as groups of densely connected nodes with sparse connections to the nodes of other groups. When a node can belong to a single community the community structure is said to be non-overlapping, while in overlapping communities a node can belong to multi-ple communities. In this position paper, in the following three subsequent sections, we
discuss three fundamental questions tied to the community structure of networks: gen-erative models, communities in time evolving networks and immunization techniques in networks with modular structure.
The next section reviews the work on generative models for communities in complex networks and their role in developing strong foundation for community detection algo-rithms. We start with modularity which is an elegant and general metric for community quality, and which has also been used as the basis for community detection algorithms by modularity maximization (Newman2006b; Clauset et al.2004; Blondel et al.2008; Chen et al.2014a). This method was recently proven (Newman2016c) to be equivalent to maximum likelihood methods for the planted partition. More generally, the recovery of stochastic block model finds the latent partition of networks nodes into the communi-ties which are equal to or correlate with the truth communicommuni-ties used for generation of the given network.
The stochastic block model also serves as an important tool for the evaluation of com-munity detection results, including the diagnosis of the resolution limit on comcom-munity sizes and determining the number of communities in a network. We review several widely used random graph models and introduce the definitions of the stochastic block model and its variants. We also described some recent results in this area. The first one presented in Lu and Szymanski (2020) discovers sufficient and necessary conditions for modular-ity maximization to suffer from resolution limit effects and proposes a new algorithm designed to avoid those conditions. Another one, presented in Lu and Szymanski (2019), uses one parameter to indicate if the assortative or disassortative structure is sought by the inference algorithm. This approach enables the algorithm to avoid being trapped at the inferior local optimal partitions, improving both computation time and the quality of the recovered community structure.
“Time evolving communities” section focuses on the time evolution of complex systems, study of which has been enabled by the rapid increase in the amount of publicly available data, including time stamped and/or time dependent data. The net-work representation of such systems naturally corresponds to time evolving netnet-works, where existing nodes and links can disappear and, in parallel if needed, new nodes and links may be introduced. The extraction of communities under such circum-stances poses an interesting and non-trivial problem that has gained considerable interest over the last decade. Over time, communities might grow or shrink in size, may split into smaller communities or merge together forming larger ones, abso-lutely new communities may also emerge, and old ones can disappear. Keeping track of a rapidly changing community embedded in a noisy network can be challenging, especially when the time resolution of the available data is low. Nevertheless, consid-erable advances have been made in this field over the years, which we shall briefly discuss.
Immunization strategies are the essential techniques to target the influential spreaders in networks. Their main goal is to select and immunize a small proportion of individ-uals from the whole network to control the spread of epidemics. To do so they rely on various properties of the network topology. For example, the network degree dis-tribution has been extensively studied. Indeed, as real-world contact networks exhibit a power-law degree distribution, targeting preferentially high degree nodes appears to be an effective strategy. Community structure is also a well-known property of social networks. Recent studies have shown that it affects the dynamics of epidemics, and that it needs to be considered to design tailored epidemic control strategies (New-man2006a; Salathé and Jones2010; Gong et al.2013; Restrepo et al.2008; Ghalmane et al.2018). This section presents an overview of recent and influential works on this issue.
The generative models of communities in complex networks Model definition
Erd˝os–Rényi model
The Erd˝os–Rényi (ER) random graph (Erdos and Renyi1959) is perhaps one of the earliest works on random graph models. It has two closely related definitions. Given a set ofn
nodes andmedges, one variant of the ER model randomly connectsmpairs of different nodes. This process generates a collection of unique graphs of exactlynnodes and m
edges, each of them being generated uniformly at random.
The other variant of ER model (Gilbert1959) specifies the probability of forming an edge between every pair of different nodes. According to this definition, each pair of nodes is connected with a probabilitypindependently at random. By the law of large numbers, as the number of nodes in such random graph tends to infinity, the number of generated edges approachesn2p. The likelihood of generating a networkGofnnodes andmedges is
P[G]=pm(1−p)(n2)−m (1)
Since every edge is generated randomly with the same probabilityp, the degree of any particular node in the ER model follows the Binomial distribution.
Configuration model
Similar to the ER model, the configuration model (Molloy and Reed1995) assumes that the edges are placed randomly between the nodes. The randomization conducted by the configuration model always preserves the pre-defined node degree which can be repre-sented as the number of adjacent half-links or stubs. The network generation process keep randomly pairing every two stubs to create an edge until no stub remains. Hence, the con-figuration model produces an ensemble of graphs with the same degree sequence. The number of edges between different nodesiandjaveraged over all the graphs generated in this way is equal tok2imkj for sufficiently largemwhereklis the degree of nodeland the
number of edgesm= 12lkl. The configuration model is considered a benchmark in the
which is given as
Q= 1
2m
r
{i,j}∈r
Aij−kikj
2m
=
r
mr
m −
κr
2m 2
, (2)
where{i,j} ∈ rdenotes every pair of nodes inside communityr,mr is the number of
edges with both endpoints inside the communityr,κris the sum of the degrees of nodes in communityr.
It is worth noting that the network generated by the configuration model does not exclude the self-loop edges, each of which connects a node to itself and the multi-links which are the multiple edges between the same pair of nodes. However, when the num-ber of nodes approaches infinity, the density of self-loops and multi-links in the network generated by the configuration model tends to zero.
Unlike the pre-defined node degrees in the configuration model, the expected node degrees in the ER model are all the same, which are rarely observed in real graphs. Thus, the graphs produced by the configuration model are more realistic than the ER graphs thanks to the node degree variations.
Stochastic block model
Standard SBM.The standard stochastic block model (Holland et al.1983) is a gener-ative model of the graph in which nodes are organized as blocks and edges are placed between nodes independently at random. In the standard stochastic block model, each nodei in the network is associated with a block assignmentgi. The number of edges
between nodes iandj is independently distributed. It follows a Bernoulli distribution with meanωgi,gj, a parameter which depends only on the block assignments of two
end-points. Thus, the standard stochastic block model is parameterized by a matrix= {ωrs} whose component ωrs denotes the probability of forming an edge between a node in block r and the other node in block s. Given the block assignment{gi} and the edge
probability matrix , the likelihood of generating an undirected unweighted network
Gis
P[G|{gi},]=
i<j
ωgigj
Aij
1−ωgigj
1−Aij
(3)
where Aij ∈ {0, 1}denotes the number of edges between nodes i andj. The standard
stochastic block model can be used in a priori block model setting, where the block assignments are pre-defined, and the objective is to estimate. It can also be used in the posteriori block model setting, which estimates and the block assignments {gi}
simultaneously.
In the posteriori block modeling setting, the number of blocks in SBM is usually speci-fied in prior to applying the statistical inference such as maximum likelihood estimation (MLE) to the model. This is because the maximum likelihood generating the observed graph always increases by assuming more blocks. When every node forms one single block, the MLE obtainsωgˆ igj = 1 if there is one edge between nodesiandjandωgˆ igj=0
otherwise, leading to the maximum likelihood P[G|{gi},]=1. But such specification
network.
Degree-corrected SBM.Since the standard stochastic block model considers nodes in the same block statistically indistinguishable in terms of the probability of forming edges, the degree heterogeneity is ignored. However, real-world networks typically dis-play broad degree distributions. The lack of degree heterogeneity makes the standard stochastic block model unsuitable for applications to many realistic networks. Therefore, the degree-corrected stochastic block model (Karrer and Newman2011) incorporates the degree heterogeneity, assuming that the number of edges between any pair of nodesiand
jfollows the Poisson distribution with meanωgi,gjθiθjwhereθlis a model parameter
asso-ciated with each nodel. In an unweighted undirected multi-graph, after ignoring all terms independent of the model parameters, the log-likelihood simplifies to
logP[G|{gi},{θi},]=
1 2
ij
Aijlog
ωgi,gjθiθj
−ωgi,gjθiθj
(4)
whereAij is the number of edges between different nodesiandjfori =j; for the
sim-plicity of the expression, the model definesAii=2kfor any nodeiwithkself-loop edges. Given a partition of the network, i.e., the block assignments{gi}, the posterior maximum likelihood estimates ofθiandωrsare
ˆ
θi= ki κgi
, ωrsˆ =mrs, (5)
whereκr = i∈rki is the sum of the degrees of all nodes in a blockr, and mrs is the
total number of edges between blocksrands, or twice the number of edges inrifr=s. Plugging in the maximum likelihood estimates above and skipping the irrelevant terms, the log-likelihood of the degree-corrected stochastic block model can be simplified as
logP[G|{gi}]=
rs
mrslog mrs
κrκs. (6)
It is worth mentioning that the degree-corrected stochastic block model assumes that the number of edges between any two nodes follows the Poisson distribution. In the standard stochastic block model where the number of edges draws from the Bernoulli, it is rare that the edge probability is close to 1, because most real networks are often sparse. A Bernoulli random variable with a small mean is well approximated by a Poisson random variable (Perry and Wolfe2012), which makes the Poisson distribution a good replacement here for the number of edges between two nodes.
Planted partition model
Similar to the degree-correction of the standard stochastic block model, the standard planted partition model can be extended to its corrected version. In the degree-corrected planted partition model (Newman2016c), the number of edges between any two nodesiandjfollows the Poisson distribution with meanωgi,gj
kikj
2m whereωgi,gj =ω1if
gi =gjor otherwiseωgi,gj =ω0. Given the block assignments{gi}and parametersω0and
ω1, the log-likelihood of generating a particular graph is
logP[G|{gi},{ω1,ω0}]=
1 2
ij
Aijlog
ωgi,gj
kikj
2m
−ωgi,gj
kikj
2m
(7)
which, after a small amount of manipulation, can be re-written as
logP[G|{gi},{ω1,ω0}]=B ⎡ ⎣ 1
2m
r
{i,j}∈r
Aij−γkikj
2m ⎤
⎦+const. (8)
where {i,j} ∈ r denotes every pair of nodes in block r, the termsB = mlogω1 ω0 and γ = ω1−ω0
logω1−logω0 are independent of the block assignments{gi}. Comparing Eq.8with the
definition of generalized modularity of Reichardt and Bornholdt (2006), maximizing the log-likelihood of the degree-corrected planted partition model is equivalent to maximiz-ing the generalized modularity with a specific resolution parameterγ. This equivalence result shows that maximizing generalized modularity tends to find communities of similar statistical properties. In realistic networks where edges are heterogeneously distributed within different communities, however, there may not be a single resolution parameterγ sufficient to avoid the resolution limit anomaly (Fortunato and Barthelemy2007; Lu and Szymanski2020). As a result, small well-formed communities are likely to be merged into inappropriate large groups, while large well-formed communities spread across smaller ones.
Model inference
Despite of being widely used for community detection, modularity maximization is prov-ably NP-Hard (Brandes et al.2016) that implies that any algorithm based on this approach may fail on some inputs. It also suffers from the resolution limit anomaly in which the well-formed dense communities get merged into a large cluster or the loose commu-nity inappropriately splits into multiple smaller clusters to increase the modularity. An alternative approach for community detection is the statistical inference to fit the gener-ative model to the observed network data. Such approach assumes the observed network is produced by a random graph model with a pre-defined partition of the network as the model parameter. In general, the statistical inference aims at recovering the partition which maximizes the likelihood of the random graph model generating the observed net-work data. In this section, we introduce the inference methods for the generative graph models which usually requires selecting the number of blocks and discuss their con-nection to the traditional modularity optimizations and the resolution limit anomaly in “Relation to modularity resolution limit” section.
Selecting the number of communities
where every node becomes a single community. Therefore, one needs to specify the num-ber of communities for these random graph models. One approach is to find the numnum-ber of communities by the statistical inference (Riolo et al.2017; Newman and Reiner2016). Alternatively, according to the Occam’s Razor, the model inference process should take into account the complexity of the model, which can be measured by the model descrip-tion length (Peixoto 2012). Other work (Peixoto 2017) also uses the Bayesian model selection to determine the number of the communities in a network. Ghasemian et al. (2019) provides a detailed discussion of commonly used approaches to select the number of communities for random graph models.
Monte Carlo Markov chain
The simplest Markov Chain Monte Carlo approach is to propose moving each node from its original block into one of theBblocks randomly, which easily satisfies the require-ments of ergodicity and detailed balance because any block assignment can be reached from the current block assignment with finite and aperiodic expected number of steps. However, considering the size of the partition spaceONKfor a network withNnodes
andKblocks, the naive MCMC approach is not practical. Therefore, (Peixoto2014) pro-poses the optimized Markov Chain Monte Carlo (MCMC) algorithm with the greedy heuristic to infer the block assignment. Initially, every node in the network is assigned to one random block independently. Then, one attempts to move a node from blockrtos
with a probability conditioned on its neighbor’s block assignmentt
p(r→s|t)= mts+ smts+B
.
In the above, > 0 is a free parameter to fulfill the ergodicity condition such that any block assignment can be reached from the current block assignment with the finite and aperiodic expected number of steps. Whentends to∞, the proposed function reduces to the naive scheme which assigns random block to the current node. However, such naive scheme is inefficient. Indeed, the possibility of current node being assigned to the correct block assignment is very low, thus, such assignment does not increase the log-likelihood in most cases. Consequently, the assignments are rejected very frequently, wasting the computational resource. By applying a relatively small, the assignment selected by the function proposed above is more likely to get accepted. The intuition behind this func-tion is that, given that there are many edges across blocks sandt, a node with many neighbors in blocktis likely to be assigned to blocks. Thus, the function proposed above is more likely to be accepted, avoiding the computational cost wasted by many rejected assignments.
To ensure the detailed balance, each proposed move is accepted with a probabilityain the Metropolis-Hastings fashion (Metropolis et al.1953) given by
a=min
exp(L)
tntp(s→r|t)
tntp(r→s|t)
, (9)
whereLis the change of log-likelihood after the move and the node of the proposed move hasntneighbors in blockt.
them long time to escape. To address this issue, the authors of Lu and Szymanski (2019) apply a simple constraint on nodes’ internal degree ratio in the objective function. This approach is independent of the inference algorithm. The resulting algorithm reliably finds assortative or disassortative structure as directed by the value of a single parameter. The paper contains the results of validation of the model experimentally by testing its perfor-mance on several real and synthetic networks. The experiments show that the inference of degree-corrected stochastic block model quickly converges to the desired assortative or disassortative structure. In contrast, the inference of degree-corrected stochastic block model gets often trapped at the inferior local optimal partitions.
Modularity optimization method
Newman (2016c) proposes an iterative algorithm to find the optimal values of,gthat maximize the log-likelihood of the degree-corrected planted partition model. Newman (2016c) also shows the maximum likelihood estimates of the block assignmentsg = {gi}
is equivalent to maximizing the generalized modularity
Q(γ )= 1
2m
ij
Aij−γ kikj
2m
δgi,gj (10)
which is given as a function ofγ, a positive parameter known as the resolution parameter. The algorithm repeats the following two steps until convergence:
• Given the values of= {ω1,ω0}, find the optimal block assignmentgmaximizing
the log-likelihood of degree-corrected planted partition model defined in Eq.7. This is equivalent to maximizing the generalized modularityQ(γ )with aγ = ω1−ω0
logω1−logω0, gnew=arg max
g logP(A|,g)=arg maxg Q(γ )
• After updatingg, find the= {ω1,ω0}under the current block assignmentgby the
maximum likelihood estimation,
new=arg max
logP(A|,g)
Relation to modularity resolution limit
The maximization of the generalized modularity is equivalent to the maximum-likelihood estimation (MLE) of the degree-corrected planted partition model on the same graph (Newman2016c). Hence, the partition of the network which most likely generates the observed network also maximizes the generalized modularity with a particular resolu-tion parameter. However, in the planted partiresolu-tion model, all communities have similar statistical properties, which is unusual in practical application.
well-formed communities are likely to be spread among multiple clusters. In the oppo-site case when the resolution parameter is lower than the bound presented in the paper, some communities are inappropriately merged into one large component. The conclusion is that the generalized modularity resolution limits arise when a network contains a subgraph whose lower bound is higher than the upper bound of another subgraph because in such a case any resolution parameter will be either above the upper bound of latter subgraph or below the lower bound of the former subgraph or both.
To address the above mentioned problem, the authors of Lu and Szymanski (2020) introduce a progressive agglomerative heuristic algorithm that systematically increases the resolution parameter. The algorithm recursively splits the resulting clusters of the previous level to detect smaller communities. As the recursion proceeds, the algo-rithm gradually increases the resolution parameter for high-resolution community detection in local subgraphs of the network. The algorithm proceeds until the final partition is no longer statistically significant. This approach avoids getting trapped by the resolution limit and does not require multiple re-computing of the resolution parameter (Newman2016c), which can be computationally prohibitively costly for large networks.
Time evolving communities
As mentioned in the “Introduction” section, one of the challenging problems related to communities is given by the partitioning of time evolving networks. Here we briefly overview the most widely used methodologies and important advances related to this area. A very nice survey providing a more in depth description of the various approaches with formal definitions, algorithms, etc. was recently published by Rossetti and Cazabet in Ref. Rossetti and Cazabet (2018).
Snapshot based approaches
Probably the most simple approach is to define snapshots, corresponding to static graphs, representing the state of the evolving network at a given time point, and to apply a static community finding method to the subsequent snapshots (Hopcroft et al. 2004; Asur et al. 2007; Palla et al. 2007; Greene et al. 2010; Rosvall and Bergstrom 2010; Bródka et al.2013). The communities found in the neighboring time steps then have to be matched with each other somehow. One of the basic ideas is to use the Jaccard-index for measuring the relative overlap between the communities, and match the pairs in the decreasing order of the Jaccard-index (Palla et al. 2007). Naturally, the Jaccard-index can be replaced by any other similarity measure such as e.g., the normalized mutual information (Danon et al.2005; Lancichinetti et al.2009), the adjusted mutual information (Amelio and Pizzuti2017), or any advanced information based similarity in general.
into account e.g., the link structure of the communities) it is not uncommon for a com-munityCi(t)at time steptto have two or even more corresponding communitiesCj(t+1) at time stept+1 with equal similarity toCi(t)simply because the membership values can take only integer numbers. Thus, when choosing the most similar community from the next time step as the image ofCi(t)att+1, we might run into the problem of having multiple equally similar candidates. Another problem is that a large community attcan have a non-zero similarity with many different communities att+1, and thus, if we fol-low the merging and splitting processes between the communities without any restriction on the minimal similarity, the lineage of the evolving community structure can become extremely subtle and complicated. Of course, using a minimum similarity threshold can make the picture clearer, however, at the cost of the introduction of an extra parame-ter to the method. Last but not least, in case we are using a static community finding method that allows overlaps between the communities, finding the best match between the subsequent time steps can become even more tricky (Palla et al.2007). For the above reasons, the introduction of more specialized community finding methods targeted at time dependent networks was very well motivated.
Evolutionary algorithms
The key idea behind these approaches is to provide a unified framework in which the inference of communities at a given time steptcan take into account information about the network structure at other time steps as well. One of the first methods pointing in this direction was suggested in Chakrabarti et al. (2006), where the goal was to opti-mize both for ’point wise’ precise communities reflecting the modular structure of the network at any given time pointt, and for keeping the change in the community struc-ture between two subsequent time steps as low as possible. This was achieved in a rather general framework, where a cost function is introduced composed of two parts, the first related to the accuracy of the communities located at the different time steps, and the second term corresponding to the ’historical cost’, depending on the similar-ity of the partitions at subsequent time steps. The second term also involves a user defined parameter (a simple multiplicative factor) with which we can balance the trade-off between lowering the point-wise accuracy and gaining smoothness of evolution in time. In Chakrabarti et al. (2006) the method is used with hierarchical clustering andk -means clustering together with historical costs specifically using the nature of the applied clustering.
Another quite general framework for evolutionary community finding was proposed in Mucha et al. (2010), based on the concept of multislice networks. In such systems, the network structure can be organized into layers, where the layers represent different types of connections between the same nodes such as e.g., social media connections, e-mail connections and personal acquaintances between the same people. By taking any community finding approach in general that is suitable for detecting communities in multiple levels simultaneously, the same method can be also applied to evolutionary community finding if we represent the time evolving network as a multislice network, where the different layers correspond to the subsequent time steps during the time evo-lution. The solution offered in Mucha et al. (2010) is based on modularity, however as mentioned above, the generality of the framework allows any further multislice methods as well.
A further general problem class into which the challenge of evolutionary clustering fits naturally is given by consensus clustering (Lancichinetti and Fortunato2012). The basic idea of consensus clustering is to apply multiple different clustering methods to the same network, and then bring the found (presumably different) partitions to consensus, resulting in stable, relevant communities even for stochastic community finding methods. However, this approach is also very suitable for evolutionary clustering when the setup is modified as follows. First, based on the time evolving network data, following the well-known concept of sliding time windows, a number of time frames are defined, where each frame corresponds to the aggregation of a certain number of consecutive time steps in the original data, and also the neighboring time frames show a significant overlap with each other to ensure stability and a smooth time evolution of the communities. Next, a static community finding algorithm is applied to the subsequent time frames, and then the obtained results are brought to consensus, again, over sliding windows of a fixed length (Lancichinetti and Fortunato2012).
Generative models such as the stochastic block model can also provide very interesting solutions for evolutionary clustering. In Ref. Yang et al. (2009) the concept of the dynamic stochastic block model is introduced, where in addition to the usual group member-ship probabilities and membermember-ship dependent linking probabilities, further probabilistic transition matrices are considered for describing the evolution of node memberships between the subsequent time steps. A more general formulation of the model is given in Peixoto (2015) with the help of a layered stochastic block model, where the layers can naturally correspond to time steps in case of a dynamic network, however the approach can handle general multilayer networks as well. Important results on the detectability thresholds for the dynamic stochastic block model are presented in Ghasemian et al. (2016) based on the cavity method, while in Peixoto and Rosvall (2017), the concept of higher order Markov chains (and thus, the possibility for memory effects) are success-fully incorporated into the framework of dynamic stochastic block models. A common feature of the above methods is that the results are obtained via Bayesian inference, which in practice is usually implemented with the help of a Markov chain Monte Carlo algorithms (Yang et al.2009; Peixoto2015; Peixoto and Rosvall2017).
an inference of the stochastic blocks directly from the raw data. In parallel, the stochas-tic block model framework can be also used for a joint reconstruction of the network structure and the communities from time varying functional data (Peixoto2019), where synergistic effects were reported, as the inferred blocks improved the reconstruction accuracy of the links, which in turn also made accuracy of the inferred communities better.
Incremental clustering, online community finding and predicting community evolution
In case of the previously mentioned methods, we assumed a ’complete knowledge’ about the time evolution of the system at least on the level of the input data, thus, when inferring the communities at a given time step, information about the network structure coming from later time steps was also available, and could be made use of. A somewhat more restrictive setup is where at a given time point only the data corresponding to previous time steps can be used. Such scenario could be when small but fast changes occur in a large network, and our aim is to always give the currently best partitioning of the network into communities, which however is also likely to be quite similar to the partitioning in the previous time steps. The concept of incremental clustering fits to this setup in a natu-ral manner (Aynaud et al.2013), where instead of running the community finding method of our choice ’from scratch’ on the current snap shot of the studied network, we consider the changes in the network structure and update the communities from the previous time step. A method following this approach was proposed in Ning et al. (2010) based on spec-tral clustering, while in Bansal et al. (2011); Görke et al. (2010) modularity optimization techniques were used for a similar purpose. However, further static community finding methods such as the label propagation approach can also be adapted to this framework as shown in Xie et al. (2013), and the problem of overlapping communities can also be handled (Cazabet et al.2010). Additional incremental clustering techniques can be found in Refs. Duan et al. (2012); Falkowski et al. (2008); Nguyen et al. (2011); Cazabet and Amblard (2011); Görke et al. (2012); Ma and Huang (2013); Lee et al. (2014); Zakrzewska and Bader (2015).
An idea closely related to incremental clustering is given by the concept of online clus-tering in dynamical networks (Aggarwal and Yu2005). This framework considers large networks updated in a stream fashion, where changes in the communities are detected online, separated from offline community detection and exploratory querying. A some-what different strategy for online community finding is proposed in Zanghi et al. (2008) based on expectation-maximization and the stochastic block model, and further methods are proposed in Refs Rossetti et al. (2017); Tan et al. (2014).
A closely related problem to the above described ’instantaneous’ community detection methods is given by the challenge of predicting the future changes in communities for time evolving systems. The first results in this direction were related to the prediction of whether a community will grow and/or survive, or instead will disappear (Kairam et al.
al.2013). A detailed study of the problem together with a thorough testing of methods on multiple real datasets is presented in Saganowski et al. (2015).
Immunization strategies
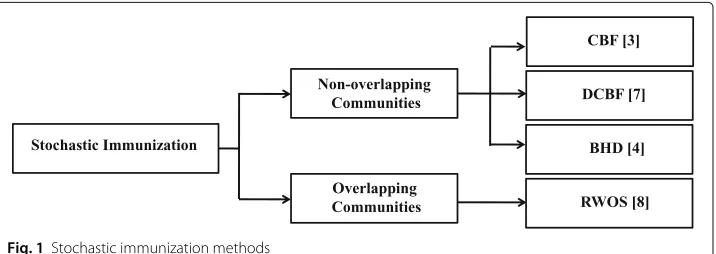
been proposed. They can be classified into two groups according to the commu-nity structure model they use. The first group of strategies uses the non-overlapping community structure features. The second group is based on the overlapping commu-nity structure properties. The most widely known stochastic strategies together with deterministic strategies using advantageously the community structure are recalled in this section.
Stochastic strategies
Stochastic immunization strategies focus on using information at the node level. They identify target nodes without knowledge of the full network structure. That makes them computationally more efficient and more practical in large networks as compared to the deterministic strategies. Roughly speaking, these strategies target either the nodes linking the communities (Bridges) or the highly connected nodes (Hubs) or the overlapping nodes using little or no information about the network topology.
Some researchers assume that bridges are the most influential spreaders. These nodes can propagate the epidemic to the entire network because of their connectivity with various modules. They have then a global influence on the whole network and their immunization can prevent the effective diffusion to the different parts of the network. The Community Bridge FinderCBF (Salathé and Jones2010) is an immunization strat-egy aiming to target the bridge nodes. It is based upon a random-walk algorithm. The community hubs are also believed to have a strong local influence in their communi-ties. Based on this assumption the Degree Community Bridge FinderDCBF(Gong2014) and the Bridge-Hub Detector BHD (Gong et al. 2013) are two immunization strate-gies, which targets bridge nodes with high connections for immunization. The selected bridge nodes in this case play also the role of hubs. The former strategy is a varia-tion of theCBF, while the latter one is based on expanding friendship circles during a random walk. Other researchers try to highlight the importance of overlapping nodes in terms of the epidemic spreading dynamics. Random-Walk Overlap SelectionRWOS
strategy (Taghavian et al.2017) is proposed to select the overlapping nodes according to a random-based algorithm. These key nodes can play a major role in epidemic dif-fusion due to their membership to multiple communities. In the following, we present a brief overview of the three stochastic strategies based on non-overlapping commu-nity structure and the one tailored for networks with overlapping commucommu-nity structure (refer to Fig.1).
Algorithms
Community Bridge Finder (CBF)
Immunization interventions of highly connected individuals are not always enough to protect networks from large-scale epidemics. Indeed, targeting individuals bridging com-munities is sometimes more effective than simply immunizing nodes with high degrees. The goal of the CBF strategy (Salathé and Jones 2010) is to identify nodes acting as bridges between communities. This strategy is based on random walks. It works as follows:
Step 1. Select a random nodevi=0.
Step 2. Follow a random walk with the condition that a node has not been visited by the random path before.
Step 3. At each nodevi>=2, check if it is connected to more than one visited nodes. If
there is just one connection,vi−1is considered as a potential bridge.
Step 4. Select two random neighboring nodes ofviother thanvi−1. If both nodes have
no connections to the previously visited nodes, the nodevi−1is then marked as a bridge
and it is immunized. Otherwise, a random walk is taken back atvi−1.
This strategy has been compared to the Acquaintance strategy defined as follows. At each step, a node is picked at random and one of its acquaintances is randomly selected, then nodes which are picked as acquaintancesntimes are immunized. Extensive experi-ments were conducted on synthetic and real-world networks using SIR epidemic model. Results show that CBF outperforms mostly the Acquaintance strategy. Its best perfor-mance is obtained in networks with strong community structure (few inter community links).
Degree Community Bridge Finder (DCBF)
DCBF (Gong2014) is a variant of the CBF strategy. The goal of this strategy is to target bridges with large amount of connections. This strategy incorporates the same steps as described in the CBF algorithm. The difference is that nodes are not ran-domly chosen among all the possible nodes during the random walk, but according to their degree from high to low. Two additional checks are also implemented in DCBF to decrease the computation time of the algorithm. First, the number of nodes vis-ited in a running path is kept at the length of ten. Also, the number of visits by all random paths is recorded for each node. The node is immunized when the number of visits k is equal to a certain number (k = 2). DCBF has been tested on syn-thetic networks with various modularity values. After running the SIR epidemic model simulations, results demonstrate that DCBF performs better than the CBF algorithm in controlling outbreaks. Its performance gets higher in networks with strong com-munity structure (when the modularity is very high Q > 0.84). Indeed, outbreaks are restricted locally inside communities in this case. DCBF could then target highly connected nodes in local communities, while CBF is able to identify only the bridge nodes.
Bridge-Hub Detector (BHD)
Communities are characterized by the heterogeneity in the connections among nodes bridging various communities. Based on this idea, BHD (Gong et al.2013) aims to identify bridge hub nodes as targets for immunization. It is based on expanding friendship circles of visited nodes and works as follows
Step 2. Follow a random walk with the condition that a node has not been visited by the random path before.
Step 3. Letvi>=2be the node visited afteristeps, andfibe the set of its neighbors. The
nodevi is considered as an immunization target if there is at least one node that does
not take part of the setFi−1and that it not linked to any node in Fi−1, whereFi−1 = f0f1f2...ft−1. Otherwise, the random walk moves on fromvi, and the friendship
circle will be updated toFi=Fi−1fi.
Step 4. Among the nodes infi, one nodevH is randomly picked for immunization that do not belong and cannot be connected back toFi−1.
At the end of this procedure, a pair of nodes, a bridge and a bridge hub nodes are selected for immunization. This is via friendship circles of randomly visited nodes. BHD was tested on simulated and empirical data constructed from Facebook network of five US universities using the SIR model. It results in a smaller epidemic size as compared to the Acquaintance and CBF strategies. In terms of computational time, Acquaintance is the fastest algorithm, followed by CBF and BHD.
Random-Walk Overlap Selection (RWOS)
Overlapping nodes do not necessarily have high centrality measures, yet, they can have a major effect in spreading epidemics from one community to another. Indeed, these nodes have access to multiple communities in the network. The RWOS strategy (Taghavian et al.2017) is designed to target the overlapping nodes for immunization according to a random walk. It can be specified as follows:
Step 1. Define the list of overlapping nodes.
Step 2. Select randomly a node of the network and run a random walk.
Step 3. Each visited node is nominated as a target for immunization if it belongs to the overlapping set of nodes. This process continues until reaching the desired immunization coverage.
This strategy targets highly connected overlapping nodes for immunization. It is based on the idea that the probability of visiting any node in a random path is proportional to the node degree. RWOS has been investigated on synthetic and real-world networks. The standard SIR epidemic model was run on these networks. Results show that RWOS outperforms CBF and BHD strategies in terms of the epidemic size. It performs some-times even better than membership strategy (where nodes are immunized according to the number of communities they belong to). Moreover, its performance gets better in networks with strong community structure and higher membership values. Note that it uses more information about the community structure. Indeed, one needs to know the overlapping nodes.
Discussion
The stochastic strategies have been investigated on both simulated networks (Lanci-chinetti et al.2008; Orman et al.2013) with different community structure, and real-world networks. Overall, results show that stochastic strategies based on the community struc-ture are more efficient than the standard stochastic strategies. Results show that generally
Consequently, immunizing bridges is not an effective way to control the spreading of epidemics. That explains the poor performance ofCBFin networks with strong commu-nity structure.DCBFmay at least identify relatively highly connected bridge nodes which can cause extensive spreading of epidemics. In addition,BHDis capable of identifying bridge nodes with high number of inter-community links. Therefore, the effectiveness of
BHDcan be attributed to the better identification of the influential spreaders as com-pared to the CBF and DCBF. All these three strategies do not take into account the overlaps between communities. On the other hand,RWOSstrategy which immunizes overlapping nodes results in smaller epidemic size as compared to the other stochastic strategies in all the networks. Furthermore, its performance enhances while increasing the membership degree of overlapping nodes. Thus, overlapping nodes play a major role in spreading infection from one community to another even if they are not necessarily highly connected.
Deterministic strategies
Deterministic strategies target nodes by ranking them following a given centrality mea-sure. The centrality of a node reflects its ability to propagate the disease. The procedure of deterministic strategies can be specified as follows
Step 1. Select a given centrality measure.
Step 2. Compute the centrality for each node of the network.
Step 3. Rank nodes in decreasing order from the most to the less central node. Step 4. Target a proportion of nodes with high ranks for immunization.
These strategies require the knowledge of the whole network because all the nodes are involved in the process. We now give an overview of some recent deterministic strategies designed for modular networks. They are classified into different categories according to their immunization goals (refer to Fig.2).
Non-overlapping community structure
A plethora of deterministic immunization strategies are developed to identify vital nodes in networks with community structure. They can be classified into three categories (global, local, global and local) in networks with non-overlapping structure. The first type of strategies highlights nodes with outer connections towards foreign communities. They target bridge nodes, which can have a significant global influence on other nodes of the network. The second category tends to identify nodes with the highest local influence in their own communities. Some strategies target hubs for immunization because of their strong influence on nodes of their neighborhoods, while others immunize nodes located in the core of the community. The strategies belonging to the third category immunize both types of nodes. They select nodes having both local and global influence in the network.
Global strategies
Fig. 2Deterministic immunization methods
to highlight the bridge nodes between communities. It is based on an approximated calculation of the eigenvector centrality of the coarse-grained network (called also the meta-graph). In this network the communities are represented simply by nodes, and the links are weighted by the number of links between the two communities. It can be specified as follows.
on the coarse-grained network. Where each community is represented by a single node, and edges are weighted by the number of links shared by two neighboring communities. It targets nodes maximizing the following measure
Modi=2uK˜ I=K
dkIuI˜ (11)
Whereu˜K represents the eigenvector corresponding to the Kthcommunity. dkI is the
number of inter-community links that exist between node k and the Ith community. The first term of this measure (i.e., 2u˜K) quantifies the importance of the community
that the nodekbelongs to, whereas the second quantity (i.e.,I=KdkIu˜I) measures its
connectivity to other important communities. After immunizing all the bridge nodes, the remaining nodes are ranked according to their degree. This method preferentially targets globally important nodes having important inter-community links rather than commu-nity hubs that are locally important. The effectiveness of the Mod strategy is tested by applying it on synthetic and real-world networks of various nature. Results show that it is in most cases more efficient than Degree, Betweenness and Ress strategy (an eigenvector based strategy (Restrepo et al.2008)) in networks with modular structure.
Boundary Vicinity Algorithm (BVA):Different from the above method, Mantzaris (2014) proposed the Boundary Vicinity AlgorithmBVA. This strategy ranks nodes accord-ing to their vicinity to bridge nodes (boundary nodes) of each community. It is defined as follows
Step 1. Define the set of communities of the network.
Step 2. Extract the set of bridges which connects communities.
Step 3. Run a number of random walkers of a chosen fixed number of steps from each bridge node. Then, the number of visits to each node is counted.
This measure quantifies the ability of a given node to propagate epidemics across bridges towards different communities. Using the SI epidemic model, the authors show that theBVAstrategy outperforms the Betweenness-based strategy in terms of the epi-demic size.
Yoshida et al. proposed the Inverse Vector Density (IVD) (Yoshida and Yamada2017). It is another immunization strategy that do not require the community labels of nodes. This is by constructing a vector representation of nodes based on the modularity quality measure. TheIVDimmunizes nodes with small number of nearby node vectors which are identified as bridges. This strategy performs better than the Betweenness-based strategy in terms of the Largest Connected Component (LCC). Bridgeness strategy is proposed by Jensen et al. Jensen et al. (2015). It is based on the Betweenness centrality while con-sidering only shortest paths between nodes belonging to different communities. This strategy highlights nodes that connect different regions of a network. Using both syn-thetic and real-world networks, the Bridgeness strategy is shown to be globally more effective than the Betweenness-based strategy to identify bridge nodes. Different from the above methods, the Number of Neighboring Community (NNC) (Ghalmane et al.
nodes with high number of neighboring communities are able to disseminate information across the entire network. Experimental results show that the Number of Neighboring Communities strategy outperforms the Degree and the Betweenness-based strategies in terms of the epidemic size. It performs also better than some community-based strate-gies such as the Community Inbetweenness, CbM strategies (see their definition in “Global and local strategies” section). This is particularly true in networks with a com-munity structure of medium strength (i.e., when the proportion of intra-comcom-munity links is of the same order than the proportion of inter-community links). M. Kitromilidis et al. (2018) propose to redefine the traditional centrality measures to characterize the influ-ence of Western artists. This global strategy is based on computing the standard centrality measures by considering only the inter-community links of the networks. Their idea is based on the fact that influential artists usually have connections beyond their artistic movement. The Global Betweenness and Closeness strategies are compared to their clas-sical versions. They were tested on a painter collaboration network. Experimental results show that the Global strategies allow to highlight some influential nodes who might have been missed as they do not necessary rank high in the standard measure based strategies.
Local strategies
Hubs represent the high degree nodes with the larger amount of connections that greatly exceed the average. They are a consequence of the scale-free degree distribution observed in real-world networks. In modular networks, such nodes can be found in all the communities. They have then a strong local influence on the nodes of their own communities. Newman proposed the Community centrality (Newman 2006a) to identify nodes that plays a central role inside communities in terms of the number of connections. These nodes are responsible for the maximum information flow inside their communities. He et al. proposed the Super node strategy (He et al.2015) that can immunize nodes with the highest intra-community links (or with highest k-core index) belonging to various communities. Both strategies are described as follows:
Community centrality (CC):Newman proposed a slightly different formulation of the modularity. The Community centrality (Newman2006a) is derived from the eigenvectors of the modularity matrix. The modularity matrix is divided into two projections. The first dimension represents the positive eigenvectors of the modularity matrix while the second dimension represents the negative ones. Thus, the modularity can be written in terms of these vectors as follows:
Q= c
k=1
|Xk|2−
c
k=1
|Yk|2 (12)
wherecis the number of communities.XandYare the community eigenvectors in both dimensions. Theithnode in the communitykis represented by two vectorsxiandyi(the
ithrows ofXkandYkrespectively).
The magnitude of a node vector|xi|specifies how central the nodeiis in its community
in terms of the number of connections. Thus, the nodeihas a large positive contribution to the modularity when this measure is large. On the other hand, a higher value of|yi|
It measures the strength with which a given nodei is assigned to its community. This measure has been tested in a co-authorship network between scientists. Results show that it is not well correlated with the degree centrality. Moreover, some nodes with high Community centrality measure have relatively low degree. However, they have more con-nections with nodes of their communities. Thus, nodes with high Community centrality value play a central role in the spreading process in their local neighborhood.
Super node strategy:This strategy starts by ranking communities in decreasing order according to their size. After that, the node with the largest inner degree is selected from the largest community. Then, the node with the highest inner degree in the second largest community and which do not have any connections with the previous communi-ties is selected as the second spreader. Note that there is only one previous community for the second spreader. After visiting all the communities of the network, this process is restarted again until achieving the desired number of immunized nodes. The goal of this method is to select multiple spreaders from different communities in a balanced way. SIR simulations are performed in both synthetic and real-world networks. Experimental results show that the Super node strategy results in a smaller epidemic size as compared to the Degree-based strategy. Additionally, Super node strategy proved also its efficiency while using the k-shell decomposition method in the process of finding the influential spreaders in each community.
Global and local strategies
The immunization strategies in this category tend to target nodes that have both local and global influence. They combine the various aspects of the previous strategies to select the most influential nodes in the network. These nodes are supposed to be the main spreaders in their communities which can also disseminate the epidemics towards other modules of the network. Community Inbetweenness (Chan et al.2009) together with theCbCstrategy (Zhao et al.2015) select the Hub-bridge nodes for immunization. They can be defined as follows:
Community Inbetweenness strategy:The classical betweenness needs to solve the shortest path problem of all pairs, what makes it unfeasible in large networks. Community Inbetweenness strategy (Chan et al.2009) is proposed to solve this problem. It is based on an entropy-based measure which approximates the betweenness centrality. It ranks nodes based solely on community information. This strategy evaluates node importance accord-ing to the proportion of its surroundaccord-ing links in addition to the external links connectaccord-ing it with foreign communities. The Community Inbetweenness centralityCCI is defined as
follows:
CCI(i)=ki
c∈C
pi→clog
1
pi→c
(13)
Whereki is the degree of nodei.pi→c is the proportion of links connecting nodeito
this strategy is more efficient than the betweenness based strategy in terms of computa-tional performance. Both strategies are also tested with the SIR model in Ghalmane et al. (2018) to compare their epidemic size. Results show that Community Inbetweenness per-forms almost as well as the betweenness in networks with strong community structure. It is however more efficient in networks with loose community structure.
Community-based Centrality ((CbC):This strategy selects nodes for immunization according to their links characteristics and the size of their communities. It targets nodes that have a big impact in their communities and that can spread epidemics to nodes from other communities. It is based on a measure that evaluates the importance of nodeivia the following formula:
CbCi= m
c=1 dicSc
N (14)
Wheredicis the number of links between nodeiand other nodes in communityc,mis
the number of communities in the network, Scis the number of nodes in community c, andN is the size of the network. Simulation results using the SIR model show that CbC outperforms some traditional measures such as Degree and K-shell. Moreover, CbC can also better reflect nodes importance as compared to Closeness, Betweenness and Eigenvector centralities, with much lower computational complexity.
Then, in each community one critical node is extracted using the betweenness centrality. After that, one node with the highest inter-community links is also extracted from each community. In the last step, nodes are ranked based on the sum of their shortest paths with the extracted core and bridge nodes instead of computing their shortest paths using all the nodes of the network. Experiments on synthetic and real-world networks using the SIR diffusion model demonstrate the effectiveness theGLRstrategy in comparison with the Closeness, Degree, Betweenness and k-shell based strategies. Berahmand et al. (2018) proposed the Degree and Clustering coefficient and Location strategyDCL. It immunizes the best spreaders based on a combination of the degree and the inverse cluster coeffi-cient of a given node. The latter two measures are also combined with the degree of its neighbors and the common links between the node and its neighbors to define the loca-tion of a node (whether it is in the core or the periphery of the community). This strategy allows identifying low-degree bridges and some critical hub nodes. Comparisons based on the SIR and the SI models reveal that the proposed method outperforms the well-known strategies such us the Degree, Betweenness, Eigenvector, PageRank and the k-shell based strategies. The Community Hub-Bridge strategy (Ghalmane et al.2018) is based on a linear measure. It is a weighted combination of the number of intra-community links and the number inter-community links. The first term of this measure is weighted by the size of the community. The aim of this is to prioritize the immunization of hubs located in large communities due to their big influence. The second term of the expression is weighted by the number of neighboring communities to target in priority bridges having many connections with multiple communities. According to SIR simulations performed on synthetic and real-world networks, this strategy is more efficient than the Number of Neighboring Communities, Community Inbetweenness, CBM and Comm strategies. It is particularly suited for networks with strong community structure (having a small propor-tion of inter-community connecpropor-tions). The Weighted Community Hub-Bridge strategy (Ghalmane et al.2018) is another variant of the previous strategy. It is based on a lin-ear measure weighted also by the density of the inter-community links. It is weighted such that, in networks with strong community structure, more importance is granted to bridges while in networks with loose community structure more importance is given to the local community hubs. Experimental results show that it outperforms the previous strategy namely in networks with loose community structure.
Modular centrality
obtained by removing all the intra-community links from the original network. Remain-ing isolated nodes are also removed. The local component is computed on the local graph obtained by removing all the inter-community links from the original network. The Modular centrality is computed according to the following algorithm:
Step 1. Choose a standard centrality measureβ.
Step 2. Remove all the inter-community edges from the original networkGto obtain the set of communitiesCforming the local networkGl.
Step 3. Compute the local measureβLfor each node in its own community.
Step 4. Remove all the intra-community edges from the original network to reveal the set of connected componentsSformed by the inter-community links.
Step 5. Form the global networkGg based on the union of all the connected
compo-nents. Isolated nodes are removed from this network and their global centrality value is set to 0.
Step 6. Compute the global measureβGof the nodes linking the communities based on each component of the global network.
Step 7. AddβLandβGto the Modular centrality vectorBM.
This approach allows to redefine all the standard centrality measures designed for non-modular networks to networks with non-overlapping community structure. A series of experiments have been performed on both real-world and synthetic networks using the SIR model in order to investigate the efficiency of the Modular centrality. Results show that the Local measure is more efficient in networks with strong community structure, while Global measure performs better in networks with a weak community structure. Furthermore, the measure that combines both components outperforms the local, the global and the classical measure. Recently this work has been extended to networks with non-overlapping community structure (Ghalmane et al.2019).
Discussion
to the local ones in these networks. The Number of Neighboring Communities (NNC) for instance is more efficient than the local degree and the super node strategies. The combination-based strategies, on the other hand, target both type of nodes. They are overall more efficient than both local and global strategies in networks with different structures. Some strategies such asCbM,CBHandWCBHoutperform the super node, the local and the global betweenness and degree-based strategies. Furthermore,WCBM
has proven to be more efficient than some other combination-based strategies (e.g.,
Comm,CbMandCbC). This strategy uses different level of information about the topo-logical properties of the community structure such as the size of communities, the num-ber of neighboring communities of each node and the proportion of inter-community links of each community. Thus, it uses more information about the community struc-ture as compared to the other strategies. Therefore, the performance of the immu-nization strategies increases when more information about the community structure is used.
These assumptions led to the introduction of theModular centrality, which is a bi-dimensional vector measuring both local and global influence of each node in the network. This approach investigated for some classical centrality measures (Degree, Betweenness, Closeness and Eigenvector) shows that the Local measure is more effi-cient in networks with strong community structure, while the Global measure performs better in networks with loose community structure. Moreover, the performance of rank-ing strategies combinrank-ing both components of the Modular centrality is more efficient than using only one component. Furthermore, better results were even obtained by using more information related to the topological properties of the community structure. These experimental results of theModular centralityconfirm the ones obtained with the alternative deterministic strategies.
Overlapping community structure
Communities can often overlap in real-world networks. In this case, nodes can belong to more than one community at once. Identifying such overlapping nodes is crucial for con-trolling the epidemic spreading. These nodes can extend the epidemic diffusion across all communities to which they belong. Some strategies select these nodes for immunization. Hebert et al. Hébert-Dufresne et al. (2013) proposed a straightforward strategy which directly counts the membership number of each node in the network. Chakraborty et al. (2016) analyze how immunization based on the membership number of overlapping nodes affect the largest connected component size. OverlapNeighborhoodON(Kumar et al.2018) is another strategy that targets the neighbors of the overlapping nodes for immunization. It is based on the idea that overlapping nodes are connected to many hub nodes located in the different communities to which they belong. The Membership and OverlapNeighborhood strategies are defined as follows:
OverlapNeighborhood strategy (ON):This method (Kumar et al.2018) selects imme-diate neighbors of overlapping nodes as the top influential spreaders. Its main objective is to select the most highly connected nodes using a limited amount of information at the community level. Indeed, there is a high probability that nodes with very high connec-tions are neighbors to overlapping nodes since they are part of more than one community. This is also due to the power-law degree distribution in real-world networks. The simu-lation results revealed that this method outperforms CBF, BHD and RWOS methods. It performs better or as good as Degree and Betweenness centrality based methods using less information about the overall network.
The Overlapping constraint coefficient (OC) (Wei et al. 2018) is an immunization strategy that highlights the influential nodes based on the multiplication of two measures. The first measure represents the membership of a given node which quantifies its propa-gation capacity. So, the more communities a node belongs to, the more communities the node can influence. The second measure represents the network constraint coefficient of the node, which quantifies its propagation speed in the communities. SIR simulations demonstrate that the Overlapping constraint coefficient strategy outperforms the Degree, Betweenness, Closeness and the k-shell based strategies. The Influence Maximization based on Label Propagation Algorithm (IM-LPA) (Zhao et al.2016) is another strategy designed for networks with overlapping communities. It is based on an improved version of the Label propagation algorithm (Raghavan et al.2007). It operates in two phases: the seeding phase and the label propagation phase. At the beginning of the seeding phase, the set of seed nodes is empty and all the nodes of the network are considered as candi-date nodes. After that, the node with the highest degree is added to the seed set and all its neighbors are removed from the candidate node set. This process is repeated until the candidate node set becomes empty. This phase guarantees that the selected seed nodes are independent from each other. In the label propagation phase, each seed node is asso-ciated with a unique label. Then, the labels expand from the seed nodes until covering all the other nodes of the network. Nodes may have several labels. Thus, they can belong to several communities. At the end of this process, the centrality of each node can be mea-sured by the number of nodes associated to its label. Nodes with the highest measure can propagate the epidemics to a large set of nodes of their communities. The Inde-pendent cascade diffusion model (IC) was performed on both synthetic and real-world networks. Results demonstrate the efficiency of theIM-LPAstrategy in identifying the influential spreaders as compared to the Degree, Betweenness, Closeness, K-shell and PageRank-based strategies.
Summary and conclusions
In complex networks, community structures are widely observed. Despite the fact that this property is well-recognized, it is very often ignored when it comes to use it in order to develop new techniques in the field. In this paper, we consider three hot topics linked to the community structure of complex networks. First one focuses on the fundamental issue of community detection in static networks. The second one discusses the same issue but for temporal networks. Finally, the third one examines immunization strategies designed for modular networks.