R E S E A R C H
Open Access
Evaluating different strategies for integration
testing of aspect-oriented programs
Wesley Klewerton Guez Assunção
1*, Thelma Elita Colanzi
2, Silvia Regina Vergilio
1and Aurora Trinidad
Ramirez Pozo
1Abstract
Background: The determination of an order for integration and testing of aspects and classes is a difficult
optimization problem. This order should be associated to a minimal possible stubbing cost. To determine such order, different approaches exist. For example, traditional approaches are based on Tarjan’s algorithm; search-based approaches are based on metaheuristics, usually genetic algorithms (GA). In addition to such approaches, in the literature, there are different strategies to integrate aspect-oriented software. Some works suggest the integration of aspects and classes in a combined way. Other ones adopt an incremental strategy. Studies evaluating the approaches show that the multi-objective one presents better solutions. However, these studies were conducted applying only the combined strategy.
Methods: In this paper, we present experimental results comparing both strategies with three different approaches: the traditional one, a simple GA-based, and a multi-objective one.
Results: The results show better performance of the multi-objective approach independently of the strategy adopted. A comparison of both strategies points out that the incremental strategy reaches a lower cost in most cases, considering a number of attributes and operations to be emulated in the stub.
Conclusion: It seems that with Incremental+, the best choice is the multi-objective approach. If the system is very complex, PAES seems to be the best MOEA.
Keywords: Aspect-oriented software; Integration testing strategies; Evolutionary algorithms
Background
The test of aspect-oriented (AO) programs is an impor-tant activity, which constitutes an active research topic, investigated by many authors. The goal is to extend the knowledge acquired in the object-oriented (OO) context and to introduce specific test criteria for the AO software [1-4]. Similarly to the OO software, the AO testing should be conducted in different phases [1]. In the integration test phase, the focus is on the interaction between the mod-ules. In the AO context, a module can be either a class or an aspect, and new kinds of faults appear, as well as, some new difficulties.
The main difficulty is to make sure that dependencies between aspects and classes are tested adequately [5]. To
*Correspondence: [email protected]
1Computer Science Department, Federal University of Paraná (UFPR), Paraná, Brazil
Full list of author information is available at the end of the article
test such dependencies different strategies are found in the literature. Some authors suggest incremental strate-gies that first test the classes [4,6]. Aspects are integrated in a second step, in an interactive way. The main moti-vation for this strategy is to reduce the complexity of the testing process. Other strategies generate sequences to test the interactions among classes and aspects in a com-bined strategy [7]. This seems to be a more practical strat-egy, since some related modules are generally developed together. However, in the application of both strategies, a problem exists, known as the integration and testing order problem. This problem refers to the determination of an integration order that minimizes the cost associ-ated to stubs construction. Stubs simulate the resources that are needed for the modules being tested. Their pur-pose is to provide canned answers to calls made during the test, allowing the integration and test of modules, which are dependent on other non-available modules. In the
AO context, this problem is called the class and aspects integration and test order (CAITO) problem.
To solve the CAITO problem, most proposed solutions use a graph to represent the dependencies between the modules. The graph, named the object relation diagram (ORD), was extended from the OO context to repre-sent aspects and other kinds of dependencies [7,8]. In most systems, there is a dependency relation between two modules. When dependency cycles exist, it is neces-sary to break the dependency and to construct a stub to emulate the behavior of the required module. The study reported in [9] shows that it is very common to find complex dependency cycles in Java programs. In the AO context, it is common to find crosscutting concerns that are dependent on other crosscutting concerns, implying dependency between aspects, and between classes and aspects [7]. Hence, to reduce stubbing costs, it is impor-tant to determine the best sequence for integration and testing of classes and aspects. Determining such sequence is not a trivial task, because different factors influence on the stub creation, such as the number of attributes to be emulated, number of operations, number of types of return, and so on.
To break the cycles and establish the test order, different algorithms have been used. The traditional approaches are based on Tarjan’s algorithm [7,8]. Most recent approaches are search based and use metaheuristics such as genetic algorithms (GA) [10]. The approaches based on multi-objective and evolutionary optimization algorithms have presented promising results [11-13]. Such approaches allow the generation of more adequate solutions consider-ing real constraints and diverse factors that may influence the integration and testing order problem. However, the search-based approaches have not been evaluated with different integration strategies proposed in the literature. In the works [11-13], the aspects and classes are integrated in a combined way. Ré et al. [7] evaluated four strategies: Combined, Incremental+, Reverse and Random, using only the approach based on Tarjan’s algorithm. In their evaluation, the strategies Combined and Incremental+ obtained better results than the others.
Methods
Motivated by these facts and to better evaluate the inte-gration strategies, in a previous work [14], we present results from the strategies application with traditional and evolutionary search-based approaches. Three algorithms were used: Tarjan’s algorithm, a simple GA, and the multi-objective algorithm NSGA-II [15]. The strategies were compared according to the number of stubs generated, of attributes, and of operations necessary to emulate the stub behavior. Following up on our research, this paper extends our previous work by revisiting the results pre-sented in [14] and by adding in the comparison of two
other multi-objective algorithms: SPEA2 [16] and PAES [17]. Since the multi-objective approach presents better results, this extension allows the evaluation of different multi-objective algorithms to solve the problem consider-ing both strategies. Moreover, to know which algorithm is more suitable to solve a particular problem is a ques-tion that needs to be answered by means of experimental results. Those chosen are well-known GA-based algo-rithms that implement different evolution mechanisms to be compared. In this way, the main research questions addressed in this paper are:
• RQ1: How are the results of the Incremental+ and Combined strategies? It is important to know, in a general case, what strategy presents lower costs related to the number of stubs, and global stubbing costs, related for example to the number of attributes and operations to be emulated. In addition to the general case, it is also important to investigate the performance of each strategy considering particular cases, i.e., system characteristics and used algorithms (or approaches).
• RQ2: How is the performance of each algorithm (or approach) considering both strategies? This aims at investigating the performance of each algorithm used with both strategies. In the case of the Combined strategy, the multi-objective algorithms presented the best results [11,12]. Whether such result is also valid for the Incremental+ strategy, how are the impacts of both strategies in the performance of the three evaluated multi-objective evolutionary algorithms (MOEAs)?
The paper is organized as follows: Section ‘Integration testing of classes and aspects’ reviews approaches and strategies for the integration of aspects and classes, as well as, related work. Section ‘Multi-objective evolutionary algorithms’ describes main concepts about GAs and the multi-objective algorithms used in the evaluation. Section ‘Evaluation description’ describes the evalua-tion conducted: systems, strategies, and algorithms used. Section ‘Results and discussion’ presents the results, which are analyzed to answer the research questions posed above and discusses some threats to validity of our work. Section ‘Conclusions’ concludes the paper with our final remarks.
Integration testing of classes and aspects
ORD was extended to represent AO characteristics [8]. An example of extended ORD is presented in Figure 1, extracted from [7]. In the left side of the figure are the vertices representing only class and their relations; the extended part is on the right, representing the aspects and the new dependency relations introduced by Ré and Masiero [7]. The following new relationships are possible:
• Crosscutting association (C) represents the association generated by a pointcut with a class method or other advice. In Figure 1, it is illustrated between the aspectBillingand classCall; • Dependency (U) is generated by a relation between
advices and pointcuts, and between pointcuts; • Association dependency (As) occurs between objects
involved in pointcuts. This is shown in Figure 1 by the relationship betweenTimingandCustomer; • Inter-type declaration dependency (It) occurs when there are inter-type relationships between aspects and the base class. For example, an aspect Aa declares that class A extends B. In the example, there is this kind of dependency betweenBillingandLocal;
and amongMyPersistentEntities,
PersistentRoot andConnection;
• Inheritance dependency (I) represents inheritance relationships between aspects or among classes and aspects, as it is observed by the aspects
PersistentEntitiesandMyPersistent Entitiesin Figure 1.
We can see in the picture the existence of dependency cycles, for instance, betweenTimingandBilling. This
is a situation where one of the dependencies must be broken to allow the integration testing. For the broken dependency, a stubais required.
To clarify the notion of stub, we present below an exam-ple extracted from [20]. We need to integrate and test the aspect TimerLog whose implementation is shown in Listing 1.TimerLogdepends on the aspectTiming and the class Timer (Figure 1). However, in the test order,TimingandTimerare not available yet. So, stubs for both are required to perform the test. TimerLog depends onTimingbecause it crosscuts two advices that call the methods start() and stop()from Timer. TimerLog depends on Timer because the class is affected by the pointcuts, and the aspect accesses the attributes from the class.
Listing 1 Aspect TimerLog
1 public aspect TimerLog {
2 after(Timer t) returning (): target(t) && call(* Timer.start()){
3 System.out.println("Timer started: " + t.startTime) ;
4 }
5 after(Timer t) returning (): target(t) && call(* Timer.stop()){
6 System.out.println("Timerstopped: " + t.stopTime) ;
7 }
8 }
The stub for the aspect Timing is presented in Listing 2. It emulates two advices and one inter-type dec-laration of an attribute. Listing 3 shows the stub for the classTimer, emulating two attributes and three methods.
Listing 2 Stub for the Aspect Timing
1 public aspect Timing {
2 after(Connection c) returning() : Billing.initBilling(c){
3 getTimer(c).start();
4 }
5 after(Connection c) returning() : Billing.endBilling(c){
6 Customer c1 , c2 ;
7 getTimer(c).stop();
8 c1 = c.getCaller();
9 c1.totalConnectTime += getTimer(c).getTime();
10 c2 = c.getReceiver();
11 c2.totalConnectTime += getTimer(c).getTime();
12 c1.save();
13 c2.save();
14 }
15 public Timer Connection.timer =
new Timer();
16 }
Listing 3 Stub for the Class Timer
1 public class Timer {
2 public long startTime;
3 public long stopTime;
4 public void start() {
5 startTime =
System.currentTimeMillis();
6 }
7 public void stop() {
8 stopTime =
System.currentTimeMillis();
9 }
10 public long getTime() {
11 return stopTime - startTime;
12 }
13 }
Aiming at reducing the number of required stubs, dif-ferent approaches have been used to break the cycles and to establish the test order. These approaches are presented in the next subsections. They are divided in two groups: (1) approaches that use graph algorithms and (2) approaches that use search-based algorithm. Fur-thermore, subsection ‘Integration strategies’ presents the integration strategies for the AO context.
Traditional approaches
Traditional approaches [7,8] are based on Tarjan’s algo-rithm [21]. The algoalgo-rithm is recursively applied in the graph for identifying the cycles. The weight of each edge in the cycle is computed based on the number of incom-ing and outgoincom-ing dependencies. The cycle is broken by removing the edge with the greatest weight. When no more cycles remain in the graph, a reverse topological order is performed to determine the test order.
These approaches usually produce solutions found in a local optimal since they do not analyze the consequences of breaking a dependency. In some cases, a minimum number of cycles does not imply a lower cost. Another disadvantage is that they need some extension to be used with other factors related to the stubbing process, such as number of attributes of a class, number of calls or distinct operations invoked, constraints related to organizational reasons, etc. A global cost is required.
Search-based approaches
To overcome the local optimal limitations of traditional approaches, similar to what happens in the OO context [22], a strategy based on GA was proposed [10]. GAs allow the use of different factors to establish the test orders by using a fitness function based on an aggregation of objec-tives to be minimized, for instance, a weighted average of number of operations and number of attributes. However, this fitness function requires the tester to adjust the weight of each objective, and the choice of the most adequate weights for the GA is a labor-intensive task for complex cases. To reduce these efforts and make the evolutionary strategy more practical for real systems, multi-objective opti-mization algorithms were applied in the AO context [12,13]. In the multi-objective optimization, the objectives to be optimized are usually in conflict, and the goal is to find a good trade-off of solutions representing a possible com-promise among them. In this way, a set of good solutions is possible. This set forms the approximation to the Pareto front (PFapprox), composed by different non-dominated solutions. Given a set of possible solutions, the solutionA dominatesB, if the value of at least one objective inAis better than the corresponding objective value inBand the values of the remaining objectives inAare at least equal to the corresponding values inB.Ais non-dominated if it is not dominated by any other solution.
The multi-objective approach presents promising results when compared with a simple GA [11]. The multi-objective algorithms generate more adequate solutions considering real constraints and diverse factors that may influence the stubbing process.
Integration strategies
costs. However, these approaches can be applied with dif-ferent integration strategies. The most used integration testing strategy for AO programs is called incremental [2,5]. This strategy tests the base program first, and then with its aspects. The incremental strategy presents some advantages. It is easier to implement and may also allow easy fault localization. Another strategy suggests the inte-gration in a combined way [7,8]. This strategy seems to be more practical since classes and aspects probably are tested together if both are under development.
Both strategies present points in favor and against. However, these strategies have not been compared consid-ering different algorithms for breaking cycles. The work that has the similar objective to ours is the study described in [7] and more detailed in [20]. In such study, four strategies were evaluated:
1. Combined: combines the integration of aspects and classes;
2. Incremental+: first integrates only classes and after, considers only aspects;
3. Reverse: applies the reverse combined order; and 4. Random: applies a random selected order.
The main results of the evaluation conducted are the following: (1) the Incremental+ and Combined strategies presented similar behavior, and the obtained results do not point out a best one; (2) the Reverse strategy produces many stubs, mainly stubs of classes. The authors conclude that it is not a good idea starting the integration from the aspects; (3) the Random strategy performed worse than Incremental+ and Combined strategies, and it was used only as a reference.
When comparing Incremental+ with Combined, Ré [20] states that the Combined strategy has lower integration cost than the Incremental+ strategy. Furthermore, in his study, the Combined strategy minimized the number of stubs for the three evaluated systems. Another finding of Ré is the trend of balancing between the numbers of stubs for classes and aspects when Combined is used. With regards to Incremental+, there is a trend to generate a greater number of stubs for aspects than the number of stubs for classes.
These results give us some idea of the performance of strategies. But in the evaluation of Ré and Masiero, the strategies were only applied with the traditional approach based on the Briand et al.’s approach [23] and Tarjan’s algo-rithm. The evolutionary approaches have been compared with traditional approaches and present better results [11], but the strategy used in the evaluations was the Com-bined one, considering as fitness functions the number of attributes and methods to be minimized. The existing works do not help us to answer our research questions. Section ‘Evaluation description’ describes a better com-parison of both strategies and approaches, which is the
goal of the present paper. First of all, next section con-tains a brief description of GAs and the multi-objective algorithms employed in the conducted evaluation.
Multi-objective evolutionary algorithms
Multi-objective evolutionary algorithms have been widely applied in several areas, such as Search-based software engineering [24], to solve problems with many interde-pendent interests (objectives) that must be optimized simultaneously. Variants of GA adapted to multi-objective problems were proposed. A GA is a heuristic inspired by the theory of natural selection and genetic evolution [25]. From an initial population, basic operators are applied consisting of selection, crossover, and mutation. These operators evolve the population, generation by genera-tion. Through the selection operator, more copies of those individuals with the best values of the objective function are selected to be parents. So the best individuals (can-didate solutions) will survive in the next population. The crossover operator combines parts of two parent solutions to create a new one. The mutation operator randomly modifies a solution. The descendant population created from the selection, crossover, and mutation replaces the parent population.
Three representative MOEAs that are variants of tradi-tional GAs are non-dominated sorting genetic algorithm (NSGA-II) [15], strength Pareto evolutionary algorithm (SPEA2) [16], and Pareto archived evolution strategy (PAES) [17]. Each algorithm adopts different evolu-tion and diversificaevolu-tion strategies [26]. They are briefly described below.
is chosen. New populations are generated with crossover and mutation.
SPEA2 [16] has a specific way to store the non-dominated solutions found in the evolutionary process. It maintains an external archive that stores non-dominated solutions in addition to its regular population. From the archive, the individuals for the evolutionary process are selected. For each solution in the archive and in the pop-ulation, a strength value is calculated. The strength value of a solutionicorresponds to the numberjof individuals, belonging to the archive and to the population, dominated byi. This strength value is used in the fitness function. The archive sizesis fixed; so, in some moments, the number of non-dominated solutions found can be lower or big-ger thans. When the numbernof solutions is lower than s, dominated solutions are used to fill the archive, on the other hand, ifnexceedss, a clustering algorithm is used to reducen[26].
PAES [17] is an evolutionary algorithm that works like a hill climbing algorithm. It adopts a population concept different from other evolutionary algorithm strategies, since only one solution is maintained in each generation. The strategy to generate new individuals is to use only the mutation operator, blue which what makes it perform like a local search. As the algorithm works with only one solution for generation, there is no possibility to use the crossover operator. Like in SPEA2, there is an external archive that is populated with the non-dominated solu-tions found along the evolutionary process. If the external archive size is exceeded, a diversity strategy is applied on the set of solutions in order to remove the similar solu-tions and to maintain wide the exploitation of the search space. In the literature, PAES presents promising results in comparison with NSGA-II and SPEA2 [27].
Evaluation description
This section describes the evaluation conducted to com-pare strategies and approaches and answer our research questions. Based on the results described in Section ‘Integration testing of classes and aspects’, we only selected the best strategies according to the work of Ré et al.: Combined and Incremental+. Both were applied with three approaches and different algorithms: (1) TA, the traditional one based on Briand et al.’s approach [23]
and Tarjan’s algorithm; (2) SBA, the search-based one, implemented with a simple GA and using three configu-rations of weights for the fitness function; and (3) MSBA, the multi-objective search-based approach, implemented with the algorithms NSGA-II, PAES, and SPEA2 and uses Pareto’s dominance concepts.
Our goals are to evaluate (1) each strategy according to stubbing costs, considering a general case, character-istics of the systems, and used algorithm; and (2) the impact of using both strategies in the performance of the approaches and different algorithms.
Next, we describe the experimental setting: systems evaluated, evaluation measures, how the algorithms were implemented and configured, and the quality indicators used to compare the algorithms used in MSBA.
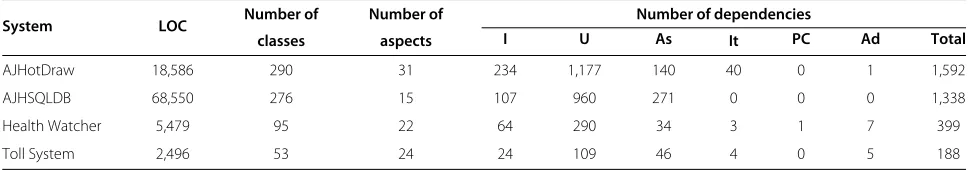
Systems evaluated
In contrast to the related work [7], in our evaluation, we used four real AspectJ systemsb, also used in our previous works [11-13]. We can see in Table 1 that two of them con-tain more than one thousand dependencies. AJHotDraw is an AO refactoring of the JHotDraw two-dimensional graphics framework. AJSHQLDB is also an AO refactor-ing of HSQLDB, which is a database manager developed in Java. The Health Watcher collects and manages pub-lic health related to complaints and notifications. The Toll System Demonstrator is a concept proof for automatic charging of toll on roads and streets.
Coupling measures
The search-based algorithms are guided by a fitness func-tion that measures the quality of the produced solufunc-tions. As we desire solutions (orders) with low cost, we use in this work two coupling measures given by the num-ber of attributes and operations to be emulated in the stub. These measures were also adopted in related works [7,12,13,22].
Considering that (1)mi andmjare two coupled mod-ules (mi depends onmj), (2) modules are either classes or aspects, and (3) the ‘operation’ term represents class methods, aspect methods, and aspect advices, we define
Number of attributes (A ) = The number of attributes locally declared inmjwhen references or pointers to
Table 1 Systems evaluated
System LOC Number of Number of Number of dependencies
classes aspects I U As It PC Ad Total
AJHotDraw 18,586 290 31 234 1,177 140 40 0 1 1,592
AJHSQLDB 68,550 276 15 107 960 271 0 0 0 1,338
Health Watcher 5,479 95 22 64 290 34 3 1 7 399
instances ofmjappear in the argument list of some operations inmi, as the type of their return value, in the list of attributes (data members) ofmi, or as local parameters of operations ofmi(adapted from [22]). This complexity measure counts the (maximum) number of attributes to be handled in the stub if the dependency were broken.
Number of operations (O ) = The number of operations (including constructors) locally declared inmj, which are invoked by operations ofmi(adapted from [22]). This complexity measure counts the number of operations to be emulated in the stub if the dependency were broken.
The stubbing complexity of an order tis based on its attribute and operation coupling. Two complexities are then calculated in the following way:
• Attribute complexity (A (t)) - The attribute complexity counts the maximum number of
attributes that would have to be handled in the stub if the dependency were broken (attribute coupling measure). This information is an input for the algorithms and is represented by a matrix AM(i,j), where rows and columns are modules andi depends onj. Then, for a given test order t and a set of d dependencies to be broken, the attribute complexity A is calculated according to Equation 1, where n is the total number of modules andk is any module included before the modulei, in test order t.
A(t)= n
i=1 n
j=1
AM(i,j);j=k (1)
• Operation complexity (O (t)) - The operation complexity counts the number of operations that would have to be emulated in the stub if the dependency were broken (operation coupling measure). This information is an input for the algorithms and is represented by a matrix OM(i,j), where rows and columns are modules andi depends onj. Then, for a given test order t and a set of d dependencies to be broken, the operation complexity O is computed as defined by Equation 2.
O(t)= n
i=1 n
j=1
OM(i,j);j=k (2)
To illustrate the use of both measures, consider the order t = [. . ., TimerLog, Timing, Timer, . . .] for the example presented in Section ‘Integration testing of classes and aspects’. This order requires stubs for the aspectTimingand the classTimer(Listings 2 and 3). It is possible to determine the values for the measuresA andOfor this fragment of order. ForA(t), the cost value
is three, composed by one attribute implemented for an inter-type declaration in the stub for the aspectTiming and two attributes implemented in the stub for the class Timer. For this same fragment, the value ofO(t)is five, composed by two advices in the stub for Timing and three methods in the stub forTimer. Hence, the cost of the fragment oftis(A=3,O=5).
Based on the measures presented above, the problem is the search for an order that minimizes the objectivesA andO.
A reverse engineering was performed to identify the existing dependencies between modules from program codes using the same parser adopted in our previous works [11,13]. A parser based on AJATO (AspectJ and Java Assessment Tool; http://homepages.dcc.ufmg.br/~ figueiredo/ajato/) was developed to do this. It uses the Java/AspectJ code as entry and returns the syntactic tree code. From this tree, the associations, uses, inheritances, advices, point-cuts, and inter-type declaration dependen-cies were identified. At the end, the parser generated as output three matrices (dependency, attributes, and operations complexities) that were used as input to the algorithms. We consider that inheritance and inter-type declaration dependencies cannot be broken, similar to related works [7,12,13,22].
Implemented algorithms
As mentioned before, our goal is to evaluate existing approaches, TA, SBA, and MSBA, with both integration strategies, Incremental+ and Combined. In this section, we describe how the algorithms of each approach were implemented. In the TA, Tarjan’s algorithm was imple-mented according to [7], using the ANNAS framework [28]. In the SBA, the implemented GAs are provided by the Bigus [29]. They were adapted to compute the fitness based on the aggregation of both coupling mea-sures. Regarding the MSBA, the multi-objective algo-rithms NSGA-II, SPEA2, and PAES were implemented by using the framework jMetal [30]. Such algorithms were chosen due to two main reasons. First of all, evolutionary algorithms, such as NSGA-II, have presented the best per-formance in the OO context, when compared with other bio-inspired algorithms, such as PACO and MTabu [31]. The second one is that they implement different evolution mechanisms, and this helps us to investigate the influence of the strategies in the search space.
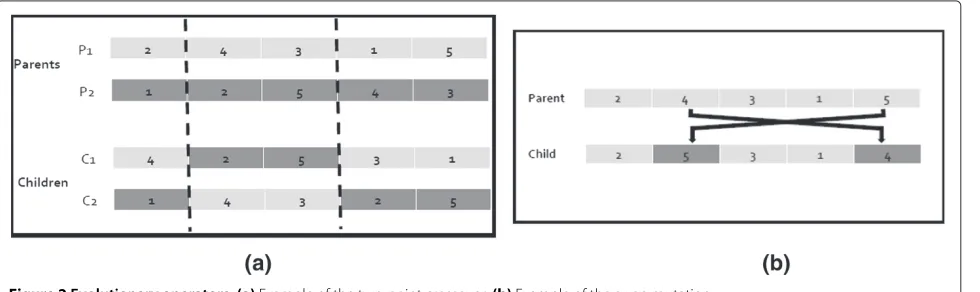
crossover. In this technique, two points are selected ran-domly, and the genes inside them are swapped in the children. The remaining genes are used to complete the solution, from left to right. Figure 2a shows an example of the two-point crossover operator using an individual with five genes. For the mutation operator, we used the tech-nique of swap mutation. In this techtech-nique, two genes are randomly selected and are swapped in the child. Figure 2b shows an example of swap mutation operator, using an individual with five genes. In the Incremental+ strategy if the randomly selected gene is a class, the gene to be swapped must be another class. In the other hand, if the gene is an aspect, it must be swapped by another aspect, in order to maintain the boundary between classes and aspects in the chromosome.
The use of crossover and mutation operators can gen-erate test orders that break the precedence constraints between the modules (dependencies I, Ag, and It). This means that base modules must precede child modules in any test ordert. The strategy adopted to deal with these constraints consists to check the test order, and if an invalid solution is generated, the module that breaks the constraint is placed at the end of the order according to the module type. For instance, in the Incremental+ strat-egy, if the module is a class, it must be placed at the end of the classes space; and analogously for aspects. The fitness function (objectives) is calculated from three matrices, inputs to the algorithms, associated to (1) dependencies between modules; (2) measure A; and (3) measure O (described in the last section).
Algorithms parameters
Tarjan’s algorithm does not have parameters to be adjusted. The parameters of the GAs and MOEAs were adjusted following our previous works [11,12], where an empirical parameter tuning was done [32]. To configure the algorithms of approach SBA, besides the parameters related to the evolution process, it was also necessary to set the weights of the measures: attribute and operation
Table 2 MOEA and GA parameters
Parameter GAA GAO GA NSGA-II SPEA2 PAES
Number of fitness evaluation
60,000 60,000 60,000 60,000 60,000 60,000
Population size 300 300 300 300 300 300
Mutation rate 0.2 0.2 0.2 0.02 0.02 0.02
Crossover rate 0.9 0.9 0.9 0.95 0.95
-Archive size - - - - 250 250
Attribute weight 1 0 0.5 - -
-Operation weight 0 1 0.5 - -
-coupling to compose the aggregated fitness function. We evaluated three combinations of weights. To verify the empirical influence of each measure in the stub con-struction we used a configuration to minimize only the attribute coupling (identified here as the configuration GA with attributes (GAA)). In this configuration, the weight of the measure operation coupling was set to zero. The other configuration minimizes only the operation cou-pling (identified here as the configuration GA with Oper-ations (GAO)). In this configuration, the weight of the measure attribute coupling was set to zero. In the third configuration (configuration GA), equal importance was given to both measures.
Table 2 shows the parameter values adopted. Each evo-lutionary algorithm was executed 30 times for each sys-tem. All the algorithms executed the same number of fitness evaluations, used as stopping criteria in order to analyze whether they can produce similar solutions when they are restricted to the same resources. Furthermore, they were executed in the same computer. At the end, the set of non-dominated solutions considering all runs was obtained for each algorithm.
Quality indicators
To compare the results presented by the MOEAs with both strategies, we used some quality indicators from
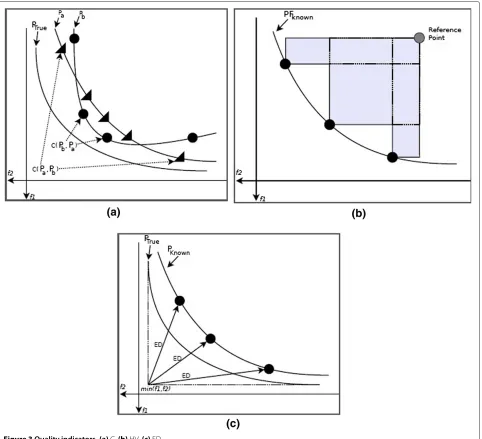
the literature [33]: coverage (C), hypervolume (HV), and Euclidean distance from an ideal solution (ED).
To calculate such indicators, some sets were obtained from the execution of the algorithms. In each run, each MOEA found an approximation set of solutions named PFapprox. Furthermore, for each MOEA, it is obtained in a set called PFknown, formed by all non-dominated solutions achieved in all runs. Considering that PFtrueis unknown, in order to calculate the indicators, we generate PFtruefor each system through the union of all solutions achieved by all algorithms, removing dominated and equal solutions, as recommended in the literature [33].
The coverage C [17] calculates the proportion of solu-tions in the Pareto front, PFa, which are dominated by PFb. The function C(PFa, PFb) maps the ordered pair of (PFa
and PFb) into the range [0,1] according to the proportion of solutions in PFbthat are dominated by PFa. Similarly, we compare C(PFb, PFa) to obtain the proportion of solutions in PFathat are dominated by PFb. Figure 3a presents an example of C indicator for a minimization problem with two objectives. For instance, C(Pa,Pb) corresponds to 0.5 because thePbset has two of its four elements dominated byPaset. Value 0 for C indicates that the solutions of the former set do not dominate any element of the latter set; on the other hand, value 1 indicates that all elements of the latter set are dominated by elements of the former set. The HV [34] indicator is considered the best met-ric to performance assessment of algorithms for multi-objective optimization problems. It measures the volume of the dominated portion of the objective space and is
of exceptional interest as it possesses the highly desir-able feature of strict Pareto compliance, i.e., whenever one approximation completely dominates another approxima-tion, the hypervolume of the former will be greater than the hypervolume of the latter. Figure 3b presents an exam-ple of HV indicator.
The determination of a solution that minimizes all objectives is difficult in multi-objective optimization problems, and decision makers usually prefer the solution that is nearest to the ideal solution. An ideal solution has the minimum value of each objective of PFtrue, consider-ing a minimization problem. Figure 3c depicts an example of ED for a minimization problem with two objectives. Therefore, here, the Euclidean distance from an ideal solu-tion (ED) is used to find the closest solusolu-tions to the best objectives [35].
Results and discussion
In this section, the results are presented and analyzed aim-ing at answeraim-ing our research questions in the followaim-ing subsections.
RQ1: strategies evaluation
RQ1 investigates the performance of each strategy accord-ing to the stubbaccord-ing costs, characteristics of the systems and used approach. The goal is to help the tester in the selection of a strategy.
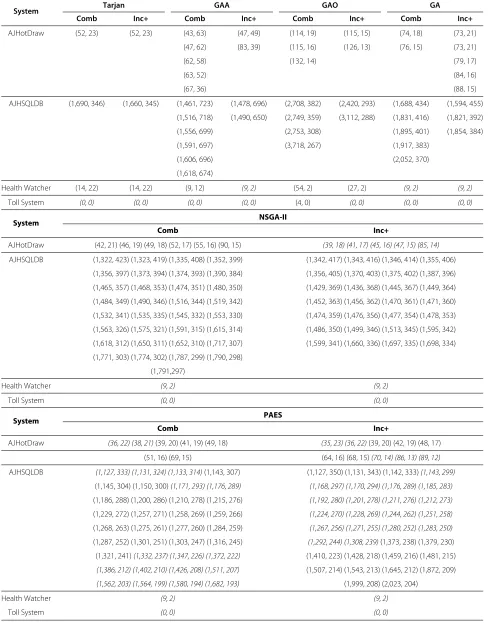
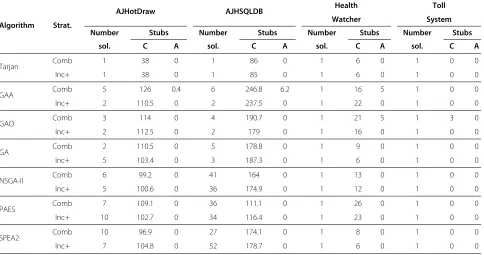
To conduct the analysis, we use Tables 3 and 4. Table 3 presents the global cost of the solutions found by each algorithm. The global cost refers to the measuresAandO, which represent how many attributes and operations need to be emulated in stubs. The solutions in italics are non-dominated considering all solutions of the algorithms.
In addition to the global cost, we estimate the number of stubs required for aspects and classes to show the impact of each strategy on the results. For each obtained solu-tion, that is a test order, we analyze how many stubs are required for classes and for aspects taking into account the matrix of dependencies of each system. Table 4 presents the mean number of stubs for classes (C) and for aspects (A) generated by each strategy and algorithm.
We can observe that a lower number of stubs does not imply a lower global cost. One stub can be more complex to be written due to the number of dependencies to be emulated inside it. For example, despite Tarjan’s algorithm having the lowest number of required stubs, the solutions achieved by it have higher global costs.
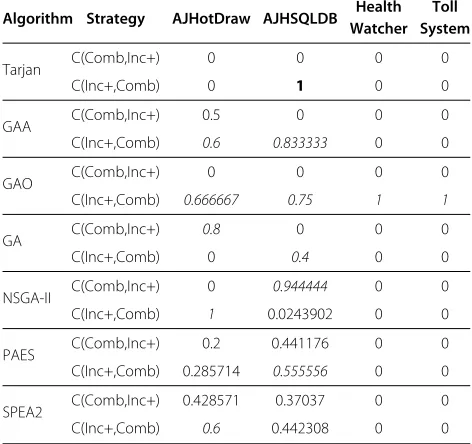
To help in the evaluation, we also use the indicator cov-erage, whose results are presented in Table 5. In this table, the value C(Comb,Inc+), between 0 and 1, represents how much the solutions of the Incremental+ strategy are dominated by solutions of the Combined strategy. Sim-ilarly, C(Inc+,Comb) represents how much the solutions
of Combined are dominated by solutions of Incremental+. Only bold values, near or greater than 0.5, are significant. Regarding the global costs (given by the coupling mea-sures), we can see in Tables 3 and 5 that the solutions obtained with Incremental+ strategy present lower costs (9 cases out of 28), considering all systems and algo-rithms. In two cases, the Combined strategy is better. In the remaining 17 cases, they are similar, the majority of them (16) being associated to the less complex systems, Health Watcher and Toll System.
Considering the cost associated to the mean number of stubs, a lower number of required stubs was achieved using the strategy Incremental+ (in 12 cases out of 28); see Table 4. The Combined strategy achieved a lower num-ber of stubs in eight cases, mainly for MOEAs and more complex systems (AJHotDraw and AJHSQLDB). Similar number of stubs were obtained for the other cases, mainly for Toll Systems.
Stubs for aspects are needed in few cases. In such cases, the stubs for aspects are required when using the strat-egy Combined. This not happens in the orders obtained by Incremental+ because the aspects are in the end of the orders. In addition, probably there are no dependency cycles between aspects in the systems evaluated.
Only GAA and GAO find orders that require stubs for aspects (Table 4). These are situations in which only one of the measures is considered. Considering a multi-objective treatment, the number of stubs for aspects tends to be 0.
In short, in a general case, Incremental+ seems to be a better choice because it requires a lower number of stubs and has lower costs, with respect to the number of attributes and operations to be emulated. This strategy also presented a lower number of stubs for aspects.
As mentioned before, Ré [20] has conducted a similar study with three systems and the traditional strategy. Our results are different from the results of his study. In our study, Combined has achieved neither the lowest num-ber of stubs nor the lowest stubbing cost. Also, Combined has not achieved a better balance between the number of stubs for classes and for aspects than Incremental+.
We observe that the system characteristics influence the performance of the strategy. As mentioned before, there is no difference between the strategies for the small systems considering global costs. The only difference was found for GAO, where Incremental+ performs better. Consider-ing the number of stubs and small systems, Incremental+ generated the lowest number in five cases whereas Com-bined achieved the lowest number in two cases for Health Watcher. In one of these two cases, Combined required a greater number of stubs for aspects, despite having generated the lowest number of stubs.
Table 3 Cost of non-dominated solutions
System Tarjan GAA GAO GA
Comb Inc+ Comb Inc+ Comb Inc+ Comb Inc+
AJHotDraw (52, 23) (52, 23) (43, 63) (47, 49) (114, 19) (115, 15) (74, 18) (73, 21)
(47, 62) (83, 39) (115, 16) (126, 13) (76, 15) (73, 21)
(62, 58) (132, 14) (79, 17)
(63, 52) (84, 16)
(67, 36) (88, 15)
AJHSQLDB (1,690, 346) (1,660, 345) (1,461, 723) (1,478, 696) (2,708, 382) (2,420, 293) (1,688, 434) (1,594, 455)
(1,516, 718) (1,490, 650) (2,749, 359) (3,112, 288) (1,831, 416) (1,821, 392)
(1,556, 699) (2,753, 308) (1,895, 401) (1,854, 384)
(1,591, 697) (3,718, 267) (1,917, 383)
(1,606, 696) (2,052, 370)
(1,618, 674)
Health Watcher (14, 22) (14, 22) (9, 12) (9, 2) (54, 2) (27, 2) (9, 2) (9, 2)
Toll System (0, 0) (0, 0) (0, 0) (0, 0) (4, 0) (0, 0) (0, 0) (0, 0)
System NSGA-II
Comb Inc+
AJHotDraw (42, 21) (46, 19) (49, 18) (52, 17) (55, 16) (90, 15) (39, 18) (41, 17) (45, 16) (47, 15) (85, 14)
AJHSQLDB (1,322, 423) (1,323, 419) (1,335, 408) (1,352, 399) (1,342, 417) (1,343, 416) (1,346, 414) (1,355, 406)
(1,356, 397) (1,373, 394) (1,374, 393) (1,390, 384) (1,356, 405) (1,370, 403) (1,375, 402) (1,387, 396)
(1,465, 357) (1,468, 353) (1,474, 351) (1,480, 350) (1,429, 369) (1,436, 368) (1,445, 367) (1,449, 364)
(1,484, 349) (1,490, 346) (1,516, 344) (1,519, 342) (1,452, 363) (1,456, 362) (1,470, 361) (1,471, 360)
(1,532, 341) (1,535, 335) (1,545, 332) (1,553, 330) (1,474, 359) (1,476, 356) (1,477, 354) (1,478, 353)
(1,563, 326) (1,575, 321) (1,591, 315) (1,615, 314) (1,486, 350) (1,499, 346) (1,513, 345) (1,595, 342)
(1,618, 312) (1,650, 311) (1,652, 310) (1,717, 307) (1,599, 341) (1,660, 336) (1,697, 335) (1,698, 334)
(1,771, 303) (1,774, 302) (1,787, 299) (1,790, 298)
(1,791,297)
Health Watcher (9, 2) (9, 2)
Toll System (0, 0) (0, 0)
System PAES
Comb Inc+
AJHotDraw (36, 22) (38, 21)(39, 20) (41, 19) (49, 18) (35, 23) (36, 22)(39, 20) (42, 19) (48, 17)
(51, 16) (69, 15) (64, 16) (68, 15)(70, 14) (86, 13) (89, 12)
AJHSQLDB (1,127, 333) (1,131, 324) (1,133, 314)(1,143, 307) (1,127, 350) (1,131, 343) (1,142, 333)(1,143, 299)
(1,145, 304) (1,150, 300)(1,171, 293) (1,176, 289) (1,168, 297) (1,170, 294) (1,176, 289) (1,185, 283)
(1,186, 288) (1,200, 286) (1,210, 278) (1,215, 276) (1,192, 280) (1,201, 278) (1,211, 276) (1,212, 273)
(1,229, 272) (1,257, 271) (1,258, 269) (1,259, 266) (1,224, 270) (1,228, 269) (1,244, 262) (1,251, 258)
(1,268, 263) (1,275, 261) (1,277, 260) (1,284, 259) (1,267, 256) (1,271, 255) (1,280, 252) (1,283, 250)
(1,287, 252) (1,301, 251) (1,303, 247) (1,316, 245) (1,292, 244) (1,308, 239)(1,373, 238) (1,379, 230)
(1,321, 241)(1,332, 237) (1,347, 226) (1,372, 222) (1,410, 223) (1,428, 218) (1,459, 216) (1,481, 215)
(1,386, 212) (1,402, 210) (1,426, 208) (1,511, 207) (1,507, 214) (1,543, 213) (1,645, 212) (1,872, 209)
(1,562, 203) (1,564, 199) (1,580, 194) (1,682, 193) (1,999, 208) (2,023, 204)
Health Watcher (9, 2) (9, 2)
Table 3 Cost of non-dominated solutions(Continued)
System SPEA2
Comb Inc+
AJHotDraw (45, 28) (47, 27) (48, 26) (50, 25) (52, 22) (46, 21) (47, 20) (49, 19) (44, 22) (58, 18)
(54, 19) (57, 18) (60, 17) (63, 16) (81, 15) (89, 16) (62, 17)
AJHSQLDB (1,369, 411) (1,384, 404) (1,405, 403) (1,407, 402) (1,383, 403) (1,396, 400) (1,397, 399) (1,398, 398)
(1,408, 400) (1,410, 399) (1,420, 395) (1,426, 392) (1,404, 394) (1,414, 393) (1,417, 392) (1,419, 387)
(1,436, 380) (1,459, 379) (1,462, 376) (1,476, 372) (1,420, 385) (1,433, 381) (1,437, 380) (1,449, 377)
(1,481, 369) (1,498, 362) (1,501, 351) (1,550, 350) (1,452, 376) (1,453, 375) (1,454, 374) (1,512, 370)
(1,553, 348) (1,559, 345) (1,562, 338) (1,578, 333) (1,515, 369) (1,518, 366) (1,528, 363) (1,531, 362)
(1,596, 327) (1,607, 326) (1,611, 325) (1,625, 320) (1,532, 361) (1,580, 358) (1,584, 356) (1,595, 355)
(1,629, 319) (1,641, 315) (1,645, 314) (1,596, 354) (1,601, 353) (1,606, 351) (1,607, 349)
(1,611, 347) (1,620, 344) (1,626, 338) (1,635, 337)
(1,636, 336) (1,639, 335) (1,650, 332) (1,660, 326)
(1,675, 323)
Health Watcher (9, 2) (9, 2)
Toll System (0, 0) (0, 0)
Such system has the largest number of LOC and their solutions are more expensive than the AJHotDraw solu-tions in terms of the number of attributes and operasolu-tions and also in the number of stubs.
Another point to be evaluated is the performance of each strategy considering a given algorithm (or approach). The strategy which is best for each approach is investi-gated by analyzing Tables 4 and 5.
Tarjan’s algorithm presents the difference only for AJH-SQLDB, where the best solution is obtained using the
Incremental+ strategy. Considering SBA, for the algo-rithm GAA, Incremental+ strategy is better for the system AJHSQLDB and slightly better for system AJHotDraw. For GAO, the Incremental+ strategy always finds the best solutions.
When using GA, the Combined strategy is better for the system AJHotDraw. And Incremental+ strategy is slightly better for the system AJHSQLDB. Regarding MSBA, for the algorithms NSGA-II, Incremental+ strategy is bet-ter for the system AJHotDraw and Combined strategy is
Table 4 Mean number of stubs for classes and aspects
Algorithm Strat.
AJHotDraw AJHSQLDB Health Toll
Watcher System
Number Stubs Number Stubs Number Stubs Number Stubs
sol. C A sol. C A sol. C A sol. C A
Tarjan Comb 1 38 0 1 86 0 1 6 0 1 0 0
Inc+ 1 38 0 1 85 0 1 6 0 1 0 0
GAA Comb 5 126 0.4 6 246.8 6.2 1 16 5 1 0 0
Inc+ 2 110.5 0 2 237.5 0 1 22 0 1 0 0
GAO Comb 3 114 0 4 190.7 0 1 21 5 1 3 0
Inc+ 2 112.5 0 2 179 0 1 16 0 1 0 0
GA Comb 2 110.5 0 5 178.8 0 1 9 0 1 0 0
Inc+ 5 103.4 0 3 187.3 0 1 6 0 1 0 0
NSGA-II Comb 6 99.2 0 41 164 0 1 13 0 1 0 0
Inc+ 5 100.6 0 36 174.9 0 1 12 0 1 0 0
PAES Comb 7 109.1 0 36 111.1 0 1 26 0 1 0 0
Inc+ 10 102.7 0 34 116.4 0 1 23 0 1 0 0
SPEA2 Comb 10 96.9 0 27 174.1 0 1 8 0 1 0 0
Table 5 Coverage between strategies
Algorithm Strategy AJHotDraw AJHSQLDB Health Toll Watcher System
Tarjan C(Comb,Inc+) 0 0 0 0
C(Inc+,Comb) 0 1 0 0
GAA C(Comb,Inc+) 0.5 0 0 0
C(Inc+,Comb) 0.6 0.833333 0 0
GAO C(Comb,Inc+) 0 0 0 0
C(Inc+,Comb) 0.666667 0.75 1 1
GA C(Comb,Inc+) 0.8 0 0 0
C(Inc+,Comb) 0 0.4 0 0
NSGA-II C(Comb,Inc+) 0 0.944444 0 0
C(Inc+,Comb) 1 0.0243902 0 0
PAES C(Comb,Inc+) 0.2 0.441176 0 0
C(Inc+,Comb) 0.285714 0.555556 0 0
SPEA2 C(Comb,Inc+) 0.428571 0.37037 0 0
C(Inc+,Comb) 0.6 0.442308 0 0
better for the system AJHSQLDB. For PAES, Incremen-tal+ is slightly better than Combined for AJHSQLDB and finally, for SPEA2, the Incremental+ strategy is slightly better for AJHotDraw.
In summary, in 15 cases, there is no difference between the strategies. Using the Incremental+ strategy, the best solutions are obtained in eleven cases; eight of them give a single objective treatment to the problem (Tarjan, GAA, and GAO). Using the Combined strategy the best solutions are obtained in only two cases, where a multi-objective treatment is given to the problem (GA using an aggregation function and with the multi-objective approach).
According to the results, the Incremental+ is the best strategy to solve the problem when using traditional and search-based approaches (TA and SBA). When there is a multi-objective treatment, Combined achieves good results, too. When applying the multi-objective approach, both strategies have a similar behavior considering the context of our work.
Despite both strategies achieving satisfactory results, if the internal members of each stub are considered in the stubbing cost, a statement of Ré [20] would be con-sidered to choose one strategy. He states that if the aspects of the system under test are small and have few implemented internal members, it is possible to conjec-ture that Incremental+ will have better performance than Combined. It happens because there is a trend of the number of stubs for aspects greater than the number of stubs for classes in Incremental+, leading to a lower number of internal members to be emulated in these stubs.
RQ2: algorithms evaluation
RQ2 aims at investigating the performance of each algo-rithm with both strategies. An important answer is to know the best approach to a given strategy being used by the tester. For instance, if the tester needs to adopt the Incremental+ strategy since he/she does not have the aspects available for the test, which is the most suitable approach to be used? With respect to this question, we can also observe if a strategy influences in the performance of the algorithms, mainly the multi-objective ones.
We can see in Table 3 that MSBA presents the best cost independent of the strategy used; the solutions of NSGA-II and PAES represent the best trade-off between both objectives, with a greater number of non-dominated (italics) solutions for all systems. Health Watcher and Toll System have only one optimal cost solution. Some approaches have not found this solution (Tarjan and GAO), independent of the strategy used.
Hence, the result obtained in our previous works [11,12] is also valid for the Incremental+ strategy. We can see in Table 3 that the solutions achieved by Incremental+ for AJHotDraw and AJHSQLDB in MSBA have better trade-off between the objectives than solutions achieved by this strategy in TA and SBA.
A greater number of non-dominated solutions is obtained with the Combined strategy: regarding the num-ber of solutions, we can observe in Table 3 that the search-based algorithms find a greater number of non-dominated solutions when using the strategy Combined. An explanation for this is that the Incremental+ strategy imposes restrictions to the algorithms and this reduces the search space, decreasing, as a consequence, the number of possible solutions. GA for the system AJHotDraw is the single exception where the Incremental+ strategy found a greater number of solutions. The other exception involves the systems with a single solution, cases where there is no difference.
Since, the multi-objective approach is the best choice for both strategies; next, we evaluate which is the best MOEA. To do this, we performed a visual analysis of the obtained solutions in the search space, and use two qual-ity indicators to compare the MOEAs and strategies: HV (Table 6), and ED (Table 7). In both tables, the boldface is used to emphasize the strategy with best results for the same algorithm when differences are observed.
Table 6 Mean and standard deviation of HV
System NSGA-II PAES SPEA2
Comb Inc+ Comb Inc+ Comb Inc+
AJHotDraw 10,170.37 10,560.30 10,634.47 10,937.47 9,827.33 9,921.83
(1,054.99) (1,280.11) (1,053.59) (1,065.77) (1,084.35) (1,044.56)
AJHSQLDB 1,199,932.10 1,139,892.37 1,686,074.13 1,668,224.73 1,119,720.60 1,066,211.50
(84,475.00) (83,606.29) (47,022.52) (38,898.70) (91,758.20) (108,504.43)
Health Watcher 6,466.00 6,466.00 6,437.70 6,412.03 6,454.90 6,466.00
(0.00) (0.00) (103.69) (140.09) (45.04) (0.00)
Toll System 260.57 264.00 231.40 254.40 262.40 263.60
(13.10) (0.00) (40.48) (21.70) (8.76) (2.19)
observed. These solutions are achieved by PAES with the strategy Incremental+ and PAES with the Combined strategy. We also observe that NSGA-II with the strategy Combined is better than the NSGA-II with Incremental+ and SPEA2 with both strategies.
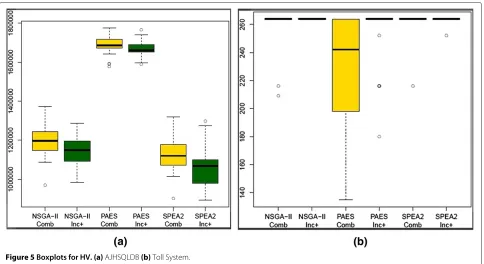
Table 6 presents the mean values of HV considering the 30 runs of each MOEA. The number between parentheses represents the standard deviation. Due to the stochastic nature of the algorithms, to perform a statistical compari-son, the Friedman test was used at a 5% significance level [36]. This test is applied to raw values, and the post-test of the Friedman test indicates whether there is any statisti-cal difference between each analyzed data set; to identify which data set has the best values, boxplot charts are used. The boxplot chart gives information about the location, spread, skewness, and tails of the data.
The Friedman statistical test does not point difference between the strategies for the same MOEA. The Friedman test points statistical difference between algorithms only for systems AJHSQLDB and Toll System. Figure 5 presents the boxplots for indicator HV for these systems. Regard-ing the system AJHSQLDB, the results achieved by PAES, independent of the used strategy, are better than NSGA-II and SPEA2. Between the other two MOEAs, NSGA-NSGA-II with Combined is better than SPEA2 with Incremental+.
In all other cases, there is no statistical difference. Now, observing the results for the Toll System, we note that NSGA-II with Incremental+ strategy and SPEA2 with both strategies are better than PAES with Combined strat-egy, and PAES with Incremental+ is statistically equivalent to all the algorithms.
Since, MOEAs return a set of solutions, we need to choose one solution to be used by the tester. Conse-quently, we use the indicator ED to observe the closest solutions to the ideal solution. Table 7 presents the results of indicator ED, the cost of the solution with the lowest ED is presented between parenthesis. The values in boldface correspond to the best result of all MOEAs.
For almost all the systems, PAES achieved the best ED solutions, with the exception of the AJHotDraw system with Incremental+ where the best was the NSGA II; how-ever, the difference with PAES solution is not great. More-over, PAES does not present different results between strategies.
There is no difference among the MOEAs in the Com-bined strategy. In the Incremental+ strategy, it is possible to note that the strategy influences the results of the MOEAs leading to a slight difference among them. PAES achieves better results than the other MOEAs in some cases considering HV and ED. However, this advantage
Table 7 The lowest distances of ED
System Ideal Strategy NSGA-II PAES SPEA2
solution lowest ED lowest ED lowest ED
AJHotDraw (35, 12) Comb 11.401754 (42, 21) 8.944272(39, 20) 18.867962 (45, 28)
Inc+ 7.211103(39, 18) 8.944272 (39, 20) 13.453624 (44, 22)
AJHSQLDB (1,127, 193) Comb 299.147121 (1,335, 408) 107.782188(1,176, 289) 325.711529 (1,369, 411)
Inc+ 310.459337 (1,343, 416) 107.070071(1,185, 283) 304.251541 (1,314, 433)
Health Watcher (9, 2) Comb 0.0(9, 2) 0.0(9, 2) 0.0(9, 2)
Inc+ 0.0(9, 2) 0.0(9, 2) 0.0(9, 2)
Toll System (0, 0) Comb 0.0(0, 0) 0.0(0, 0) 0.0(0, 0)
Figure 4Solution space.(a)AJHotDraw(b)AJHSQLDB.
of PAES in relation to the other algorithms has statistical difference in only one case.
Threats to validity
In this section, threats to the validity of our work are ana-lyzed. Regarding the construct validity, in our evaluation, a possible threat is related to the model used to represent the dependencies of the AO systems, as well as, the cou-pling measure used to calculate the stubbing costs. We know that there are other factors that could be consid-ered. To mitigate such threat, we used the model ORD, algorithms, and measures considered in the literature and similar studies [7,8,10,22]. We intend to conduct other
experiments and study other measures that can influ-ence the problem. In such experiments, other research questions should be investigated.
To mitigate reliability threats, we executed the non-deterministic algorithms 30 times, as recommended in the literature. The experiments can be repeatable since the systems are available following the same methodology. Regarding the internal validity, we also use in our analy-sis quality indicators, coverage, HV, and ED, and statistical analysis used in the literature.
The main threat of our work is related to the external validity. The number of the systems evaluated can influ-ence the generalization of the obtained results. Although,
we are using a greater number of systems than related works, the results cannot be generalized because the number of systems is still small. So, our findings can be considered as evidences about the performance of the approaches and strategies. To reduce this influence, we selected aspect-oriented systems, with different sizes and complexities, given by the number of modules and dependencies.
Conclusions
This work described results of an experimental evaluation of two different strategies, Incremental+ and Combined, for integration testing of the AO software. The strategies were evaluated with real systems and three approaches (and seven algorithms): (1) the traditional one, based on Tarjan’s algorithm, (2) the GA-based one, implemented with three different configurations of weights, and (3) the multi-objective one, implemented with three MOEAs: NSGA-II, PAES, and SPEA2.
The strategies were evaluated according to the costs, given by the number of stubs, number of attributes and operations, characteristics of the programs, and approach adopted. The performances of the algorithms used with each strategy were also compared.
In a general case, the Incremental+ strategy presented lower costs, and it is a good choice independently of the approach and system characteristics. The Combined strat-egy presents a greater number of non-dominated solution options to the tester and good performance with more complex systems and the multi-objective approach. The Combined strategy generates a greater number of stubs for aspects since they are integrated and tested together with the classes. Despite of not finding the greatest num-ber of non-dominated solutions, every time in the multi-objective approach, Incremental+ does not require the development of stubs for aspects and it achieves solutions with the lowest ED (preferred by the decision makers).
In the context of our study, the results show that the multi-objective approach is better than the other approaches independent of the adopted integration strat-egy. Given this fact, the three multi-objective algorithms were compared, considering the most complex systems. PAES achieved the best results followed by NSGA-II.
In short, it seems that the best choice is the multi-objective approach with Incremental+, since it may be more interesting for the tester to adopt a strategy that gen-erates orders with lower global cost. If the system is very complex, PAES seems to be the best MOEA.
As future work, we intend to use in further experiments other measures that affect the stubbing costs, especially of aspects. In addition to coupling measures, other objec-tives could be used, for instance, to minimize the total number of stubs, or to minimize the number of stubs for classes or aspects. New experiments with other systems should be conducted to better evaluate the influence of the
system characteristics in the performance of the strategies and approaches. Finally, further studies may include costs related to the execution of the test orders.
Endnotes
aSome works use mocks instead of stubs to simulate
dependencies in the AO context [37]. Mocks are similar to stubs, but stubs use state verification, whereas mocks use behavior verification. The adoption of stubs or mocks in the integration testing is a decision of the tester, but independently of the simulating technique used, the minimization of the required stubs/mocks is necessary.
bAJHotDraw (version 0.4): http://sourceforge.net/
projects/ajhotdraw/; AJHSQLDB (version 18): http:// sourceforge.net/projects/ajhsqldb/files/; Toll System (version 9): http://people.cs.kuleuven.be/~aram. hovsepyan/process_study.html; Health Watcher (version 9): http://ptolemy.cs.iastate.edu/design-study/.
Competing interests
The authors declare that they have no competing interests.
Authors’ contributions
All authors have contributed to the different conceptual and experimental aspects study presented in this article. All authors read and approved the final manuscript.
Acknowledgements
We would like to thank CNPq and CAPES for their financial support. This paper is an extended version of a previous work presented in LAWASP-2012.
Author details
1Computer Science Department, Federal University of Paraná (UFPR), Paraná,
Brazil.2Computer Science Department, State University of Maringá (UEM), Paraná, Brazil.
Received: 9 December 2013 Accepted: 8 January 2014 Published: 20 March 2014
References
1. Alexander RT, Bieman JM, Andrews AA (2004) Towards the systematic testing of aspect-oriented programs. Colorado State University, Technical Report
2. Ceccato M, Tonella P, Ricca F (2005) Is AOP code easier or harder to test than OOP code? In: First Workshop on Testing Aspect-Oriented Program (WTAOP). Chicago, Illinois. 15 March 2005
3. Lemos OAL, Franchin IG, Masiero PC (2009) Integration testing of object-oriented and aspect-oriented programs a structural pairwise approach for java. Sci Comput Program 74(10): 861–878
4. Zhao J (2003) Data-flow-based unit testing of aspect-oriented programs In: 27th Annual International Conference on Computer Software and Applications (COMPSAC). Dallas, TX, USA, 3-6 November 2003 5. Zhou Y, Ziv H, Richardson DJ (2004) Towards a practical approach to test
aspect-oriented software In: Beydeda S, Gruhn V, Mayer J, Reussner R, Schweiggert, F (eds) Proceedings of the workshop on testing component-based systems (TECOS 2004), Erfurt, Germany, September, 2004. Lecture notes in informatics, vol 58. p 1–16. GI, Konstanz 6. Massicotte P, Badri M, Badri L (2005) Aspects-classes integration testing
strategy: an incremental approach In: 2nd International Workshop on Rapid Integration of Software Engineering techniques (RISE 2005) Heraklion, Crete, Greece, 8-9 September 2005. Lectures notes in computer science, vol 3943. Springer, Heidelberg. pp 158–173
8. Ré R, Lemos OAL, Masiero PC (2007) Minimizing stub creation during integration test of aspect-oriented programs In: 3rd Workshop on Testing Aspect-Oriented Program (WTAOP), Vancouver, British Columbia, 13 March 2007. pp 1–6
9. Melton H, Tempero E (2007) An empirical study of cycles among classes in Java. Empir Softw Eng 12: 389–415
10. Galvan R, Pozo A, Vergilio S (2010) Establishing integration test orders for aspect-oriented programs with an evolutionary strategy In: 4th Latin American Workshop on Aspect-Oriented Software Development (LA-WASP), Salvador, BA, Brazil. 27-28 September 2010
11. Assunção W, Colanzi T, Vergilio S, Pozo A (2013) Generating integration test orders for aspect-oriented software with multi-objective algorithms. Revista de Informática Teórica e Aplicada (RITA) 20(2): 301–327 12. Colanzi T, Assunção W, Vergilio S, Pozo A (2011) Generating integration
test orders for aspect-oriented software with multi-objective algorithms In: Latin American Workshop on Aspect-Oriented Software Development (LA-WASP), São, Paulo, SP, Brazil, 26 September 2011
13. Colanzi T, Assunção WKG, Vergilio SR, Pozo A (2011) Integration test of classes and aspects with a multi-evolutionary and coupling-based approach In: Third International Symposium on Search Based Software Engineering (SSBSE), Szeged, Hungary, 10-12 September 2011. pp 188–203
14. Assunção W, Colanzi T, Vergilio S, Pozo A (2012) Evaluating different strategies for integration testing of aspect-oriented programs In: Latin American Workshop on Aspect-Oriented Software Development (LA-WASP), Natal, RN, Brazil, 23 September 2012
15. Deb K, Pratap A, Agarwal S, Meyarivan T (2002) A fast and elitist multiobjective genetic algorithm: NSGA-II. IEEE Trans Evol Comput 6(2): 182–197
16. Zitzler E, Laumanns M, Thiele L (2001) SPEA2: improving the strength Pareto evolutionary algorithm. Technical Report 103, Gloriastrasse 35, CH-8092 Zurich, Switzerland
17. Knowles JD, Corne DW (2000) Approximating the nondominated front using the Pareto archived evolution strategy. Evol Comput 8: 149–172 18. Kung D, Gao J, Hsia P, Toyoshima Y, Chen C (1995) A test strategy for
object-oriented programs In: 19th Computer Software and Applications Conference, Dallas, TX, USA, 9-11 August 1995
19. Kung DC, Gao J, Hsia P, Lin J, Toyoshima Y (1995) Class firewall, test order and regression testing of object-oriented programs. J Object-Oriented Programming 8(2): 51-65
20. Ré R (2009) A contribution to the minimization of the number of stubs during integration test of aspect-oriented programs. PhD thesis, University of São Paulo – Institute of Mathematical and Computer Sciences (ICMC-USP). In portuguese
21. Tarjan R (1972) Depth firstsearch and linear graph algorithms. SIAM J Comput 1(2): 146–160
22. Briand LC, Feng J, Labiche Y (2002) Using genetic algorithms and coupling measures to devise optimal integration test orders In: 14th International Conference on Software Engineering and Knowledge Engineering (SEKE) Ischia, Italy, 15-19 July 2002
23. Briand LC, Labiche Y (2003) An investigation of graph-based class integration test order strategies. IEEE Trans. Softw Eng 29(7): 594–607 24. Harman M (2007) The current state and future of search based software
engineering In: Future of Software Engineering - FOSE, Minneapolis, Minnesota, 23-25 May 2007. IEEE Computer Society, Washington, DC, pp 342–357
25. Goldberg DE (1989) Genetic algorithms in search, optimization, and machine learning. Addison-Wesley, Boston
26. Coello CAC, Lamont GB, Veldhuizen DAV (2006) Evolutionary algorithms for solving multi-objective problems (Genetic and evolutionary computation). Springer-Verlag New York, Inc., Secaucus 27. Chicano JF, Luna F, Nebro AJ, Alba E (2011) Using multi-objective
metaheuristics to solve the software project scheduling problem In: 13th Genetic and Evolutionary Computation Conference (GECCO), Dublin, Ireland, 12-16 July 2011, pp 1915–1922
28. ANNAS (2011) Graph implementation and algorithm package. Available at http://code.google.com/p/annas/. Accessed August 2011
29. Bigus JP, Bigus J (2001) Constructing intelligent agents using Java, 2nd edition. John Wiley & Sons, Inc., New York
30. Durillo J, Nebro A, Alba E (2010) The jMetal framework for multi-objective optimization: design and architecture In: IEEE Congress on Evolutionary
Computation (CEC), Barcelona, Spain. Lecture notes in computer science, vol 5467 Springer, Berlin/Heidelberg, pp 4138–4325
31. Vergilio S, Pozo A, Árias J, Cabral R, Nobre T (2012) Multi-objective optimization algorithms applied to the class integration and test order problem. Int J Softw Tools Technol Transf (STTT) 14: 461-475. doi:10.1007/s10009-012-0226-1
32. Arcuri A, Fraser G (2011) On parameter tuning in search based software engineering In: Proceedings of the Third International Symposium on Search Based Software Engineering, SSBSE’11 Szeged, Hungary, 10-12 September2011. Springer-Verlag, Berlin, Heidelberg, pp 33–47 33. Zitzler E, Thiele L, Laumanns M, Fonseca CM, da Fonseca VG (2003)
Performance assessment of multiobjective optimizers: an analysis and review. IEEE Trans Evol Comput 7: 117–132
34. Zitzler E, Thiele L (1999) Multiobjective evolutionary algorithms: a comparative case study and the strength Pareto approach. IEEE Trans Evol Comput 3(4): 257–271
35. Cochrane J, Zeleny M (1973) Multiple criteria decision making. Columbia 36. García S, Molina D, Lozano M, Herrera F (2009) A study on the use of
non-parametric tests for analyzing the evolutionary algorithms’ behaviour: a case study on the CEC’2005 Special Session on Real Parameter Optimization. J Heuristics 15(6): 617–644
37. Mortensen M, Ghosh S, Bieman JM (2008) A test driven approach for aspectualizing legacy software using mock systems. Inf Softw Technol 50(7–8): 621–640
doi:10.1186/1678-4804-20-9
Cite this article as:Assunçãoet al.: Evaluating different strategies for integration testing of aspect-oriented programs.Journal of the Brazilian Computer Society201420:9.
Submit your manuscript to a
journal and benefi t from:
7Convenient online submission
7Rigorous peer review
7Immediate publication on acceptance
7Open access: articles freely available online
7High visibility within the fi eld
7Retaining the copyright to your article
![Figure 1 Example of extended ORD (extracted from [7]).](https://thumb-us.123doks.com/thumbv2/123dok_us/860753.1583609/3.595.57.543.354.712/figure-example-extended-ord-extracted.webp)