Sergey V. Budaev
A.N. Severtsov Institute of Ecology and Evolution, Russian Academy of Sciences, Moscow
Author's current address: Centre for Neuroscience, School of Life Sciences, University of Sussex, Brighton. BN1 9QG, UK
E-mail: [email protected]
ABSTRACT: Factor analysis has commonly been used to infer the dimensions of animal temperament. However, the results were often complicated by large number of broad and situation-specific factors caused by low psychometric adequacy of the correlation
matrices, undermining the assumptions of factor analysis. In this study I reanalyzed the data sets obtained by Royce, Poley & Yeudall (1973) and Gervai & Csányi (1985) including, however, only the variables with high correlations (multiple R2>0.3) and psychometric adequacies (Kaiser-Meyer-Olkin measure>0.5). This yielded more stable and simpler factor solutions than in the original studies. Specifically, even though the present reanalysis cannot rule out the existence of other temperament factors, it indicates that two general dimensions, Activity-Exploration and Fear-Avoidance, are present in such diverse species as mice and the paradise fish.
INTRODUCTION
Individual differences in behavior are well known to everyone who works with animals of virtually any species. Some of the recent reviews (Budaev, 1996, 1997a,b; Clark & Ehlinger, 1987; Eysenck & Eysenck, 1985; Stevenson-Hinde, 1983; Wilson, Clark, Coleman & Dearstyne, 1994) emphasized the importance of studying integrated behavioral phenotypes and stable traits that are consistent over time and across situations, that is, temperaments and personalities. Within such a framework human and animal temperament is viewed as a system of stable dimensions which are directly unobservable and must be inferred form the observed behavior in various situations.
The problem of extracting general temperamental traits is closely linked to geometrical models in which individuals are represented as points or vectors in a
multidimensional space. The principal methodological task here is to find some solution with a minimum number of most salient temperament dimensions. It is performed typically by means of factor analysis. Because a few general factors can account for a large number of variables, the application of factor analysis brings interpretability and parsimony into the data.
The current evidence indicates that two broad dimensions – Activity-Exploration, incorporating such traits as exploration, stimulus-seeking propensity and sociability, and Fear-Avoidance, composed of shyness, fearfulness, anxiety and escape propensity – were systematically observed in various vertebrate species, which implies that common
However, the results of most analyses turned out to be often complicated, and in addition to these two factors involved additional ones lacking replicability (to note only a few references: Cattell & Korth, 1973 in dogs, Royce, Poley & Yeudall, 1973 in mice; Gerlai & Csányi, 1990 in fish; Cattell, 1973 in humans). This was, probably, because many of these studies were conducted to take as many different variables as possible sampled as widely as possible, to cover the whole “personality sphere” (see Cattell, 1973). In this tradition “only a few variables can ever justifiably be eliminated, and the need for this elimination must be strong” (Cattell & Korth, 1973, p. 17), even though one can potentially measure a literally infinite number of behavioral variables. A
methodological criticism often arises, namely that that factoring an arbitrary collection of heterogeneous variables with the primary aim to “invent hypotheses” in some inductive way is methodologically flawed (e.g. Eysenck & Eysenck, 1985). But in many
exploratory studies there may simply be no feasible alternative – a potentially important facet of temperament can be overlooked if some variables are arbitrarily omitted.
However, a more serious problem with such sparse analyses is of a statistical nature. The “personality sphere” approach has been criticized on the ground that
correlations between diverse, randomly sampled variables approach correlations between random deviates (Humphreys et al., 1969). The issue of simultaneous statistical inference (note that the number of individual correlations is proportional to the square of the
Many analyses can also suffer from inappropriate statistical analysis. As Zwick and Velicer’s (1986) examination has shown, the most widespread rule of thumb to retain as many factors as their eigenvalues exceed unity, is extremely poor and “very likely to provide a grossly wrong answer”, which “seems to guarantee that a large number of incorrect findings will continue to be reported” (p. 439). In fact, the Kaiser’s root-one method often overestimates the number of factors (Revelle & Rocklin, 1979; Zwick & Velicer, 1986), and a few broad factors are typically found more replicable across studies than many narrow factors (e.g. Guilford, 1977; Saville & Blinkhorn, 1981). Thus, some of the previously defined numerous factors of temperament in animals may be entirely spurious.
A detailed examination and reanalysis is possible for the data sets obtained by Royce, Poley & Yeudall (1973) and Gervai & Csányi (1985), in which the raw correlation matrices are available. An additional advantage is that both are based on unusually large sample sizes (respectively 775 mice Mus musculus, and 120 paradise fish Macropodus opercularis). Yet, a closer inspection reveals that in both cases some
definitely spurious factors were interpreted. In the original study of Royce et al. one can find at least two clear examples. The factor 13 was identified by two variables, however, at the neighboring page (Table 1, p. 40) one sees that these variables were surely
uncorrelated (r = -0.043 [!]; p>0.1 unadjusted for multiple tests); another example is the factor 15, also composed of equally unrelated variables. The factors containing one or more variables which do not correlate significantly (without adjustment for multiple inference) with other variables may also be found in the principal component solution of Gervai & Csányi (1985).
hypothesize (see above) that two relatively independent factors would appear in both cases (although additional factors cannot be ruled out, of course): the measures of exploratory behavior and activity would correlate together and form the Activity-Exploration dimension whereas the measures of fearfulness would make up the Fear-Avoidance factor. This reanalysis is also interesting because neither Royce et al. nor Gervai & Csányi hypothesized any structure, and variable selection was fully agnostic.
METHOD
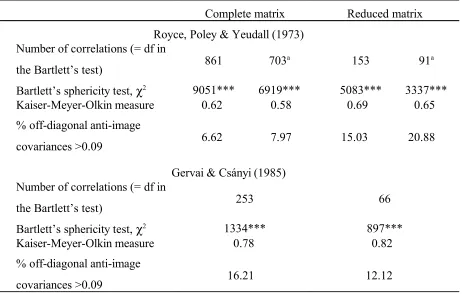
The correlation matrices presented in the papers of Royce et al. and Gervai & Csányi were entered into a computer and checked for errors. To estimate the degree to which components of the correlation matrix shared common variance, I computed the Bartlett’s sphericity test, the overall Kaiser-Meyer-Olkin measure of sampling adequacy (KMO) and inspected off-diagonal elements of the anti-image covariance matrix
(Dziuban & Shirkey, 1974). Separate KMO indices were computed for each variable to assess their individual factoring adequacy. Computation of the KMO index is desirable because a particular variable may have a high correlation with another variable, but still have poor adequacy, grossly falling out of the general pattern (e.g. if this is a chance correlation). Variables with KMO<0.5 are likely to impair the factor solution and should be removed; no meaningful factors can be extracted if the overall value of KMO is smaller then about 0.5 since the correlation matrix approaches a random matrix (see Dziuban & Shirkey, 1974).
of simulated data (PA, see Zwick & Velicer, 1986), involving 100 random samples in each case. The tests showed were no gross discrepancies.
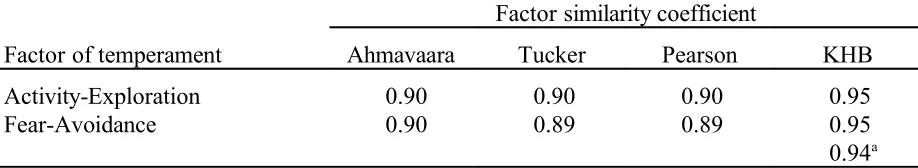
Finally, a direct comparison of temperament factors identified in the paradise fish in the Gervai & Csányi’s data with those determined in the guppy in my recent study (see Budaev, 1997b) was performed. I computed Ahmavaara (Wherry, 1984), Tucker, Pearson and Kaiser-Hunka-Bianchini (KHB) factor comparison coefficients for particular pairs of factors, as well as the KHB mean solution cosine for the overall agreement (Barrett, 1986). It was desirable to compute several independent indices based on different underlying assumptions (see Barrett, 1986).
RESULTS AND DISCUSSION
The overall level of absolute off-diagonal correlation coefficients within the matrix of Royce et al. was very low (very high proportion of essentially zero correlations), possibly caused by low ecological validity of the arbitrary behavioral variables. In contrast, the correlations within the matrix of Gervai & Csányi were
distributed bimodally with a good proportion of nonzero correlations (note that variables were represented by elements of the natural species’ ethogram). The distribution of the multiple correlation coefficients in both cases was multi-modal (Figure 1) making it possible to establish a reasonable cut-off value for discarding poorly correlated variables: in the Royce et al. data it was 0.3 (the first gap, see Fig. 1) and in the Gervai & Csányi data it was 0.5.
& Korth, 1973 for a similar unitary “body size” factor in dogs, and Budaev, 1997b for a report of no relation between temperament and size in a fish). However, the measures of sampling adequacy were computed including as well as excluding these variables.
As Table 1 shows, in both Royce et al. and Gervai & Csányi’s data sets, the procedure of variable reduction led to an improvement of the overall KMO measures of sampling adequacy. Not surprisingly, exclusion of the well-identified factor containing weight and sex variables reduced it in the Royce et al.’s data. Other measures of sampling adequacy (Table 1) revealed similar results, although in the Royce et al. data the
proportion of nonzero anti-image covariances increased. Thus, the reduced correlation matrices were more appropriate for factoring.
Reanalysis of the Royce et al.’s data.
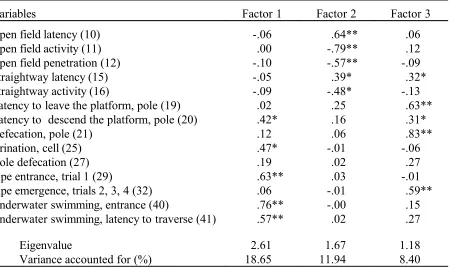
Three factors with eigenvalues greater than unity appeared, the VSS index also reached its maximum for the three-factor solution, but the PA method indicated four factors. Although a simulation study by Zwick & Velicer (1986) have found that the PA method is the most accurate in principal component analysis, it is not so in factor analysis (Crawford & Koopman, 1973). Revelle & Rocklin (1979) have also observed that the Montanelli & Humphreys’s (1976) procedure based exactly on its logic may show significant overestimation if communalities and factoring adequacy are low, as it was the case in this study. Additionally, there is a strong ground to discard poorly defined factors retained by the PA method (Zwick & Velicer, 1986). Thus, three factors were extracted.
platform (20). Thus, it is likely to reflect a motivation to escape and fearfulness. The second factor is also easily interpretable and, in fact, it closely corresponds to the Motor Discharge factor identified by Royce et al. Thus, the first two factors could really represent the Fear-Avoidance and Activity-Exploration, as hypothesized.
The third factor, explaining 8% of variance, is difficult to interpret as it is composed of pole defecation (21), the latency to leave the elevated platform (pole) (19), the latency to emerge from an opaque pipe into the goal-box with several food pellets on trials 2, 3 and 4 (when the animal has already learned that food may be found there) (32), and has also minor loading by (also elevated) straightway latency (15) and the latency to descend the platform (pole) (20). Although it seem to represent an unusual admixture of fear of an elevated platform and food motivation, it cannot be simply neglected.
However, an inherent two-dimensionality of the data was revealed when I
extracted 4 (indicated by the PA technique; also a small elbow appeared on the scree plot after this factor) or 5 factors and submitted them to the Wherry (1984) hierarchical rotation procedure. Two clear second-order factors emerged, which were almost identical in terms of factor loadings to the above Factor 1 and Factor 2 (Tucker congruence
coefficients = 0.96 and 0.83, respectively; Pearson correlation coefficients = 0.95 and 0.91, respectively).
Reanalysis of the Gervai & Csányi’s data.
indicated by the more reliable PA and VSS approaches (Revelle & Rocklin, 1979; Zwick & Velicer, 1986), also because the scree test applied in a separate analysis of only marker variables (loadings>0.7) clearly indicated two factors. These two factors were replicable (see below) and the correlation between them may have been caused by the large number of variables loading on the first factor and small number of variables uniquely identifying the second factor.
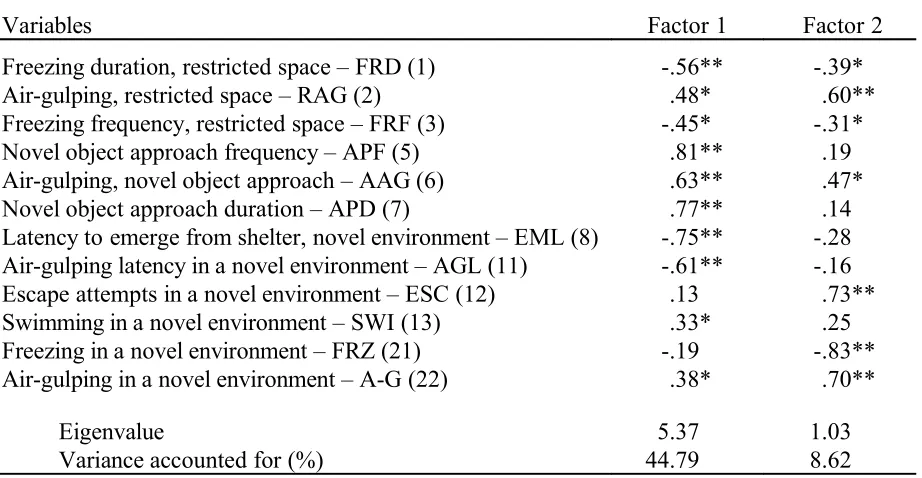
The first factor has the salient loadings by the frequency of approach to the novel object (a rotating disk) (APF), the time spent near it (APD), latency to emerge from a shelter (in fact, a start-box, EML), air-gulping in the novel object test (AAG), air-gulping latency in a novel environment (AGL), the time spent freezing in a restricted environment (a white plastic dish) (FRD), and is also loaded in a less degree by air-gulping duration (RAG) and freezing frequency (FRF) in a restricted space and air-gulping in a novel environment (A-G) (Table 3). Hence, it could be interpreted in terms of exploratory behavior and activity. The second factor has major loadings by freezing (FRZ), escape (ESC), air-gulping (A-G) in a novel environment and air-gulping in the restricted space (RAG). It also has minor loadings by air-gulping in the novel object test (AAG) and freezing in the restricted space (FRD and FRF). Thus, the second factor may reflect fear motivation and the tendency to escape. That air-gulping contributed to the fear factor, especially in a potentially dangerous novel environment, would be adaptive – a fish overtly swimming near the surface in presence of a dangerous stimuli will expose itself to a high risk. The fact that freezing was related to both factors agrees with the earlier evidence (Gerlai & Hogan, 1992; Budaev, 1997b) that this behavior may reflect both excessive fear and a mere inactivity or a relaxed state. Thus, the data obtained by Gervai & Csányi (1985) may also indicate the presence of the two major dimensions.
both factors (Table 4). Thus, the factors are replicable, even in spite of differences in species ecology and environmental conditions during testing.
GENERAL DISCUSSION
In this paper I reanalyzed the mice data of Royce, Poley & Yeudall (1973) and the paradise fish data of Gervai & Csányi (1985). By eliminating uncorrelated variables it was possible to achieve much simpler factor solutions than in the original studies. The present results indicate the existence of two general dimensions of temperament in such diverse species: Activity-Exploration and Fear-Avoidance. These factors were perfectly replicable across studies involving two fish species with different ecology, even though the testing environments were obviously not identical. Of course, this does not mean that these are the only dimensions of temperament. Additional factors may appear if different tests and variables were used, as well as if not all weakly correlated variables were excluded from the analysis. None the less, the present analysis indicates that Activity-Exploration and Fear-Avoidance tend to be the most general, stable and replicable.
Finally, it is curious to note that a similar reduction of an initially very complicated factor structure took place in the area of human personality studies. For example, Cattell (1973) identified as many as sixteen basic dimensions of personality. However, several recent studies failed to establish any replicability of the Cattell’s 16PF. No one was able to identify more than seven factors in the scales that were the basis of the whole system, and even these provided clear indication of the Extraversion and
How many Dimensions are Needed to Describe Temperament in Animals: A Factor Reanalysis of Two Data Sets
by S.V. Budaev
ACKNOWLEDGEMENTS
REFERENCES
Armstrong, J.S., & Soelberg, P. (1968). On the interpretation of factor analysis. Psychological Bulletin, 70, 361-364.
Barrett, P. (1986). Factor comparison: An examination of three methods. Personality and Individual Differences, 7, 327-340.
Barrett, P., & Kline, P. (1980). The location of superfactors P, E, and N within an unexplored factor space. Personality and Individual Differences, 1, 239-247. Budaev, S.V. (1996). The dimensions of personality in humans and other animals: A
comparative and evolutionary perspective. Unpublished manuscript.
Budaev, S.V. (1997a). The dimensions of personality in animals: The comparative and evolutionary framework. In: M. Taborsky & B. Taborsky (Eds.), Advances in Ethology. Contributions to XXV International Ethological Conference, Vienna, Austria, 20-27 August 1997 (vol. 32, p. 90). Berlin: Blackwell Wissenschafts-Verlag (Abstract).
Budaev, S.V. (1997b). “Personality” in the guppy (Poecilia reticulata): A correlational study of exploratory behavior and social tendency. Journal of Comparative
Psychology, 111, 399-411.
Cattell, R.B. (1973). Personality and mood by questionnaire. San Francisco: Jossey-Bass. Cattell, R.B., & Korth, B. (1973). The isolation of temperament dimensions in dogs.
Behavioural Biology, 9, 15-30.
Clark, A.B., & Ehlinger, T.J. (1987). Pattern and adaptation in individual behavioral differences. In: P.P.G. Bateson & P.H. Klopfer (Eds.), Perspectives in ethology (vol. 7, pp. 1-47). New York: Plenum Press.
Digman, J.M. (1990). Personality structure: Emergence of the five-factor model. Annual Review of Psychology, 41, 417-440.
Dziuban, C.D., & Shirkey, E.S. (1974). When is a correlation matrix appropriate for factor analysis? Some decision rules. Psychological Bulletin, 81, 358-361. Eysenck, H.J., & Eysenck, M.W. (1985). Personality and individual differences. A
natural science approach. New York: Plenum Press.
Gerlai, R., & Csányi, V. (1990). Genotype-environment interaction and the correlation structure of behavioral elements in paradise fish (Macropodus opercularis). Physiology and Behavior, 47, 343-356.
Gerlai R., & Hogan J.A. (1992). Learning to find the opponent: an ethological analysis of the behavior of paradise fish (Macropodus opercularis) in intra- and interspecific encounter. Journal of Comparative Psychology, 106, 306-315.
Gervai, J., & Csányi, V. (1985). Behavior-genetic analysis of the paradise fish, Macropodus opercularis. I. Characterization of the behavioral responses of inbred strains in novel environments: A factor analysis. Behavior Genetics, 15, 503-519. Guilford, J.P. (1977). The invariance problem in factor analysis. Educational and
Psychological Measurement, 37, 11-19.
Horn, J.L. (1967). On subjectivity in factor analysis. Educational and Psychological Measurement, 27, 535-538.
Humphreys, L.G., Ilgen, D., McGrath, D., & Montanelli, R. (1969). Capitalization on chance in rotation of factors. Educational and Psychological Measurement, 29, 259-271.
McKenzie, J. (1988). Three superfactors in the 16PF and their relation to Eysenck’s P, E, and N. Personality and Individual Differences, 9, 843-850.
Revelle, W., & Rocklin, T. (1979). Very simple structure: An alternative procedure for estimating the optimal number of interpretable factors. Multivariate Behavioral Research, 14, 403-414.
Royce, J.R. (1977). On the construct validity of open-field measures. Psychological Bulletin, 84, 1098-1106.
Royce, J.R., Poley, W., & Yeudall, L.T. (1973). Behavior genetic analysis of mouse emotionality: I. Factor analysis. Journal of Comparative and Physiological Psychology, 83, 36-47.
Saville, P. & Blinkhorn, S. 1981. Reliability, homogeneity, and the construct validity of 16PF. Personality and Individual Differences, 2, 325-333.
Stevenson-Hinde, J. (1983). Individual characteristics: a statement of the problem.
Consistency over time. Predictability across situations. In: R.H. Hinde (Ed.), Primate social relationships: An integrated approach (pp. 28-34). Oxford: Blackwell.
Walsh, R.N., & Cummins, R.A. (1976). The open-field test: a critical review. Psychological Bulletin, 83, 482-504.
Wherry, R.J. (1984). Contributions to correlational analysis. New York: Academic Press. Wilson, D.S., Clark, A.B., Coleman, K., & Dearstyne, T. (1994). Shyness and boldness in
humans and other animals. Trends in Ecology and Evolution, 9, 442-446. Wright, S.P. (1992). Adjusted P-values and simultaneous inference. Biometrics, 48,
1005-1013.
a the weight and sex variables are excluded; ***p<0.001
Complete matrix Reduced matrix
Royce, Poley & Yeudall (1973) Number of correlations (= df in
the Bartlett’s test) 861 703
a 153 91a
Bartlett’s sphericity test, χ2 9051*** 6919*** 5083*** 3337***
Kaiser-Meyer-Olkin measure 0.62 0.58 0.69 0.65
% off-diagonal anti-image
covariances >0.09 6.62 7.97 15.03 20.88
Gervai & Csányi (1985) Number of correlations (= df in
the Bartlett’s test) 253 66
Bartlett’s sphericity test, χ2 1334*** 897***
Kaiser-Meyer-Olkin measure 0.78 0.82
% off-diagonal anti-image
loadings (>0.5); * lower but interpretable loadings (0.3-0.5)
Variables Factor 1 Factor 2 Factor 3
Open field latency (10) -.06 .64** .06
Open field activity (11) .00 -.79** .12
Open field penetration (12) -.10 -.57** -.09
Straightway latency (15) -.05 .39* .32*
Straightway activity (16) -.09 -.48* -.13
Latency to leave the platform, pole (19) .02 .25 .63**
Latency to descend the platform, pole (20) .42* .16 .31*
Defecation, pole (21) .12 .06 .83**
Urination, cell (25) .47* -.01 -.06
Hole defecation (27) .19 .02 .27
Pipe entrance, trial 1 (29) .63** .03 -.01
Pipe emergence, trials 2, 3, 4 (32) .06 -.01 .59**
Underwater swimming, entrance (40) .76** -.00 .15
Underwater swimming, latency to traverse (41) .57** .02 .27
Eigenvalue 2.61 1.67 1.18
(>0.5); * lower but interpretable loadings (0.3-0.5)
Variables Factor 1 Factor 2
Freezing duration, restricted space – FRD (1) -.56** -.39*
Air-gulping, restricted space – RAG (2) .48* .60**
Freezing frequency, restricted space – FRF (3) -.45* -.31*
Novel object approach frequency – APF (5) .81** .19
Air-gulping, novel object approach – AAG (6) .63** .47*
Novel object approach duration – APD (7) .77** .14
Latency to emerge from shelter, novel environment – EML (8) -.75** -.28
Air-gulping latency in a novel environment – AGL (11) -.61** -.16
Escape attempts in a novel environment – ESC (12) .13 .73**
Swimming in a novel environment – SWI (13) .33* .25
Freezing in a novel environment – FRZ (21) -.19 -.83**
Air-gulping in a novel environment – A-G (22) .38* .70**
Eigenvalue 5.37 1.03
Csányi, 1985) and guppy (Budaev, 1997b); a KHB mean solution cosine
Factor similarity coefficient
Factor of temperament Ahmavaara Tucker Pearson KHB
Activity-Exploration 0.90 0.90 0.90 0.95
Fear-Avoidance 0.90 0.89 0.89 0.95