DOI: 10.14738/abr.65.4555.
Abdeldayem, M. M., & El-Sherbiney, R. A. (2018). A Comparative Study of the Financial Performance of the three Banking Modes in Egypt: Islamic, Conventional and Mixed Banks. Archives of Business Research, 6(5), 286-308.
A Comparative Study of the Financial Performance of the three
Banking Modes in Egypt: Islamic, Conventional and Mixed Banks
Marwan M. Abdeldayem
Cairo University, Egypt and Applied Science University (ASU), Kingdom of Bahrain
Radwa A. El-Sherbiney
Cairo University, Egypt
ABSTRACT
The purpose of this study is to examine and compare the financial performance of the three banking modes in Egypt: Islamic, conventional and mixed banks during the period 2003-2010. 13 banks are included in the study (i.e. 2 Islamic banks, 8 conventional banks, and 3 mixed banks). Multiple regression models are used to study the influence of both the internal bank-specific characteristics and the external macroeconomic environment on the performance of the three types of banks in Egypt. Return on assets (ROA) and return on equity (ROE) are employed to measure the performance of the three types of banks in Egypt. Moreover, a set of internal and external factors are considered as independent variables including; liquidity, capital adequacy, asset quality, operation efficiency, bank's size, GDP growth rate (GDP GR), and inflation rate. The findings reveal that operation efficiency has a significant negative impact on the three types of banks in Egypt, while bank's size and inflation rate have a significant influence merely on the performance of conventional banks. In addition, capital adequacy and asset quality have a positive significant influence on the performance of mixed banks. Furthermore, the comparison between financial performances of the three types of banks indicates that there is a significant difference between both ROA and ROE of Islamic banks and conventional banks, and the performance of conventional banks is better than the performance of Islamic banks in Egypt. On the other hand, there is no significant difference between the performance of Islamic banks and mixed banks, while there is a significant difference between ROA of conventional banks and mixed banks and no significant difference between ROE of conventional and mixed banks. The study also identifies the most significant indicators that contribute to assessing the performance of the three banking modes in Egypt.
Key Words: Financial Performance, ROA, ROE, Islamic Banks, Conventional Banks, Mixed Banks, Egyptian Stock Exchange (EGX), Egypt.
INTRODUCTION
common assets, contract organizations, and Takaful or insurance firms (Smaoui and Salah, 2012). Be that as it may, Islamic fund is not restricted to Muslims or Muslim nations. The UK reported plans to transform London into the world focal point of Islamic fund (Kerr, 2007); and global banks, for example, Citigroup, BNP Paribas, HSBC, and others are likewise venturing into this new portion of the business (Ariss, 2010).
Islamic banks are currently assuming a noteworthy part in their particular markets. They are quickly picking up pieces of the pie in their residential economies. The assets held by Islamic Financial Institutions added up to more than $822 billion and they are expected to surpass $1.5 Trillion by 2020 (Abdeldayem and Al-Dulaimi, 2018). Dissimilar to ordinary or conventional banks, where cash goes about as an item that can be purchased and sold, Islamic banks regard cash as an intend to encourage exchanges for trading reason (Al-Kassim, 2005). Islamic banks that take after Sharia' standards are restricted from doing what is done in conventional banks. As Sharia' requires the exchanges attempted in the Islamic banks to be; legitimate (halal), disallowing the installment of interest, staying away from speculation, and the installment of the Islamic taxes (zakat). Thusly, the items and administrations gave by the Islamic banks are set up as per the Sharia' standards (Abdeldayem, 2009 and Abdeldayem and Al-Dulaimi, 2018).
Islamic banks offered numerous items that depend on benefit and misfortune sharing guideline. There are five primary monetary administrations offered by Islamic banks which are; Mudarabah, Musharakah, Murabaha. Ijarah, and salam (Smaoui and Salah, 2012). In the long run, an assessment of the execution of Islamic banks and surveying their qualities and shortcomings, by investigating the determinants of money related execution of Islamic banks, ends up basic to help us on better comprehension of the present province of Islamic banking industry in Egypt.
Consequently, the purpose of this study is to identify the most significant factors that contribute to improving the financial performance of Islamic banks in Egypt and to compare their performance to the performance of conventional banks and mixed banks in Egypt. Accordingly, the research problem can be formulated in the following questions;
1. What is the impact of bank-specific factors on performance of Islamic banks, conventional banks, and mixed banks in Egypt?
2. Which type of the three banking modes in Egypt has the best performance?
The rest of the paper is organized as follows: Section (2) introduces the theoretical framework and literature review. The research methodology, data sources, sample and procedure and techniques of analysis are presented in section (3). Section (4) explains the empirical analysis and test results which includes descriptive statistics, regression analysis and a comparison between the three banking modes in Egypt. Section (5) provides summary and concluding remarks.
THEORITICAL FRAMEWORK AND LITERATURE REVIEW
Sehrish et al. (2012) compared the financial performance of 4 Islamic banks and 4 conventional banks in Pakistan during the period 2007-2011. They applied financial ratios analysis to measure the performance of the two types of banks. These ratios were classified into three main categories which were profitability ratios (return on assets (ROA) and return on equity (ROE)), efficiency ratios (revenues to assets ratio and cost to income ratio), and credit risk ratios (equity to net loans ratio and impaired loans to gross loans ratio). They found that Islamic banks in Pakistan performed better than conventional banks in terms of profitability during the first three years. In 2009, there was a tremendous decline in profitability of Islamic banks and conventional banks because of the financial crisis; however Islamic banks were capable of managing their losses and controlling the decrease in their profitability better than conventional banks. Regarding efficiency of both types of banks, Sehrish et al. concluded that Islamic banks were less efficient than conventional banks. Islamic banks could not manage their assets to generate revenues as conventional banks in Pakistan. It was found that the operating efficiency of Islamic banks was increasing as operating income increased, which means that Islamic banks increased their revenues but the expenses to generate these revenues increased at higher rate. On the other hand, conventional banks controlled their operations more efficiently than Islamic banks and it was noticed by their lower cost to income ratio. While for credit risk, Islamic banks had the superiority over conventional banks. The results showed that Islamic banks were less risky in terms of loans as they had better capital strength to absorb losses resulted from impaired loans. Overall, it was concluded that Islamic banks performed better in terms of profitability and credit risk management, while conventional banks were found to be more efficient than Islamic banks in utilizing their assets and managing their costs to generate revenues.
The results of Sehrish et al. (2012) contradicted the conclusions of Jaffar & Manarvi (2011) in terms of profitability but they had the same results concerning efficiency and capital adequacy, although their study was also conducted in Pakistan during different time period 2005-2009. Jaffar & Manarvi (2011) selected a sample of 5 Islamic banks and 5 conventional banks and adopted CAMEL test standard factors including capital adequacy, asset quality, management efficiency, earnings, and liquidity to analyze the performance of both modes of banking in Pakistan. It was found that conventional banks performed better in earnings than Islamic banks as Islamic banks performed poorly and had an overall ROA of -13.47% while conventional banks had ROA of 2.03% during the period of the study. In addition, conventional banks manage their operations more efficient than Islamic banks which had operating expenses ratio of 48%, while conventional banks had a ratio of 33% which means that conventional banks spent 33% of revenues on operating expenses. On the other side, it was realized that Islamic banks pioneered in capital adequacy and liquidity. Regarding capital adequacy, using debt to equity ratio, Islamic banks performed better in financing their assets by equity more than debts comparing to conventional banks. Also, capital to risk asset ratio was above minimum requirement in both modes of banking however, Islamic banks’ ratio was at least 3 times of conventional banks’ ratio. For liquidity, loan to asset ratio of Islamicbanks was lower than that of conventional banks which implies that Islamic banks paid less in loans leading to higher liquidity if compared to conventional banks. Lastly, the study reported that asset quality for both types of banking was almost the same although conventional banks was slightly having less loan loss reserves showing an improvement in policy of loan recovery.
Masruki et al. (2011) had the same results as Jaffar & Manarvi (2011). They also employed financial ratio analysis to compare the performance of 2 Islamic banks and 21 conventional banks in Malaysia from 2004 to 2008. They revealed in their study that conventional banks performed better in terms of profitability (ROAA and ROAE) than Islamic banks in Malaysia which had higher liquidity, as Islamic banks had lower net loans to assets ratio than conventional banks. Higher profitability of conventional banks might be contributing to higher asset quality and net financing that conventional banks enjoyed in Malaysia, but conventional banks at the same time suffered from higher credit risk (high financing to deposit ratio) comparing to Islamic banks which might affect its performance negatively later.
Variables of the study
We explain briefly the dependent variables that are used in the study which are Return on Assets (ROA) and Return on Equity (ROE).
Return on Assets (ROA)
Return on Assets (ROA) is the ratio of bank’s net after-tax income divided by its total assets (Akter et al., 2011; Alper & Anbar, 2011; and Gul et al., 2011). It indicates the efficiency of bank’s management of converting its assets to net profit (Karim et al., 2010; and Smaoui & Salah 2012).
Return on Equity (ROE)
Return on Equity (ROE) is the ratio of bank’s net after-tax income divided by its total equity capital (Rose, 2002; Akter et al., 2011; and Smaoui & Salah 2012). It is considered to be one of the ratios to measure the performance of banks. ROE indicates how the management of the bank is being effective to use the shareholders’ funds to be converted to net profits and to be flowing as a rate of return to shareholders (Hassan & Bashir, 2003).
Variables used to determine the performance (Independent variables)
The determinants of performance of banks are divided into two categories which are bank-specific variables (internal variables) and macroeconomic factors (external variables). Internal variables are those variables that are controlled by bank’s management, while external variables are beyond the control of bank’s management.
Bank-specific variables
Liquidity
Liquidity is the availability of cash and the rapid conversion of bank’s assets into cash to meet its obligations and short term liabilities as they come due (Akteret al., 2011).Net loans to total assets ratio (NLA) is one of ratios used to gauge liquidity performance and it measures the percentage of assets that have been tied up in loans. The higher the ratio the less liquidity the bank is, but it is an indicator for better bank’s performance because of increase in bank’s income as loans are the main source of revenues. On the other hand, higher NLA ratio might increase the probability that borrowers might default (Hassan & Bashir, 2003; Ghazali, 2008; Akter et al., 2011; Gul et al., 2011; and Smaoui & Salah, 2012).
Capital Adequacy
Capital adequacy refers to the availability of owned fund to sustain and support the bank’s business activities and is considered to be a safety shore in case of adverse developments (Idris et al. , 2011).
Equity to asset ratio (EA) is one of the basic ratios for measuring capital adequacy. It is used as a proxy for providing information on the capital structure and its impact on performance. It shows how much of total assets are financed by the bank's equity capital (Ghazali, 2008 and Karim et al., 2010).
Asset Quality
Operation Efficiency
Operation efficiency shows the capability of banks to make revenues and monitor expenses (Teng et al., 2012). Cost to Income ratio (COSR) is used as one of financial measures to evaluate performance of banks. COSR is considered to be one of the best indices to gauge profit performance and economic efficiency (Ghazali, 2008; and Akter et al., 2011). It is defined as the incurred costs to generate one dollar income. It is calculated as Total cost/Total income (Ghazali, 2008; Kosmidou, 2008; Akter et al., 2011; and Smaoui & Salah, 2012.).
Bank Size
It is important for bank policy to consider which bank size is appropriate to improve its performance. The asset size variable is commonly used in the literature of finance (Alper & Anbar, 2011; Gul et al., 2011; and Masood & Ashraf, 2012). The bank size is represented by the natural logarithm of total assets (log A). Worth mentioning that large banks with economies of scale enjoy providing services more efficiently than small banks (Haron, 1996) and they have the ability to diminish the costs of gathering and processing information (Boyd et al., 2000) also they have diversity in loan portfolio and can have access in markets that small banks cannot access (Smirlock, 1985 and Kosmidou et al., 2005). However the evidence on economies of scale is not definite. Some studies have found economies of scale of large banks such as Kosmidou (2008) and Alper & Anbar (2011), while other have found diseconomies for large banks such as Kosmidou et al. (2005)
METHODOLOGY
The research methodology includes the data used, sources of data, and techniques of analysis. The data used in this research to analyze the determinants of financial performance of Islamic banks, conventional banks, and mixed banks in Egypt, are all publicly available data (secondary data that already existed prior to the needs of researcher). The study covers the banks that are listed in the Egyptian stock exchange (EGX) and their financial statements are disseminated by Egypt for information dissemination (EGID) during the period 2003-2010. The total number of banks counted in the study is 13 banks including 2 Islamic banks, 8 conventional banks and 3 mixed banks. These banks have published financial statements during the period 2003-2010. Further, the data for external variables (GDP GR and inflation rate) are obtained from international financial statistics and data files by International Monetary Fund (The World Bank).
Techniques of Analysis
1. Multiple Regression Model
It is used to test the effect of each of the independent variables on the dependent variables, but before fitting regression model, Shapiro-Wilk W test was used. It is a non-parametric test for normality of data. Accordingly; the equation model will be as follows;
P = α + β1X1+ β2X2+ β3X3 + β4X4 + β5X5+ β6 X6 + β7 X7 + €
Where,
P is the measure of performance (ROA orROE). α is a constantterm.
β1 through β7 are coefficients to beestimated.
X1 through X7 are the determinants of performance of three types of banks inEgypt. € is an error term.
2. Two tail test of significance: The significance level at (P<0.05)
4. ANOVA test: It measures the goodness of fit for the regression model and it is used to determine whether or not different groups have different arithmetic means.
5. Collinearity statistics: Variance Inflation Factor (VIF) is used to test multicollinearty between independent variables.
6. Breusch-pagan/cook-weisberg test: it is used to test for homogeneity between variances across observations.
Based on the literature review, this study has selected the most common used independent variables which are capital adequacy, asset quality, liquidity, operation efficiency, and bank's size as bank- specific variables and GDP GR and inflation rate as macroeconomic variables. Regarding dependent variables, this study concentrates on ROA and ROE as measures of performance of banks in Egypt. Finally, ordinary least square multiple regression method will be used to run the analysis.
To the best of our knowledge, there is shortage in studies that analyzed the performance of Islamic banks in Egypt; also we observed that all previous studies included in this research either focused on Islamic banks or conventional banks and none of studies mentioned those conventional banks that had Islamic windows. Consequently, this study focused on studying the performance of Islamic banks in Egypt, and compared their performance to conventional banks and mixed banks in order to determine the most significant factors affect the performance of Islamic banks and to know if these factors have the same impact on other two types of banks in Egypt. Hence, we can figure out which one of these three types of banks have the best performance in Egypt.
Population and Sample
There are 40 commercial banks that are listed in the Central bank of Egypt (CBE). These commercial banks are divided into 3 Islamic banks, 10 conventional banks that have Islamic windows (mixed banks), and 27 conventional banks. The study covered those banks that are listed in the Egyptian exchange market (EGX) and the researcher examined their financial statements that are published by EGID during the period 2003-2010 (i.e. prior to the 25th January, 2011 Egyptian revolution so we can have a normal time series and avoid the abnormal economic consequences that followed this event in Egypt). Therefore, the total number of banks that are included in the study is 13 banks (2 Islamic banks, 8 conventional banks, and 3 mixed banks).
Since we conducted a time series analysis and a cross sectional analysis, then a balanced panel data was used to satisfy the purpose of analysis. Panel data have been used because of the capability of eliminating errors occurred due to inherent multicollinearity between independent variables by having more observations on explanatory variables, so that accurate results will be obtained (Haron, 2004; Ghazali, 2008; Teng et al., 2012, and Abdeldayem & Darwish, 2018). There are other studies that elaborated the importance of panel data and used panel data set to run their analysis such as Ramdan et al. (2011), Alper & Anbar (2011), and Smaoui & Salah (2012).
Table (1) Description and notations of dependent and independent variable
Variables Description Notation
Dependent
Performance Return on Assets ROA
Return on Equity ROE
Independent
Liquidity Net loans/total assets LIQ
Capital Adequacy Equity/total assets CA
Asset Quality Loan loss gross reserves/ loans AQ
Operation Efficiency Cost to income ratio OE
Bank's size Natural Logarithm ofAssets Ln Size
ANALYSIS AND EMPIRICAL FINDINGS Descriptive statistics
First we used descriptive statistics to explain the characteristics of each type of banking sector. The researchers calculated the mean (which is a measure of central tendency and central location of data), standard deviation (which is a measure of dispersion of data from the average mean) minimum, and maximum values of each variable for the three types of banks. Thereafter, we ran ANOVA test to examine the differences in characteristics between the three types of banks in Egypt. The results of each banking sector are calculated separately and then these characteristics of the three types of banks are compared together as follows;
Descriptive statistics for Islamic Banks
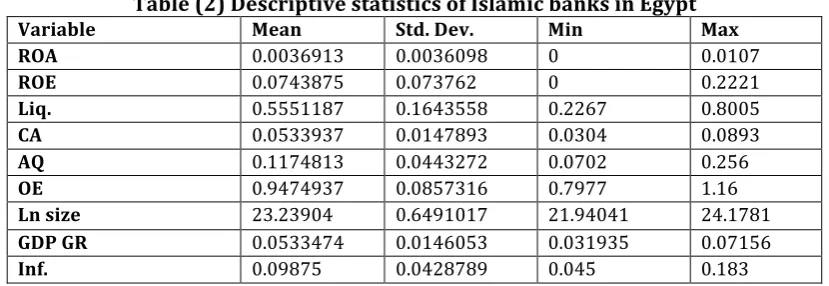
Table (2) below presents a descriptive analysis for the data gathered to analyze the performance of 2 Islamic banks in Egypt for a time series from 2003 to 2010.
Table (2) Descriptive statistics of Islamic banks in Egypt
Variable Mean Std. Dev. Min Max
ROA 0.0036913 0.0036098 0 0.0107
ROE 0.0743875 0.073762 0 0.2221
Liq. 0.5551187 0.1643558 0.2267 0.8005
CA 0.0533937 0.0147893 0.0304 0.0893
AQ 0.1174813 0.0443272 0.0702 0.256
OE 0.9474937 0.0857316 0.7977 1.16
Ln size 23.23904 0.6491017 21.94041 24.1781
GDP GR 0.0533474 0.0146053 0.031935 0.07156
Inf. 0.09875 0.0428789 0.045 0.183
Table (2) shows that both ROA and ROE have the same minimum value equals to zero, which indicates that Islamic banks did not suffer from net losses within the period of study, but there were years when their revenues were covering their expenses with no net profit. Additionally, the maximum value of ROE (0.2221) ishigher than the maximum value of ROA (0.0107) over the period of study. The average mean for ROA and ROE are 0.004 and 0.074 respectively, but the standard deviation of ROE (0.074) is higher than that of ROA (0.004) which means that the deviation of values of ROE across the years of study from their average mean is higher than dispersion of values of ROA from their average mean.
banks is 0.117, while their minimum value is 0.07 and maximum value is 0.256 with standard deviation = 0.044. Furthermore, the results reveal that mean of operation efficiency over the period of study for Islamic banks is 0.95, while the minimum value is 0.7977 and maximum value is 1.16 with standard deviation of 0.086. Eventually, the last internal variable included in the study is bank's size and it is found that it has average mean of 23.23 with standard deviation equals to 0.65, while the minimum value is 21.9 and maximum value is 24.18. Regarding external variables which are GDP GR and inflation rate, the findings of table (2) implies that the mean of GDP GR during the given period for Islamic banks is 0.053, while the minimum value is 0.03 and maximum value is 0.07 and standard deviation of 0.014, while mean of inflation rate is 0.098 with standard deviation of 0.043and the minimum value is 0.045 and the maximum value is 0.183.
Descriptive statistics for Conventional Banks
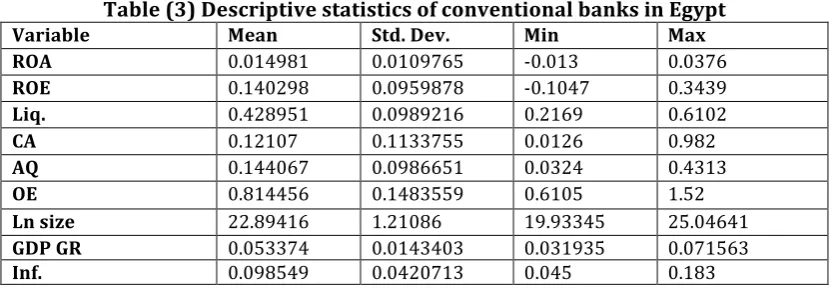
Table (3) shows the descriptive statistics of data compiled in the analysis of 8 conventional banks' performance in Egypt over the period 2003-2010.
Table (3) Descriptive statistics of conventional banks in Egypt
Variable Mean Std. Dev. Min Max
ROA 0.014981 0.0109765 -0.013 0.0376
ROE 0.140298 0.0959878 -0.1047 0.3439
Liq. 0.428951 0.0989216 0.2169 0.6102
CA 0.12107 0.1133755 0.0126 0.982
AQ 0.144067 0.0986651 0.0324 0.4313
OE 0.814456 0.1483559 0.6105 1.52
Ln size 22.89416 1.21086 19.93345 25.04641
GDP GR 0.053374 0.0143403 0.031935 0.071563
Inf. 0.098549 0.0420713 0.045 0.183
It can be seen from table (3) that the minimum values of ROA and ROE of conventional banks are -0.013 and -0.1047 which implies that conventional banks in Egypt suffered from net losses within the period of study, while the maximum values of ROA and ROE are 0.0376 and 0.3439 respectively. The average mean for ROA and ROE are 0.015 and 0.14 respectively, but the standard deviation of ROE (0.096) is higher than the standard deviation of ROA (0.011) which means that the deviation of values of ROE across the years of study from their average mean is higher than dispersion of values of ROA from their average mean.
value is 0.03 and maximum value is 0.07. Lastly, inflation rate is found to have an average mean equals to 0.098 and standard deviation of 0.04 with least rate equals to 0.045 and highest rate of 0.183.
Descriptive statistics for Mixed Banks
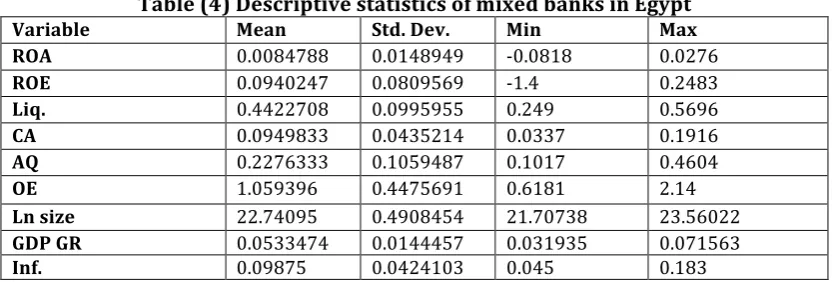
Table (4) demonstrates the descriptive statistics of 3 mixed banks in Egypt for the period 2003-2010.
Table (4) Descriptive statistics of mixed banks in Egypt
Variable Mean Std. Dev. Min Max
ROA 0.0084788 0.0148949 -0.0818 0.0276
ROE 0.0940247 0.0809569 -1.4 0.2483
Liq. 0.4422708 0.0995955 0.249 0.5696
CA 0.0949833 0.0435214 0.0337 0.1916
AQ 0.2276333 0.1059487 0.1017 0.4604
OE 1.059396 0.4475691 0.6181 2.14
Ln size 22.74095 0.4908454 21.70738 23.56022
GDP GR 0.0533474 0.0144457 0.031935 0.071563
Inf. 0.09875 0.0424103 0.045 0.183
Table (4) reveals that the minimum values of ROA and ROE of mixed banks are 0.0818 and -1.4 which implies that mixed banks in Egypt suffered from net losses within the period of study as conventional banks did, while the maximum values of ROA and ROE are 0.0276 and 0.2483 respectively. The average mean of ROA and ROE are 0.008 and 0.094 respectively, but the standard deviation of ROE (0.081) is higher than the standard deviation of ROA (0.015) which means that the deviation of values of ROE across the years of study from their average mean is higher than dispersion of values of ROA from their average mean.
Regarding the internal and external variables that affect the performance of mixed banks in Egypt, table (4) indicates that the average of liquidity ratio during the given period for mixed banks in Egypt is 0.44, while their minimum value is 0.249 and maximum value is 0.57 with standard deviation of 0.10. The results of capital adequacy shows that this ratio has average mean of 0.095 and standard deviation = 0.044, while the minimum value is 0.034 and the maximum value is 0.192. Further, the mean of asset quality during the given period for mixed banks is 0.228, while their minimum value is 0.102 and maximum value is 0.4604 with standard deviation = 0.106. In addition, the results reveal that the mean of operation efficiency over the period of study for mixed banks is 1.06, while the minimum value is 0.618 and maximum value is 2.14 with standard deviation of 0.448. Eventually, the last internal variable included in the study is bank's size and it is found that it has average mean of 22.74 with standard deviation equals to 0.491, while the minimum value is 21.71 and maximum value is 23.56. When we turn to external variables i.e. GDP GR and inflation rate, the findings of table (4) show that the mean of GDP GR during the given period for mixed banks is 0.05, while the minimum value is 0.03and maximum value is 0.072 and standard deviation of 0.014, while the mean of inflation rate is 0.099 with standard deviation of 0.0424 and the minimum value is 0.045 and maximum value is 0.183.
Comparing the characteristics of Islamic banks, conventional banks, and mixed banks
Table (5) ANOVA test for Capital adequacy: Analysis of Variance
Analysis of Variance
Source SS df MS F Prob.
Between groups 0.063305099 2 0.031652549 3.61 0.0303
Within groups 0.946625979 108 0.008765055
Total 1.00993108 110 0.009181192
Table (5) shows that there is a significant difference of capital adequacy variable of the three types of banks, as the probability of f-statistics is less than 0.05. In order to know which types of banks are different 2*2 test is conducted and table (6) reveals the results
Table (6) Results of 2*2 test
Row mean –conventional mean p-value
Conventional banks Islamic banks
Islamic banks -0.067677 Prob. = 0.031
Mixed banks -0.026087 Prob. = 0.722
0.04159 Prob. = 0.515
It can be seen from table (6) that there is a significant difference between capital adequacy of conventional banks and Islamic banks at 95% significant level. It is shown that conventional banks havebetter capital adequacy and more capable of absorbing losses than Islamic banks, because the average mean of capital adequacy of conventional banks is higher than that of Islamic banks.
Liquidity variable was taken into consideration to run ANOVA test on and to recognize the differences of this variable between the three types of banks. Table (7) shows the results of ANOVA test on liquidity ratio.
Table (7) ANOVA test for Liquidity Analysis of variance
Analysis of Variance
Source SS df MS F Prob.
Between groups 0.209691121 2 0.104845561 8.59 0.0003
Within groups 1.31832003 108 0.012206667
Total 1.52801115 110 0.01389101
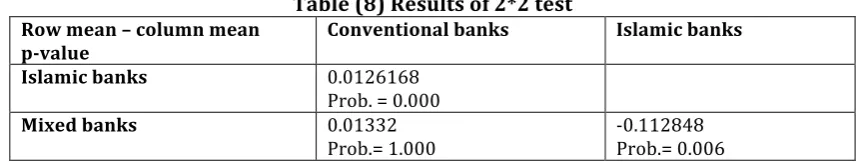
Table (7) explains that there is a significant difference of liquidity ratio between three types of banks at 95% confidence level. Further analysis is made to recognize exactly which types of banks are significantly different in terms of liquidity. The results are shown in table (8)
Table (8) Results of 2*2 test
Row mean – column mean p-value
Conventional banks Islamic banks
Islamic banks 0.0126168 Prob. = 0.000
Mixed banks 0.01332
Prob.= 1.000
-0.112848 Prob.= 0.006
less liquid risk when compared to Islamic banks and mixed banks. ANOVA test is also employed on asset quality ratio and tables (9) and (10) present the results.
Table (9) ANOVA test for Asset quality Analysis of variance
Analysis of variance
Source SS df MS F Prob.
Between groups 0.156411791 2 0.078205896 8.72 0.0003
Within groups 0.969087328 108 0.008973031
Total 1.12549912 110 0.01023181
Table (9) indicates that there is a significant difference of asset quality between three types of banks at 95% confidence level. For more precise results table (10) shows exactly which types of banks that have significant difference in asset quality.
Table (10) Results of 2*2 test
Row mean – column mean p-value
Conventional banks Islamic banks
Islamic banks -0.026586 Prob.= 0.938
Mixed banks 0.083566
Prob.= 0.001
0.110152 Prob. = 0.001
Table (10) reveals that the average mean of asset quality of mixed banks is higher than that of both Islamic banks and conventional banks at 99% confidence level. This result indicates that mixed banks face higher credit risk and higher chance of doubtful loans if compared with Islamic banks and conventional banks in Egypt.
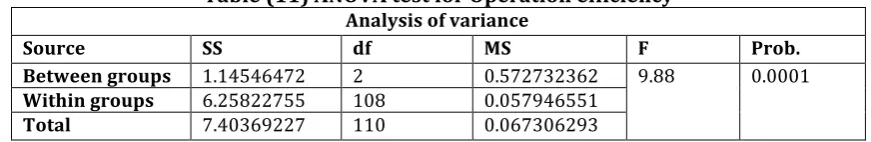
The last variable that is needed to test ANOVA on is operation efficiency. Table (11) and table (12) explain the results of ANOVA test.
Table (11) ANOVA test for Operation efficiency
Analysis of variance
Source SS df MS F Prob.
Between groups 1.14546472 2 0.572732362 9.88 0.0001
Within groups 6.25822755 108 0.057946551
Total 7.40369227 110 0.067306293
Table (11) indicates that there is a significant difference in operation efficiency between the three types of banks at 95% confidence level. By running 2*2 test, the results shown in table (12) can reveal which types of banks have significant difference in operation efficiency.
Table (12) Results of 2*2 test
Row mean – column mean p-value
Conventional banks Islamic banks
Islamic banks 0.133037 Prob. =0.145
Mixed banks 0.24494
Prob.= 0.000 0.111902 Prob. = 0.458
Table (12) indicates that the average mean of operation efficiency of mixed banks is higher than that of conventional banks and this difference is significant at 99% level of confidence.
Regression Analysis
significant effect on the dependent variable- to be included in the model. The multiple linear regression is a method of regression in which there are more than one independent variables adopted in the equation (Beck et al., 2008). It is used when the dependent variable is of ratio scale, the multiple linear regression model is used to test the effect of each of the independent variables on the dependent variable.
There are two dependent variables (ROA and ROE) and seven independent variables which are divided into bank-specific variables (liquidity, capital adequacy, asset quality, operation efficiency, and bank's size) and macroeconomic variables (GDP GR and inflation rate).
For each dependent variable, two models are fitted. One model includes only the internal variables (liquidity, capital adequacy, asset quality, operation efficiency, bank’s size) and the other one takes into consideration the macroeconomic variables (GDP GR and inflation rate) besides the internal variables. Moreover, these four models are fitted for each type of bank.
Before fitting regression model, normality of dependent variables assumption (which is one of the most important assumptions of regression analysis) must be checked. To test this assumption Shapiro-Wilk W test for normal data is used, which is non-parametric test for testing normality of data. If probability of z-statistic is greater than 1%, then we do not reject H0, otherwise we reject H0.
H0: The dependent variable is normally distributed.
Islamic banks:
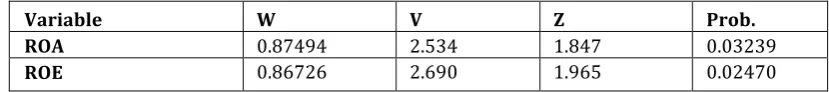
Table (13) presents the results of Shapiro-Wilk W test for normality of dependent variables of Islamic banks in Egypt.
Table (13) Shapiro-Wilk W test for normal data of Islamic banks
Variable W V Z Prob.
ROA 0.87494 2.534 1.847 0.03239
ROE 0.86726 2.690 1.965 0.02470
Table (13) reveals the following results:
1- Since the probability of z-statistic for ROA variable is more than 0.01, we do not reject the null hypothesis i.e. this variable is normally distributed at 99% level of confidence. 2- As probability of z-statistic for ROE variable is more than 0.01, we do not reject null
hypothesis i.e. this variable is normally distributed at 99% level of confidence. As normality assumption is satisfied, then regression model can be fitted.
ROA MODEL
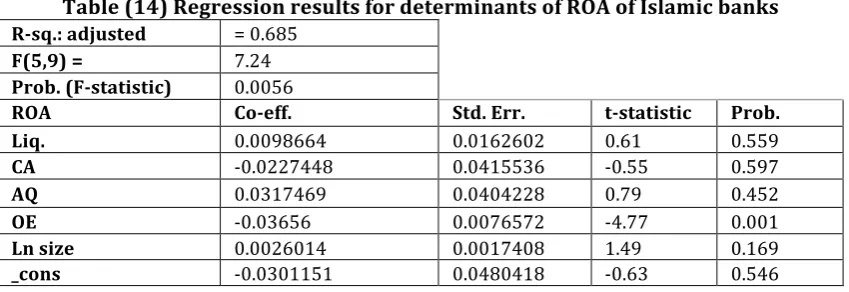
Table (14) Regression results for determinants of ROA of Islamic banks
R-sq.: adjusted = 0.685
F(5,9) = 7.24
Prob. (F-statistic) 0.0056
ROA Co-eff. Std. Err. t-statistic Prob.
Liq. 0.0098664 0.0162602 0.61 0.559
CA -0.0227448 0.0415536 -0.55 0.597
AQ 0.0317469 0.0404228 0.79 0.452
OE -0.03656 0.0076572 -4.77 0.001
Ln size 0.0026014 0.0017408 1.49 0.169
_cons -0.0301151 0.0480418 -0.63 0.546
Table (14) reveals the following results:
1- The overall model is significant as the probability of f-statistic is less than 5%.
2- ROA is affected by operation efficiency only as its corresponding p-value is less than 0.01 which means that these two variables are significant at 99%.
3- It is shown from regression model that when operation efficiency increases by 1%, then ROA decreases by 3.7% at 99% level of confidence and fixing all other variables.
4- Adjusted R2 = 68.5% which means that the estimated model describes approximately 69% from the variations that happens in ROA.
5- Model diagnosis:
a. There is no multicollinearty problem (multicollinearty means that there is linear relation between independent variables) as VIF (Variance Inflation Factor is a measure for multicollinearty between independent variables) for all variables is less than 10 as it appears in table (15).
Table (15) Multicollinearity results of independent variables
Variables Liquidity Asset quality Capital adequacy Ln Size Operation efficiency
VIF 5.63 5.09 1.87 1.81 1.36
b. When Breush-pagan/cook-weisberg test is used to inspect homogeneity in the data (homogeneity means that errors have equal variance across observations),we observe that the probability of chi2 is 0.1155 which is greater than 0.10. Therefore, H0 is not rejected (H0: The errors have constant variance across observations). This indicates that there is homogeneity in the data.
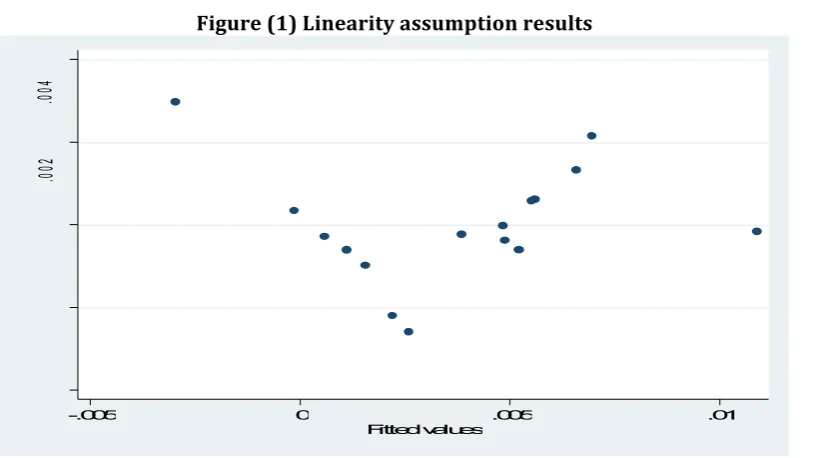
Figure (1) Linearity assumption results
Figure (1) reveals that the linearity assumption is satisfied and there is a linear relation between dependent and all independent variables since the values are randomly scattered around zero when standardized residuals are plotted against predicted values.
ROE MODEL
Table (16) exhibits the estimated model for return on equity (ROE) without including the external variables in order to know the most significant factor that affect ROE under the control of bank's management.
Table (16) Regression results for determinants of ROE of Islamic banks
R-sq.: adjusted = 0.685
F(5,9) = 3.98
Prob. (F-statistic) 0.0351
ROA Co-eff. Std. Err. t-statistic Prob.
Liq. 0.245173 0.3971481 0.62 0.552
CA -0.5609685 1.014927 -0.55 0.594
AQ 0.3668173 0.987307 0.37 0.719
OE -0.7538852 0.1870235 -4.03 0.003
Ln size 0.0391767 0.0425175 0.92 0.381
_cons -0.2709811 1.173399 -0.23 0.823
Table (16) reveals the following results:
1- The overall model is significant as the probability of f-statistic is less than 5%.
2- ROE is affected by operation efficiency only as its corresponding p-value is less than 0.01 which means that this variable is significant at 99%.
3- It appears from the regression model that when operation efficiency increases by 1%, ROE decreases by 75% fixing all other variables and this result is significant at 99% level of confidence.
4- Adjusted R2 = 68.5% which means that the estimated model describes approximately 69% of the variations that happens in the ROE.
a. There is no multicollinearty problem (multicollinearty means that there is linear relation between the independent variables) as VIF (which is a measure for multicollinearty) for all variables is less than 10 as it appears in table (17).
Table (17) Multicollinearity results of independent variables
Variables Liquidity Asset quality Capital adequacy Ln Size Operation efficiency
VIF 5.63 5.09 1.87 1.81 1.36
b. When Breush-pagan/cook-weisberg test is used to inspect homogeneity in the data (homogeneity means that errors have equal variance across observations), we observe that probability of chi2 is 0.1155 which is greater than 0.10. Therefore, H0 is not rejected (H0: The errors have constant variance across observations). This indicates that there is homogeneity in the data.
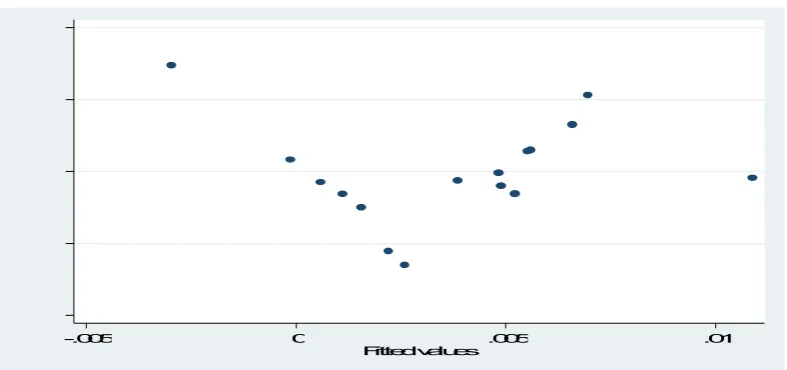
c. Linearity: It is one of the assumptions of regression model; we check linearity by plotting standardized residuals versus predicted values. If the scatter is random around zero then there is no problem in linearity, and vise versa. (it should be noted that linearity means that there is a linear relation between the dependent and all independent variables, i.e. it does not measure for each independent variable). Figure (2) illustrates the results of linearity assumption.
Figure 4.3: Linearity assumption results
Figure (2) reveals that linearity assumption is satisfied and there is a linear relation between the dependent and all independent variables as the values are randomly scattered around zero when standardized residuals are plotted against predicted values.
Conventional Banks
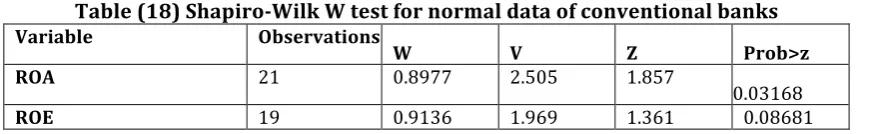
Table (18) Shapiro-Wilk W test for normal data of conventional banks
Variable Observations
W V Z Prob>z
ROA 21 0.8977 2.505 1.857
0.03168
ROE 19 0.9136 1.969 1.361 0.08681
It can be observed from the results displayed in table (18) the following:
1. As probability of z-statistic for the ROA variable is more than 0.01 then we do not reject null hypothesis i.e. this variable is normally distributed at 99% level of confidence. 2. As probability of z-statistic for the ROE variable is more than 0.01 then we do not reject
null hypothesis i.e. this variable is normally distributed at 99% level of confidence. Therefore, as normality assumption is satisfied, regression model can be fitted.
Mixed Banks
When Shapiro- Wilk W test is employed to test for the normality of the dependent variables, the normality is not satisfied due to some outliers in dependent variables. After deleting these outliers, the normality assumption is satisfied, and table (19) presents the results of Shapiro-Wilk W test for normality of the dependent variables of mixed banks in Egypt.
Table (19) Shapiro-Wilk W test for normal data of mixed banks
Variable Observations
W V Z Prob>z
ROA 21 0.8977 2.505 1.857
0.03168
ROE 19 0.9136 1.969 1.361 0.08681
It can be observed from the results displayed in table (19) the following:
1. As probability of z-statistic for the ROA variable is greater 0.01 then we do not reject null hypothesis i.e. this variable is normally distributed at 99%.
2. As probability of z-statistic for the ROE variable is greater 0.01 then we do not reject null hypothesis i.e. this variable is normally distributed at 99%. As the normality assumption is satisfied the regression model can be fitted.
A Comparative analysis of the financial performance of the three banking modes: Islamic, Conventional and Mixed Banks
In order to conduct this comparison, ANOVA test is utilized. (ANOVA is a statistical test used to determine whether or not different groups have different arithmetic means). The results of this test for ROA and ROE are displayed in tables (20) and (22) respectively.
Table (20) Results of ANOVA test for ROA
Analysis of Variance
Source SS df MS F Prob.
Between groups 0.00198 2 .0009 7.98 0.0006
Within groups 0.01294 104 .0001
Total 0.01493 106 .0001
Table (21) Results of 2*2 test
Row mean – column mean p-value
Conventional banks Islamic banks
Islamic banks -0.01129 Prob. =0.001
Mixed banks -0.006503 Prob.= 0.063
0.004788 Prob. = 0.597
From table (21) it is clear that the mean of ROA in conventional banks is greater than that of Islamic banks by 0.01129 and this result is significant at 99%. The mean of ROA in conventional banks is greater than that of mixed banks by 0.006503 and this result is significant at 90%. There is no significant difference between the mean of ROA in mixed and Islamic banks. Table (22) summarizes the results of ANOVA test for ROE
Table (22) Results of ANOVA test for ROE
Analysis of Variance
Source SS df MS F Prob.
Between groups 0.074575 2 .0372 4.55 0.0128
Within groups 0.835327 102 .008
Table (22) indicates that probability of f-statistic is less than 0.05, i.e. there is a significant difference of performance (ROE) between the three types of banks at 95% level of confidence. In order to identify exactly which types of banks are different, 2*2 t-testis conducted and table (23) reveals the results.
Table (23) Results of 2*2 test
Row mean – column mean p-value
Conventional banks Islamic banks
Islamic banks -0.0659 Prob. =0.030
Mixed banks -0.046
Prob.= 0.152
0.019 Prob. 1
Table (23) indicates that the mean of ROE in conventional banks is greater than the mean of ROE in Islamic banks by 0.0659 and this difference is significant at 95%. There is no significant difference between the mean of ROE in mixed and Islamic banks. There is no significant difference between the mean of ROE in mixed and conventional banks.
Table (24) Summary of the study's findings
Variables The significant relationship between dependent and independent variables
Studies support the findings
Liquidity Insignificant relationship with performance of banks.
Alper & Anbar (2011), Masood & Ashraf (2012), and Teng et al. (2012)
Capital adequacy - Insignificant relationship (Islamic and conventional banks)
- Significant positive relationship (mixed banks).
Alper & Anbar (2011) and Teng et al. (2012).
Karim et al. (2010), Ramdan et al. (2011), and Smaoui & Salah (2012).
Asset quality - Insignificant relationship (Islamic and conventional banks).
- Significant positive relationship (mixed banks).
Kosmidou et al. (2005) and Dietrich & Wanzenried (2011).
Operation
efficiency
Significant negative relationship with the performance of banks.
Kosmidou (2008) and
Karim at al. (2010).
Bank's size - Insignificant relationship (Islamic and mixed banks).
- Significant negative relationship (conventional banks).
Wasiuzzaman & Tarmizi (2009) and Ramdan et al.
(2011).Kosmidou et al. (2005) and Pasiouras & Kosmidou (2007).
GDP GR Insignificant relationship with performance of banks.
Masood & Ashraf (2012) and Smaoui & Salah (2012).
Inflation rate Significant positive relationship with performance
Of conventional banks
Bashir (2003), Kosmidou
et al
(2005),and Izhar & Asutay (2007).
CONCLUDING COMMENTS
After checking the normality of dependent variables and testing the significance of the models to test the impact of bank-specific factors and macroeconomic factors on financial the financial performance of Islamic banks, conventional banks, and mixed banks in Egypt. The findings of this research effort reveal that operation efficiency is the most significant variable that affect the three types of banks in Egypt, and the average mean of the performance of conventional banks is more than the average mean of the performance of the other two types of banks in Egypt.
Furthermore, since there has been a shortage in researches that examined the financial performance of Islamic banks in Egypt (to the best of the researchers' knowledge), this study aims at investigating the factors that influence the financial performance of Islamic banks in Egypt and whether these factors have the same impact on the conventional and mixed banks in order to identify the most significant variable that has an effect on the performance of Islamic banks in specific and on banking sector as a whole. Hence, the study utilized a panel data set of 104 observations during the period 2003-2010 for the econometric analysis. After conducting the statistical techniques to test the hypotheses, we conclude the following:
2. For Islamic banks, equity to assets ratio has a negative impact on their performance which supports the results of Wasiuzzaman & Tarmizi (2009). On the other hand, the impact of capital adequacy on performance of conventional and mixed banks is not clear cut. Capital adequacy has a positive relationship with performance of conventional and mixed banks when ROA is employed as a measure of performance, while the relationship is found to be negative when ROE is used as a measure of performance, yet the relationship is found to be insignificant (this conclusion is in line with Alper & Anbar (2011) and Teng et al. (2012)) regardless the type of bank except for mixed banks, capital adequacy has a significant positive impact on ROA under first and second model. This is consistent with Karim et al. (2010), Ramdan et al. (2011), and Smaoui & Salah (2012).
3. Loan loss reserves to gross loans ratio has a positive impact on performance of Islamic banks and mixed banks as well. This might indicate that more loans loss reserves act as a reservoir in case of some loans that might not be charged off and not of bad quality in general. This can be related with positive impact of liquidity (net loans to total assets ratio) on performance. However, the relationship between asset quality and performance of conventional banks is negative, which is consistent with Kosmidou (2008). Nevertheless, asset quality does not explain the variations in performance of Islamic banks and conventional banks because of its insignificant relationship with performance. Kosmidou et al. (2005) and Dietrich & Wanzenried (2011) found that there is an insignificant relationship between asset quality and performance of banks. 4. Operation efficiency has a significant negative effect on performance of Islamic banks
along with performance of conventional banks and mixed banks. This indicates that more costs deteriorate the performance of banks in Egypt. This conclusion supports the results of Kosmidou (2008) and Karim at al. (2010). Management should give more attention and be more efficient in managing banks' costs.
5. Bank's size has an insignificant positive influence on ROA and ROE of Islamic banks and mixed banks in Egypt. Wasiuzzaman & Tarmizi (2009) and Ramdan et al. (2011) had the same results. Regarding conventional banks, it is found that size has significant negative relationship with their performance which supports the results of Kosmidouet al. (2005) and Pasiouras & Kosmidou (2007) , which means diseconomies of scale and small-size banks perform better than large- size one.
6. Surprisingly, GDP GR has an insignificant influence on performance of Islamic banks, conventional banks, and mixed banks in Egypt and fails to explain the changes in their performance. However, it has a positive relationship with both ROA and ROE of conventional and mixed banks, but negative impact on performance of Islamic banks. 7. Inflation rate is found to have a significant impact only on conventional banks. On the
other hand, it cannot explain the variations in the performance of the other two types of banks. Despite of its insignificant impact, the inflation rate has a positive impact on the performance of the three types of banks. The positive effect of inflation rate supports the conclusions of Bashir (2003), Kosmidou et al. (2005), and Izhar & Asutay (2007). This might be due to the anticipation of banks toward inflation rate (Perry, 1992).
This study has also some limitations. It covers only the data of banks that are listed in the Egyptian stock exchange (EGX) and their financial statements that are disseminated by EGID during the period 2003-2010. There are banks that were delisted from the EGX during the period of study (2003-2010), thus only 13 banks have been included in the study. Also, those banks which have financial statements that do not cover this period have been excluded from the study.
The period of the study did not exceed 2010 because of the Egyptian revolution that took place on the 25th January 2011, which is an extraordinary circumstance and may well have an abnormal effect of the financial performance of banks in Egypt. Further, we could not get the data required to calculate some ratios, such as impaired loans to gross loans ratio as an attempt to get more precise results. Only two pure Islamic banks exist in Egypt which are Faisal Islamic bank of Egypt and Al Baraka Islamic bank. Abu-Dhabi Islamic bank has been excluded from the list of Islamic banks in Egypt, since the National bank for Development was converted to Abu-Dhabi Islamic bank in 2009, and it was a conventional bank before that date.
However, the results of the study may have some important implications and recommendations for future studies. The findings of this study can provide the managers of Islamic banks in Egypt with better understanding of the most significant variables that contribute to improving the performance of Islamic banks in Egypt. It is clear for the managers of Islamic banks that over costs have their negative impact on the ROA and ROE of Islamic banks and this can be noticed from the negative relationship between costs to income ratio and the performance of Islamic banks under the different models. Moreover, it is concluded that conventional banks are performing better than Islamic banks, although both banking modes are affected by the same variables that, in most cases, have the same effect on both modes of banking.
Further studies may cover other fields of performance measurement such as effectiveness, economy, efficiency, prudence and soundness of Islamic banks in Egypt. Future researches may cover more ratios as proxies of variables that influence the performance of Islamic banks in Egypt. Researches should be designed as a case study that includes only Faisal Islamic Bank of Egypt and Al Baraka Islamic Bank including more measures for performance, in addition to more explanatory variables for longer time period to have a closer eye on the financial performance of the three banking modes in Egypt. Also, future studies should compare the financial performance of Islamic banks in Egypt pre and post the 25th January 2011 revolution. Future studies may include Abu-Dhabi Islamic bank in the list of Islamic banks in Egypt as there is a probability that the results of analysis might be changed by adding banks to the list. Additionally, a comparative study between Islamic banks in Egypt and Islamic banks in the Middle East (such as Kingdom of Saudi Arabia, Kingdom of Bahrain, UAE, etc.) can shed some light to a better understanding of this vital sector.
References
Abdeldayem, Marwan.M., 2009. An Examination of Social Disclosure by Islamic Banks: Evidence from UAE. Journal
of American Academy of Business, Cambridge, 14(2).
Abdeldayem Marwan M and Saad Darwish, 2018, Does Risk Perception Influence the Accuracy of Decisions in the Arab Culture?, International journal of Applied Business and Economic Research, (16)
Abdeldayem Marwan M and Saeed Hameed Aldulaimi, 2018, The Economic Islamicity Index, between Islamicity and Universality: Critical Review and Discussion, International Business Management, (12), 46-52
Abdus Samad & Hassan, M.K., 2000. The Performance of Malaysia Islamic Bank during 1984-1997: An Exploratory Study. International Journal of Islamic Financial Services, 1(3).
Aggarwal, R. & Youssef, T., 2000. Islamic Banks and Investement Financing. Journal of Money, Credit, and Banking. Akhtar, M.F., Ali, K. & Sadaqat, S., 2011. Factors Influencing The Profitability of Islamic Banks of Pakistan.
International Research Journal of Finance and Economics.
Al-Kassim, F.A., 2005. The Profitability of Islamic and Conventional Banking in the GCC Countries: A Comparative Study. Journal of Review of Islamic Economics.
Alper, D. & Anbar, A., 2011. Bank - Specific and Macroeconomic Determinants of Commercial Bank Profitability: Empirical Evidence from Turkey. Business and Economics Research Journal, 2(2).
Ariss, R.T., 2010. Competitve Conditions in Islamic and Conventional Banking: A Global Perspective. Review of Financial Economics.
Bashir, A.-M., 2003. Determinants of Profitability in Islamic Banks: Evidence from Middle East. Islamic Economic Studies, 11(1).
Beck, T., Demirguc-Kunt, A., Laeven, L. & Levine, R., 2008. Finance, Firm, Size, and Growth. Journal of Money, Credit, and Banking.
Boyd, J.H., Levine, R. & Smith, B.D., 2000. The Impact of Inflation on Financial Sector Performance. Journal of Monetary Economics.
Darwish Saad (2015) Strategies to shape the future of Islamic Financial Risk Management and Takaful Insurance – Journal of Islamic Banking and Finance, Vo. 3, No. 1, pp. 01-13.
Diaw, A. &Mbow, A., 2011. A Comparative Study of the Returns on Mudarabah Deposit and on Equity in Islamic Banks. www.emerlaldinsight.com/0828-8666.htm, 27(4).
Dietrich, A. &Wanzenried, G., 2011. Determinants of Banks Profitability Before and During The Crisis: Evidence from Switzerland. Journal of International Financial Markets, Institutions and Money, 21.
Ghazali, M.B., 2008. The Bank Specific and Macroeconomic Determinants of Islamic Banks: Some International Evidence. MBA Dissertation, University of Malaya.
Gul, S., Irshad, F. & Zaman, K., 2011. Factors Affecting Bank Profitability in Pakistan. The Romanian Economic Journal.
Haron, S., 1996. Competition and Other External Factors of The Profitability of Islamic Banks. Islamic Economies Studies, 4(1).
Haron, S., 2004. Determinnats of Islamic Banks Profitability. Global Journal of Finance and Economies, 1(1). Hassan, M.K. & Bashir, A.-M., 2003. Determinants of Islamic Banking Profitability. Paper presented at The Economic Research Forum .
Idris, A.R. et al., 2011. Determinant of Islamic Banking Institutions' Profitability in Malaysia. World Applied Sciences Journal.
Izhar, H. &Asutcy, M., 2007. Estimating The Profitability of Islamic Banking: Evidence from Bank Muamalat Indonesia. Review of Islamic Economics, 11(2).
Jaffar, M. &Manarvi, I., 2011. Perfromance Comparison of Islamic and Conventional Banks in Pakistan. Global Journal of Management and Business Research, 11(1).
Javaid, S., Anwar, J., Zaman, K. & Abdul Gafoor, 2011. Determinants of Bank Profitability in Pakistan: Internal Factor Analysis. Mediterranean Journal of Social Sciences, 2(1).
Karim, B.K., Sami, B.A.M. &Hichem, B.K., 2010. Bank- Specific, Industry- Specific and Macroeconomic Determinants of African Islamic Banks' Profitability. International Journal of Business and Management Science, 3(1).
Kerr, S., 2007. DIFC raises $1.25bn via sukuk. Financial Times.
Kosmidou, K., 2008. The Determinants of Banks' Profit in Greece During The Period of EU Financial Integration. Managerial Finance, 37(3).
Case of Different Countries. Qualitative Research in Financial Markets, 4(2).
Masruki, R., Ibrahim, N., Osman, E.m. & Abdul Wahab, H., 2011. Financial Performance of Malaysian Founder Islamic Banks versus Conventional Banks. Journal of Business and Policy Research, 6(2).
Pasiouras, F. &Kosmidou, K., 2007. Factors Influencing The Profitability of Domestic and Foreign Commercial Banks in the European Union. Research in International Business and Finance, 21.
Perry, P., 1992. Do Banks Gain or Lose from Inflation. Journal of Retail Banking.
Ramdan, I.Z., Kilani, Q.A. &Kaddumi, T.A., 2011. Determinants of Banks Profitability: Evidence from Jordan. International Journal of Academic Reseach, 3(4).
Sehrich, S. et al., 2012. Financial Performance Analysis of Islamic Banks and Conventional Banks in Pakistan:A Comparative Study. Interdisciplinary Journal of Contemporary Research in Business, 4(5).
Smaoui, H. & Salah, I.B., 2012. Profitability of Islamic Banks in The GCC Region. Global Economy and Financial Journal.
Smirlok, M., 1985. Evidence on The (Non) Relationship Between Concentration and Profitability of Banks. Journal of Money, Credit, and Banking, 17(1).
Teng, K.Y., Wei, T.K., Yong, T.S. & Siew, Y.M., 2012. The Determinants of Islamic Banks Profitability in Malaysia. A Research Project Submitted in Partial Fulfillment of The Requirement for The Degree of Bachelor of Business Administration (HONS) Banking and Finance.
Wasiuzzaman, S. &Tarmizi, H.-A.B.A., 2009. Profitability of Islamic Banks in Malaysia: An Empirical Analysis. Journal of Islamic Economics, Banking, and Finance, 6(4).