ORIGINAL ARTICLE
EASY WAY TO LEARN STANDARDIZATION :
DIRECT AND INDIRECT METHODS
Nyi Nyi Naing
Unit of Biostatistics & Research Methodology School of Medical Sciences, Universiti Sains Malaysia
16150 Kubang Kerian, Kelantan, Malaysia
In direct age-adjustment, a common age-structured population is used as standard. This population may actually exist (e.g., United States population, 1999) or may be fictitious (e.g., two populations may be combined to create a standard). In indirect age-adjustment, a common set of age-specific rates is applied to the populations whose rates are to be standardized. The simplest and most useful form of indirect adjustment is the standardized mortality ratio (SMR) (5).
Key words : easy way, standardization methods, direct, indirect
Introduction
Comparing mortality and morbidity rates in two or more different geographic areas is important for the evaluation of community health status. As there is a possibility of having different frequency distributions in different populations, a comparison between crude rates would be misleading since crude rates are not very informative about the health status of a population. Standardization for the characteristic(s) responsible for the differences in comparison is necessary. Age and sex are two of the most common variables used for standardization and they are called standardized rates. The difference between crude rates and standardized rates is that crude rates are calculated based on the population under study as a whole whereas standardized rates are based on particular characteristic(s) as standard (Figure 1). If the rates are calculated based on the specific characteristic(s), they are called specific rates (e.g. age specific mortality rate).
This article attempts to help health personnel in the selection and utilization of appropriate standardization methods using illustrated
standardization. For the example purpose, let us concentrate on the standardization methods based on age-standardized rates.
When age-specific mortality rates for two or more populations are known, direct standardization method can be applied.
Procedure for direct standardization
Figure 1: Concept of direct standardization
Population (s) of Interest
Age-specific Mortality
Rates (Known)
Standard Population
Compare the Age-adjusted Mortality
Rates
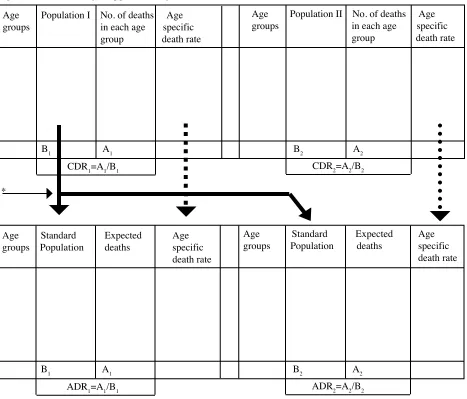
Figure 2: Procedure for application of direct standardization method
Age Population I No. of deaths Age groups in each age specific
group death rate
Age Population II No. of deaths Age groups in each age specific
group death rate
B1 A1
CDR1=A1/B1
B2 A2
CDR2=A2/B2
Age Standard Expected Age groups Population deaths specific
death rate
B1 A1
ADR1=A1/B1
B2 A2
ADR2=A2/B2
Age Standard Expected Age groups Population deaths specific
death rate *
Summation of the total number of expected deaths
Population A = 1186.18 Population B = 1158.99
Age adjusted death rate for population A = 1186.18 x 1000
Age adjusted death rate for population B = 1158.99 x 1000
51,000
= 22.7 per 1,000 population
Commenting on age-adjusted rates, in fact the risk of death is higher in population A than in population B. It has clearly shown that you may have
Example1
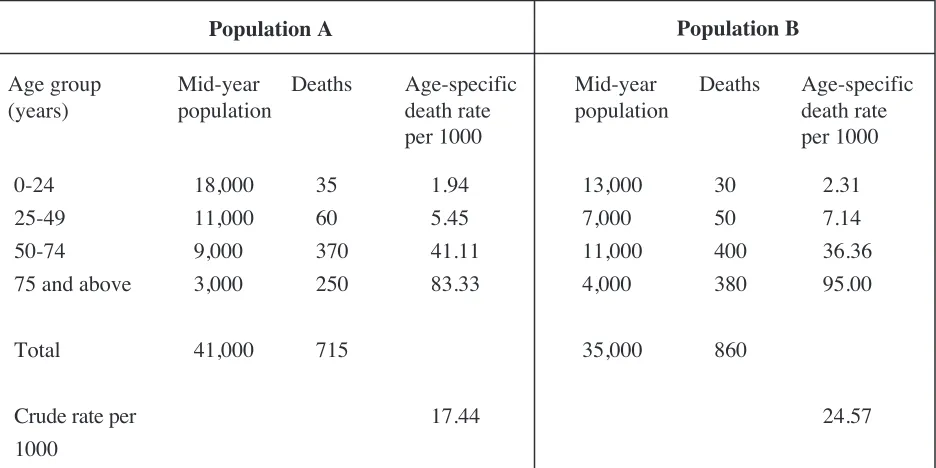
Table 1: Age-groups, deaths and mid-year populations of two different populations
Commenting on crude death rates, population B seems to have higher death rates than population A As an example, let us say the national population has been chosen as the reference population, the calculation will therefore be as follows in table 2
Table 2: Calculation of expected deaths by applying direct standardization method
Age group Reference Age-specific Expected Age-specific Expected (years) population death rate deaths death rate deaths
per 1000 per 1000
0-24 25-49 50-74 75 and above
Total 11,000 17,000 20,000 3,000 51,000 21.34 92.65 822.20 249.99 1186.18 1.94 5.45 41.11 83.33 2.31 7.14 36.36 95.00 25.41 121.38 727.20 285.00 1158.99 Age group Mid-year Deaths Age-specific Mid-year Deaths Age-specific (years) population death rate population death rate
per 1000 per 1000
0-24 25-49 50-74 75 and above
Total
Crude rate per 1000 18,000 11,000 9,000 3,000 41,000 35 60 370 250 715 1.94 5.45 41.11 83.33 17.44 13,000 7,000 11,000 4,000 35,000 30 50 400 380 860 2.31 7.14 36.36 95.00 24.57
Population A Population B
Age Population II No. of deaths Age groups in each age specific
group death rate When Age-specific mortality rates of the population (s) of interest are unknown, indirect standardization method is applied
Figure 3: Concept of indirect standardization Age-specific
Mortality Rates (unknown)
Compare the adjusted mortality Rates Population (s)
of Interest Reference
Population
Compare the Standardized mortality Ratios
of the population(s) of
interest
Age Population II Expected Age groups deaths specific
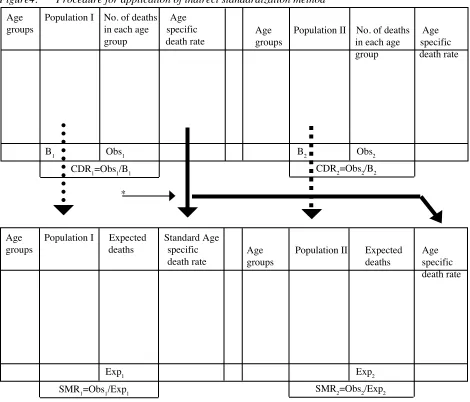
death rate Figure4: Procedure for application of indirect standardization method
Age Population I No. of deaths Age groups in each age specific
group death rate
B1 Obs1
CDR1=Obs1/B1
B2 Obs2
CDR2=Obs2/B2
Age Population I Expected Standard Age groups deaths specific
death rate
Exp1
SMR1=Obs1/Exp1
Let us see the second method which is an indirect standardization.
Procedure for indirect standardization
Choose a reference or standard population. Calculate the observed number of deaths in the population (s) of interest. Apply the age-specific mortality rates from the chosen reference population to the population(s) of interest. Multiply the number of people in each age group of the population(s) of interest by the age-specific mortality rate in the comparable age group of the reference population. Sum the total number of expected deaths for each population of interest. Divide the total number of observed deaths of the population(s) of interest by the expected deaths (figure 4) (1-4).
The ratio of the observed number of deaths
to the expected number of deaths is called: “Standardized mortality ratio” or SMR
SMR = Observed number of deaths Expected number of deaths
Adjusted mortality rates (AMR) can be calculated by the following
formula:-Adjusted mortality rates = Standardized mortality ratio x crude death rate
AMR= SMR x CDR (Standard)
(* Note : if the age-specific mortality rates of the reference population is applied, Crude Death Rate must be calculated from that reference population.)
Age Population Age-specific Expected Population Age-specific Expected
group mortality rate deaths mortality rate deaths
per1000 per1000
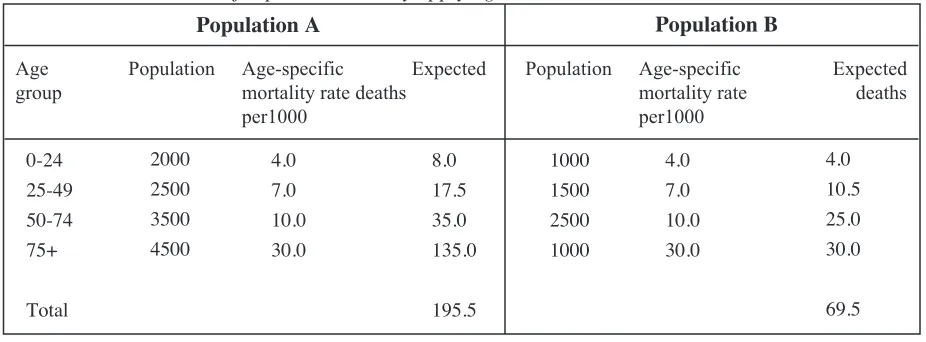
0-24 25-49 50-74 75+
Total
2000 2500 3500 4500
4.0 7.0 10.0 30.0
8.0 17.5 35.0 135.0
195.5
1000 1500 2500 1000
4.0 7.0 10.0 30.0
4.0 10.5 25.0 30.0
69.5
Example (2)
Let us say the observed deaths in the populations A and B are as follows:
Observed deaths in population A=120 Observed deaths in population B= 30
Table 3: Calculation of expected deaths by applying indirect standardization method
Division of the total number of observed deaths by the total number of expected deaths SMR for population A = 120 = 0.61
195.5
SMR for population B = 30 = 0.43 69.5
The risk of death is in fact higher in population A than population B after adjusting for differences by age. Common practice is to compare (SMR) in indirect method.
Conclusion
Standardization methods are not difficult but sometimes the health personnel have some confusion about selecting which method and how to calculate and apply the particular method. It is sincerely hoped that this article may at least contribute to public health medicine by improving the understanding of standardization methods in comparing two or more different populations, which have difference(s) in some characteristic(s).
Correspondence :
Nyi Nyi Naing
Unit of Biostatistics & Research Methodology School of Medical Sciences
Universiti Sains Malaysia
16150 Kubang Kerian, Kelantan, Malaysia
References
1. David J. Hall, Standardization and life tables. Islamic World Medical Journal. 1984 ; 14(4) :22-25. 2. Christie D, Gordon I and Heller R. Epidemiology.
Mortality and Morbidity: Comparisons of time and place. 1994 ; 4 : 26-36.
3. Health Indicators. Epidemiology A, Basic Methods Module.Center for Clinical Epidemiology and Biostatisitcs. University of Newcastle, Australia, 1998 :12-20.
4. Supanvanich S., Podhipak A. Principles of Epidemiology. 1993 :103-109