Nevin, Owen and Gilbert, Barrie K. (2001) Further analysis of humanbear interactions: a supplement to "BC bear viewing: an analysis of bearhuman interactions, economic and social dimensions with recommendations for best practices". Department of Fisheries and Wildlife, Utah State University, Logan, Utah, US. (Unpublished)
Downloaded from: http://insight.cumbria.ac.uk/id/eprint/874/
Usage of any items from the University of Cumbria’s institutional repository ‘Insight’ must conform to the following fair usage guidelines.
Any item and its associated metadata held in the University of Cumbria’s institutional repository Insight (unless stated otherwise on the metadata record) may be copied, displayed or performed, and stored in line with the JISC fair dealing guidelines (available here) for educational and notforprofit activities
provided that
• the authors, title and full bibliographic details of the item are cited clearly when any part of the work is referred to verbally or in the written form
• a hyperlink/URL to the original Insight record of that item is included in any citations of the work
• the content is not changed in any way
• all files required for usage of the item are kept together with the main item file.
You may not
• sell any part of an item
• refer to any part of an item without citation
Further Analysis of Human - Bear
Interactions
A Supplement to "BC Bear Viewing: An Analysis of Bear - Human Interactions, Economic and Social Dimensions with Recommendations for Best Practices"
Owen T. Nevin and Barrie K. Gilbert
Department of Fisheries and Wildlife Utah State University
Logan, Utah 84322-5210
Acknowledgements:
Contents
Contents... 1
1. Introduction ... 2
2. Methods... 2
3. Summary of Results ... 3
4. Human Activity Patterns ... 4
4.1. Daily and Seasonal Patterns ... 4
4.1.1. Bear Viewing... 4
4.1.2. Hunting Closure ... 5
4.1.3. Proximity of Viewers to Bears ... 5
5. Bear Activity Patterns ... 6
5.1. Age/Sex Class Distribution of Population ... 6
5.2. Time Spent Fishing ... 8
5.2.1. Analysis by Age/Sex Class ... 8
5.2.2. Analysis For All Bears ... 9
5.3. Fish Capture Rates ... 10
5.4. Bioenergetic Effects ... 11
5.4.1. Activity Budgets and Fishing Success ... 11
5.4.2. Human Disturbance... 11
6. Recommendations ... 13
6.1. Viewing Infrastructure ... 13
6.2. Management of Viewing... 13
6.2.1. Setting and Controlling Viewing Periods... 13
6.2.2. Guide Training ... 14
6.3. Research ... 14
6.3.1. Home Ranges of Bears Using this Area... 14
6.3.2. Availability of Alternative Feeding Sites... 14
1.
Introduction
This report is a supplement to Nevin, Gilbert and Smith (2001) "BC Bear Viewing: An Analysis of Bear - Human Interactions, Economic and Social Dimensions With
Recommendations for Best Practices".
In early 2001 the Ministry of the Environment, Lands and Parks, British Columbia (MELP) and British Columbia Assets and Lands (BCAL) instituted tenured viewing at the Glendale spawning channel for the 2001 season based on our findings and
recommendations (Nevin et al. 2001, Nevin and Gilbert 2000). Here we outline the changes in human and bear activity patterns resulting from more regulated viewing and make further recommendations for management and research in the Glendale Cove area of British Columbia.
2.
Methods
In this, the third year of study of the impacts of viewing on bear behavior in the Glendale Cove area of Knight Inlet, British Columbia, Canada, observations were structured to supplement 1999 and 2000 observations.
3
3.
Summary of Results
Through spring, summer and fall of 2001 44 bears were identified in the Glendale Valley. Among these, 28 were adult, which is comparable to the same periods in 1999 and to spring and summer of 2000. Unlike 2000, however, these bears were active in the area during the fall salmon run.
Salmon were first seen in the Glendale River in mid-August when more than 1.5 million fish returned by the peak of the season. The total run may have approached 2 million. As with previous years, systematic observations sampled the entire 24-hour cycle. Bears were observed fishing both during the day and at night in contrast to 2000, when bears were not observed fishing through the night. Fishing continued through November when we terminated the study.
The following is a summary of observations; details are provided in section 5: Many of the bears missing during the fall of 2000 returned during 2001.
Under all viewing conditions the proportion of activity accounted for by each age/sex class differed significantly from their proportions in the population.
As in 1999, members of the age/sex class Females with Cubs spent proportionally more time fishing when commercial bear tours were present.
When commercial bear tours were present the proportion of time that all bears spend fishing did not change between 1999, 2000 and 2001. (This did not effect all age sex classes equally. See Section 5.2.1.)
Large Males avoided human activity.
Additional support was obtained for the hypothesis that subordinate age/sex classes are using viewing periods as temporal refugia from large male bears
Fish capture rates increased significantly in 2001.
Fish capture rates were not affected by the presence of bear viewing tours.
With the return of Large Males to the site, the caloric value of salmon consumed by Females with Cubs decreased to the level seen in 1999.
The tenure agreement was violated by bear tour operators during 12% of observed viewing periods.
4.
Human Activity Patterns
4.1.Daily and Seasonal Patterns
4.1.1. Bear Viewing
Bear viewing tours operate in Glendale Cove from early May through mid October. Early season tours mainly consist of boat based viewing from the cove. During the salmon run, bears were observed from 4 permanent viewing-structures owned by Knight Inlet Lodge and vehicle based viewing operated by Tide Rip/SailCone.
During the 2001 season, viewing of bears at the weir began on August 24th and continued until October 20th.
BCAL permitted 50 visitor-viewing periods per day during the salmon run. These visitor-viewing periods were assigned to the Glendale Management Corporation and allocated between the member companies as follows:
Knight Inlet Lodge
- a maximum of 36 visitor-viewing periods per day (including guides) - a maximum of 14 viewers (including guides) during any viewing period - 3 viewing periods per day (0700-0900, 1300-1500 and 1600-1800) Tide Rip/SailCone
- a maximum of 14 visitor-viewing periods per day (including guides) to be allocated between the companies
- a maximum of 14 viewers (including guides) during any viewing period - 1 viewing periods per day (1000-1200)
No viewing was allowed anywhere on the spawning channel outside of the prescribed viewing periods or at any time by a non-tenured commercial viewing operation. All viewing was to be static, i.e. bears were not to be pursued by vehicle based viewers, and located between the weir and the junction of the spawning channel and the natural river. In an attempt to provide fishing opportunities for bears sensitive to viewing, no viewing was allowed in the upper sections of the spawning channel.
On the whole, compliance with tenure regulations was good during the 2001 season with upper threshold viewing densities (Nevin and Gilbert 2000) being exceeded on only 17% of days during the viewing season. There were no visits to the spawning channel by non-tenured commercial tour operators. However, non-tenured operators did bring clients ashore in Glendale Cove. Unlike the 2000 season there were no visits by private individuals to the spawning channel area. The Glendale Management Corporation
5 Corporation operates; stand based viewing had a violation rate of 5% while vehicle based viewing had a violation rate of 64%.
4.1.2. Hunting Closure
The 17.5 km2 (approximately 3.3km x 5.3km) hunting closure around the Glendale River spawning channel remains in place. This closure includes the valley bottom from the estuary upstream to the spawning channel and continues upstream towards Glendale Lake and has been in effect since 1995.
The three-year moratorium on brown bear hunting in British Columbia introduced on February 8th 2000 closed the spring bear hunt in 2001 and, while this moratorium was repealed, the Glendale area remained closed to legal hunting in the fall season in 2001.
4.1.3. Proximity of Viewers to Bears
5.
Bear Activity Patterns
Analysis of bear behavior and activity patterns is based on more than 900 hours of observations at the Glendale River artificial spawning channel during salmon run. All observations were made from the Knight Inlet Lodge viewing structure nearest to the weir. Cubs were excluded from this analysis since they replicate their mother's activity patterns. The age/sex class Other Males in Nevin and Gilbert (2000) has been more appropriately titled Subadults in this report. These age/sex classes are, however, comparable.
Unless otherwise stated all results are statistically significant at = 0.05.
5.1.Age/Sex Class Distribution of Population
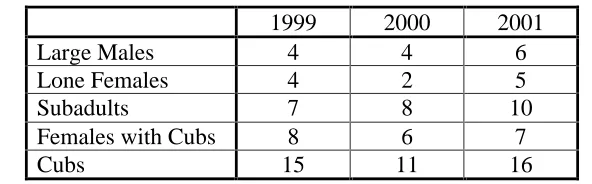
Between early-May and early-November 2001 44 bears were identified in the Glendale Cove area. This is comparable with the 38 bears identified in 1999 and 31 bears identified in 2000 (Table 5.1.1).
Table 5.1.1: Identified Bears
1999 2000 2001 Large Males 4 4 6 Lone Females 4 2 5 Subadults 7 8 10 Females with Cubs 8 6 7 Cubs 15 11 16
While some bears were not visibly active in the Glendale area during the spring or summer months, all the identified bears were seen during the fall salmon run on the Glendale River.
7 The number of bears present is not significantly different between viewing and non-viewing periods and there is no significant change in the age/sex structure of the
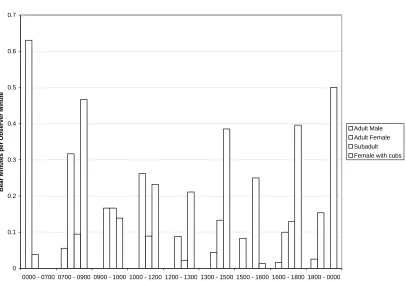
population of active bears. This reflects the fact that Large Males did not use the 1-hour non-viewing periods provided by the 2001 viewing schedule. The strong preference of Adult males for the early morning, pre-viewing period can be seen in Figure 5.1.1.
Table 5.1.2: Age/Sex Class Distributions
Tours Absent
Observed Greater than (+) or Less than (-): % of 2001
Population
% of Observed Bear Minutes in 2001 Expected 2001 Observed 2000 Observed 1999 Large
Males 21 4 - + - Lone
Females 18 20 0 + 0 Sub-adults
36 22 - 0 0 Females
with Cubs 25 54 + - +
Tours Present
Observed Greater than (+) or Less than (-): % of 2001
Population
% of Observed Bear Minutes in 2001 Expected 2001 Observed 2000 Observed 1999 Large
Males 21 5 - + - Lone
Females 18 29 + + 0 Sub-adults
36 19 - 0 0 Females
with Cubs 25 47 + - +
Figure 5.1.1:Temporal Activity Patterns
5.2.Time Spent Fishing
5.2.1. Analysis by Age/Sex Class
Table 5.2.1: Proportion of Active Time Spent Fishing
Tours Absent Tours Present % of Observed
Bear Minutes
% of Observed Bear Minutes +/-Large Males 56 88 + Lone Females 73 70 0 Subadults 72 72 0 Females with Cubs 55 68 +
0 0.1 0.2 0.3 0.4 0.5 0.6 0.7
0000 - 0700 0700 - 0900 0900 - 1000 1000 - 1200 1200 - 1300 1300 - 1500 1500 - 1600 1600 - 1800 1800 - 0000
9 Table 5.2.2: Change in the Proportion of Active Time Spent Fishing
2001 Greater than (+) or Less than (-): 1999 2000 Tours Absent Tours Present Tours Absent Tours Present Large Males - + * * Lone Females - 0 * * Subadults 0 + 0 0 Females with Cubs 0 0 - 0
* No observations in 2000
5.2.2. Analysis For All Bears
Table 5.2.3: Proportion of Active Time Spent Fishing
Tours Absent Tours Present % of Observed
Bear Minutes
% of Observed Bear Minutes
+/-All Bears 62 70 +
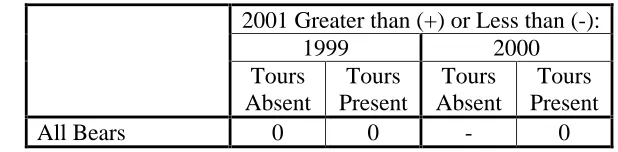
Table 5.2.4: Change in the Proportion of Active Time Spent Fishing
2001 Greater than (+) or Less than (-): 1999 2000 Tours Absent Tours Present Tours Absent Tours Present All Bears 0 0 - 0
Unlike previous years, in 2001 tours by all operators were restricted to four 2-hour periods per day. This left three 1-hour non-viewed periods throughout the day (0900-1000, 1200-1300 and 1500-1600) as well as the overnight period (1800-0700). During the 2000 season, in the absence of Large Male bears, Females with Cubs
increased their time spent feeding during non-viewed periods to the level observed during viewing in 1999 and 2000. While Large Male bears generally did not make use of the 1-hour non-viewed periods available in 2001, Females with Cubs that were present at these times showed a significant decrease in the proportion of time devoted to fishing
The high proportion of time spent fishing by Large Males with tours present seen in Table 5.2.1 reflects the activity of one bear during the 1600-1800 viewing period on several days early in the salmon run. With very little other Large Male activity with tours present, this has a disproportionate effect on the mean value.
Subadults maintained the behavior patterns observed in 2000 with the proportion of time spent on fishing behaviors equal between viewed and non-viewed periods. The
proportion of time spent fishing by this age/sex class did not differ from that observed in 2000 or during non-viewed periods in 1999. It is unclear whether this is due to increased subadult habituation to viewing activities. Since Subadults were never active at the spawning channel between the end of viewing at 1800 and the resumption of viewing at 0700 (see Figure 5.1.1) their almost complete temporal avoidance of Adult Males may have allowed them to behave in a more uniform manner when they were active. A doubling of the proportion of time spent in vigilance behaviors between viewed and non-viewed periods adds strength to the hypothesis that subordinate age/sex classes are using viewing periods as temporal refugia from the threat of large male bears.
As mentioned in Section 4.1.1, the viewing density at which the level of disturbance begins to increase rapidly was exceeded on only 17% of days during the viewing season at the spawning channel. This is significantly less than either the 1999 or 2000 season.
5.3.Fish Capture Rates
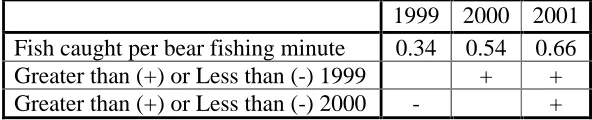
Again in 2001 there was no significant difference in the number of fish caught per minute spent fishing (catch per unit effort) by bears between viewed and non-viewed periods. There was, however, a significant increase in capture rate in 2001 compared to 2000.
Table 5.3.1: Fish Capture Rates
1999 2000 2001 Fish caught per bear fishing minute 0.34 0.54 0.66 Greater than (+) or Less than (-) 1999 + + Greater than (+) or Less than (-) 2000 - +
11
5.4.Bioenergetic Effects
5.4.1. Activity Budgets and Fishing Success
Bear activity, measured in bear minutes per observer minute, at the spawning channel during 2001 (0.60) was not significantly different from 2000 (0.47). There was, however, substantially more activity in the Glendale Valley as a whole. The 2001 season was notable not only for the return of the population to pre-September 2000 levels but also for the unusually high level of bear activity in the estuary throughout the salmon season. Large numbers of pre-spawning fish died from a lack of oxygen, resulting from record high salmon numbers in the Glendale River. These fish provided excellent feeding opportunities in the estuary, which have not existed in previous years.
While activity level at the spawning channel remained lower than that seen in 1999 (1.91) patterns of bear behavior returned to those seen in that year (see section 5.2). Detailed analysis of salmon consumption by Females with Cubs for the 2000 season indicates that the energetic value of fish consumed increased over 60% from 1999 values. With the return of Large Males to the system in 2001, energy intake by Females with Cubs returned to approximately 1999 levels.
5.4.2. Human Disturbance
In light of the return to the Glendale Valley of many bears missing during the 2000 salmon season, the unregulated and chaotic viewing regimen that year likely accounts for the site abandonment seen in September 2000. It is still not known what impact this had on the bears that disappeared. Due to the presence of the artificial spawning channel, the Glendale drainage has the most abundant and accessible salmon run in this area.
Abandoning this site to feed elsewhere would therefore lead to lower net energy gain for those individuals.
It is becoming clear that human disturbance, in the form of regulated viewing, can provide a feeding refuge for subordinate age/sex classes, especially Females with Cubs. The total displacement of Large Males from the drainage in 2000 allowed Females with Cubs to feed at maximal rates. This, however, leads to neither healthy bear populations nor good viewing. In the context of a source-sink model of BC bear populations, where protected feeding sites act as source populations, human activity levels which force particular age/sex classes to abandon protected sites may lead to increased exposure to risk of mortality for these age/sex classes outside the protected area. Additionally, without the perception of risk from Large Males, there is no advantage for Females with Cubs, a popular age/sex class with ecotourists, to feed while tours are present. This leads to activity patterns that are independent of human activity patterns resulting in lower sighting frequencies during viewing as experienced during the 2000 season.
was also more similar to that seen in 1999. One major change between 1999 and 2000 was the increased use of the 1000-1200 time period. It should be noted that this viewing period experienced both the highest frequency of tenure violations and the lowest level of bear activity. Tenure violations are not a biologically useful measure of disturbance, since, for example, arriving 25 minutes early, staying 5 minutes too long, exceeding allowed visitor number and pursuing a bear with vehicle, would all be considered
13
6.
Recommendations
6.1.Viewing Infrastructure
It remains our recommendation that there be no further development of new viewing locations at bear feeding sites on the Glendale River until further study has been completed of bear access to other fishing sites.
Further reduction of vehicular traffic close to the weir would be another step in the process of reducing the impacts of viewing. Removing vehicles entirely in the vicinity of the weir remains our long-term recommendation.
The 1-hour, non-viewed periods in the 2001 viewing schedule (0900-1000, 1200-1300 and 1500-1600) did not prove to be useful as feeding opportunities for disturbance-sensitive age/sex classes. Consolidating the viewing day by removing the 1-hour non-viewed periods would provide significantly more undisturbed time for the bears in the morning and evening, when disturbance-sensitive age classes choose to feed. The current 1-hour gap between the departure of one viewing group and the arrival of the next leads to two distinct disturbance events at each changeover. With the removal of this gap, departure/arrival of adjacent viewing groups becomes a single disturbance event. Additional benefits include reduced traffic at the weir and the absence of the bus during viewing sessions.
6.2.Management of Viewing
6.2.1. Setting and Controlling Viewing Periods
If multiple operators continue to bring tours to the Glendale area, careful regulation of viewing periods must continue. Enforcement visits during the 2001 season were a useful addition to a stronger tenure agreement. Coordination of consistent viewing protocols among tenured operators will further reduce the impact of viewing on bears. The inconsistency of vehicle based viewing in the 1000-1200 viewing session should be eliminated by the use of the existing viewing structures for all viewing at the spawning channel. Making the use of the viewing structures a condition of tenure for 2002 will also eliminate highly disturbing mobile viewing seen in previous seasons when bears were followed when they chose to feed in areas of the spawning channel away from the viewing structures.
appropriate bear viewing. If an operator has invested heavily in the site, the incentive is even clearer. For these reasons we recommend a single operator for any future bear viewing site.
6.2.2. Guide Training
We continue to recommend that all staff who accompany guests should, at the very least, attended a 3-4 hour training course and have a minimum of 1/2 day of field training.
6.3.Research
6.3.1. Home Ranges of Bears Using this Area
The disappearance of so many bears from the Glendale drainage in the summer of 2000 is still not understood. It is imperative, for the definition of a protected zone for resident bears, to identify the home ranges and access routes (mountain passes). Males returning to the estuary in breeding season should be the focus of satellite telemetry studies proposed for 2002 to establish home ranges, patterns of seasonal use and travel routes. These bears should also be marked with subcutaneous microchips (PIT tags) and tetracycline to aid in identification and the anti-poaching effort. It is of the utmost importance to the conservation and management of this population that we have an understanding of the home ranges of its members.
6.3.2. Availability of Alternative Feeding Sites
15
7.
References
Nevin, O.T. and B.K. Gilbert. 2000 Evaluation of a model bear viewing program at
Glendale River with policy recommendations. Logan, UT: Utah State University,
Department of Fisheries and Wildlife.