Published by Faculty of Science, Kaduna State University
CRYSTAL VIOLET REMOVAL FROM AQUEOUS SOLUTION
USING CORN STALK BIOSORBENT
Usman Lawan Muhammad1, Zakariyya Uba Zango2, Haliru Aivada Kadir3, Armaya’u Usman4 1, 2, 4 Department of Chemistry, Al-Qalam University Katsina, P.M.B 2137, Katsina Nigeria 3 School of Chemical Sciences, Universiti Sains Malaysia, 11800 Pulau Penang, Malaysia
*Corresponding Author Email Address:2[email protected]
Other Authors Email Addresses: 1[email protected], 2[email protected], 3[email protected] 4[email protected]
ABSTRACT
The objective of this study was to evaluate the potential, suitability and efficiency of corn stalk (CS) for the removal of Crystal Violet (CV) dye from aqueous solution. Adsorption studies were conducted under different operational parameters such as effect of initial dye concentrations (10, 20, 30, 40 and 50 mg/L), contact time, pH and sorbent doses (0.1, 2.0, 15.0.2, 0.25 and 3.0g). Adsorption isotherms utilized were Langmuir and Freundlich models, while kinetics was verified using pseudo-first-order and pseudo- second-order models. The sorption processes is best described by the Langmuir isotherm and pseudo-second order kinetic model since it showed better fitting and high coefficient of determination (R2 > 0.98). It was found that percentage removal
of the dye increases as pH increases from acidic to basic region.
Keywords: Adsorption, Crystal violet (CV), Cornstalk (CS).
INTRODUCTION
Discharge of dye constituted effluent into natural streams and rivers poses severe problems to the aquatic life, food web and causes damage to the aesthetic nature of the environment(Annadurai et al., 2002). The presence of dyes in our water bodies hinders photosynthesis in aquatic plants due to the tendency of dye to absorb and reflect sunlight entering water (Ahmad et al.,2014; Bulut, 2006). The effect become severe as a result of the ability of the complex aromatic structures of the dyes to render the aquatic plant ineffective in the presence of heat, light, microbes, and even oxidizing agents and degradation of the dyes become difficult (Aksu, 2005). Hence, these pose a serious threat to human health and water quality, thereby becoming a matter of vital concern. Dyes can have acute and/or chronic effects on exposed organisms depending on the exposure time and dye concentration. Dyes can cause allergic dermatitis, skin irritation, cancer, mutation, etc. Keeping the essentiality of color removal, concerned industries are required to treat the dye-bearing effluents before dumping into the water bodies(Gonga, 2005; Mafra, 2013).
The manufacture and use of synthetic dyes for dyeing fabrics has become an industry solid. It is estimated that around 700,000 tons of dyes are produced annually around the world and about 20% is discharged as industrial wastes without previous treatment (Ghorai, 2014; El-Maghraby et al.,2011). However, their use has become a matter of serious concern to environmentalists. Synthetic dyes are highly toxic substance causing negative effects on all life forms because they present groups such as sulfur, naphthol, vat dyes, nitrates, acetic acid, surfactants, chromium compounds and metals such as copper, arsenic, lead,
cadmium, mercury, nickel, cobalt and certain auxiliary chemicals(Dogan M, Abak H, 2009)-(Chamarthy, S., S. Seo and Marshall, 2001). Thus, the scientific community shoulders the responsibility of finding economically favorable methods or techniques to curb this problem.
Corn (also known as Maize or Zea mays) is a widely cultivated crop around the world. The by-products such as corn leaf, corn cob, corn husk, and corn stalk are often burnt without utilization in the field. The main composition of corn stalk (CS) is cellulose, hemicellulose and lignin. Thus, CS and other agricultural waste have potential to serve as a renewable agricultural waste available abundantly at little cost(Malik, Ramteke and Wate, 2007)-(Velmurugan, 2001). Crystal violet (CV) belongs to the triphenyl methane family of dyes and is widely used where fastness to light is not of great importance. It has harmful effects on living organisms on short periods of exposure. It is toxic, harmful upon inhalation or ingestion and may cause skin irritation. In extreme cases, it can lead to kidney failure, and cancer(Kumar, 2011, Miyah et al., 2017). Therefore, removal of this dye from water and wastewater is of great importance.
Various low-cost natural adsorbents and agricultural waste materials have been employed for the adsorption of dyes from aqueous solutions (Ansari R, 2010, Banat and Al-Asheh, 2003). Majority of them are found to be efficient for the wastewater treatments and are environmentally friendly. The aim of the present investigations has been to evaluate the efficiency of the removal of crystal violet from aqueous solutions using corn stalk as an easily available and economically viable adsorbent. The effects of contact time, initial dye concentration, pH, and adsorbent dose on the adsorption capacity were investigated to optimize the conditions leading to maximum removal efficiency. The experimental data were evaluated using the pseudo-first-order and pseudo-second-pseudo-first-order kinetic model.
MATERIAL AND METHOD
Raw cornstalk was obtained from Rahamawa village in Batagarawa Local Government of Katsina State, Nigeria in February 2017. Crystal violet dyes were purchased from Sigma Aldrich (USA). The sulfuric acid, hydrochloric acid and sodium hydroxide were obtained from Sinopharm Chemical Reagent Co. Ltd., China. All reagents used in this work are of analytical grade and high purity. Distilled water was used throughout the work.
Adsorbent preparation
The corn stalk collected from the farm was allowed to dry for about two months and the fiber was washed with distilled water and then dried in an oven at 80 °C overnight. Furthermore, it was
Fu
ll L
en
gt
h Rese
ar
ground and screened using a set of sieves to obtain particles size in the range of 50–80 am. The sieve fiber was stored in a desiccator until required. The stock solutions (150 mg/L) of test reagent were made by dissolving the dye in doubly distilled water. Concentration of the dye and absorbance value during the experiment was determined at maximum wavelength of 590 nm using UV-vis spectrophotometer respectively.
Adsorption experiment
In a typical experiment, 50 mL of CV aqueous solution (10 mg/L) was placed in an Erlenmeyer flask. As much as 0.1 g of the CS was added and the resulting mixture was homogenized till equilibrium is attained and filtered afterwards. In order to monitor the variation in absorbance, small portion of the mixture were withdrawn into a cuvette at different intervals of time. All the experiments were conducted at room temperature and repeated twice to ascertain accuracy of the data obtained. The removal efficiency, amount of dye adsorbed at different intervals of time, and at equilibrium were obtained from Equations (1), (2) and (3) respectively.
CV Removal (% R)= 𝐶𝑜−𝐶𝑒 𝐶𝑜
× 10 (1)
𝑞𝑡= (𝐶𝑜−𝐶𝑡)𝑉
𝑤 (2) 𝑞𝑒= (𝐶𝑜−𝐶𝑒)𝑉𝑤 (3)
Where; C0, Ct and Ce is initial, at time and equilibrium
concentrations of the dye (mgL-1), respectively, while w is the
weight of the adsorbent (g) and V is the volume of dye solution (L).
Effects of initial CV concentration
The effect of initial dye concentrations on adsorption of CV onto CS was investigated in the concentration range of 10 – 50 mg/L. As much as 2.5 mg of adsorbent was utilized. Similar procedure as highlighted in section 2.1 were used but at different concentrations.
Effect of adsorbent dosage
The effect of adsorbent dosage on the removal of CV (50 mg/L) concentration was carried out using different weights of the adsorbents (0.1g, 0.15g, 0.2g, 0.25g, and 0.3g). Similar procedures for the batch adsorption study were employed.
Effect of contact time
The effect of contact time was investigated using 0.1g of the adsorbents and 50 mL of the dye solution (10 mg/L). Agitation was done for a time period range of 20 – 100 minutes. Similar procedures as in section 2.1 were employed.
Effect of pH
The effect of pH is paramount in the adsorption studies of dyes. Comparative experiments were carried out by varying the pH values of the CV. Different pH values ranging from 2 to 10 were investigated. The pH was adjusted using 0.1 M HCl and 0.1 M NaOH solutions respectively. As much as 0.15 g of adsorbent and a dye concentration of 50 mg/L were utilized for this experiment.
Adsorption isotherm and Kinetic models
Langmuir model
The Langmuir isotherm is valid for monolayer adsorption onto a surface containing a finite number of identical sites. The model assumes uniform energies of adsorption onto the surface and no transmigration of adsorbates in the plane of the surface. The linear form of the Langmuir's isotherm model is given by the following equation:
Ce qe=
1 Q0b+
Ce
Q0 (4)
Langmuir adsorption parameters can be determined by transforming the Langmuir equation, which is in linear form by the plot between Ce/qe versus Ce (Eq.4) over the entire
concentration range. Where qe is the amount of CV adsorbed in
mg/g of the adsorbent, Ce is the concentration of the dye solution
at equilibrium (mg/L). Qo and b are Langmuir constants related to
the maximum adsorption capacity (mg/g) and the adsorption energy between the Adsorbate and adsorbent (L/mg). The essential features of the Langmuir isotherm may be expressed in terms of equilibrium parameter RL, which is a dimensionless
constant referred to as separation factor or equilibrium parameter. RL=1/ (1+bC0) (5)
Where C0 is the initial concentration and b is the constant related
to the energy of adsorption (Langmuir constant). The values of RL
indicate the nature of the isotherm.
Freundlich model
The Freundlich isotherm model is an empirical equation employed effectively to study the heterogeneity and surface energies. The most common shape of the graph of amount of dye adsorbed per unit weight of adsorbent versus the concentration in the fluid in equilibrium is these data often fit nicely the empirical equation proposed by Freundlich:
Inqe=1nInCe+ InKF (6)
Where, KF and n are, Freundlich constants; qe is the weight
adsorbed per unit weight of adsorbent; Ce = concentration of dye
at equilibrium. The constant KF is an approximate indicator of
adsorption capacity ((mg/g) (L/mg) 1/n), while 1/n is a function of the strength of adsorption respectively in the adsorption process .The values of KF and n can be obtained from the plate of log qe
versus log Ce and they equal to the intercept and slop of the plot
respectively.
Kinetics of adsorption
Pseudo – first order kinetic model:
log( qe− qt) = log qe− k1
2.303t (7)
Where qe (mg/g) and qt (mg/g) are the amounts of dye adsorbed
at equilibrium and at time t and k1 (1/min) is the equilibrium rate
constant of pseudo-first order. The kinetics parameters are obtained from the plot log (qe - qt) against t.
Pseudo – second order kinetic model:
The adsorption mechanism over a complete range of the contact time is explained by the pseudo – second order kinetic model. The integrated linear form of the model is as follows:
t qt
=
1 k2qe2
+
t qe
(8) Where k2 (g/mg min) is the equilibrium rate constant of
pseudo-second order. In this case, the kinetics parameters can be calculated from the plot t/qt against t.
RESULTS AND DISCUSSION
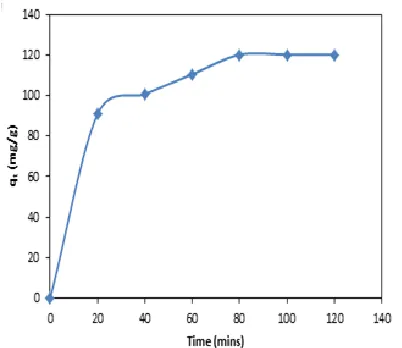
Effect of contact time
The effect of adsorption contact time of Crystal Violet onto Corn stalk was investigated and results are shown in Fig. 1. From the plot, it reveals that the removal of CV onto CS cornstalk is characterized by a rapid adsorption which increases with time. The equilibrium time for the adsorption of the dye was obtained at 12 mg/g using 0.1 g/g for 80 minute. This is shown by the region in Fig. 1 where there is no noticeable change. Considering the above, 80 minutes is adopted as the equilibrium times.
Figure 1: Effect of contact time for the adsorption of CV onto corn stalk
Effect adsorbent Dosage
The effect of adsorbent dosage on the removal of crystal violet dye is shown In Fig 2. The amount of CV adsorbed per unit weight of adsorbent on Cornstalk was found to decrease from 19.0 mg/g to 3.9 mg/g upon increase in adsorbent dosage. This trend could be as a result aggregation of particle caused by the adsorbed dye which could be obvious upon increase in adsorbent dosage thereby reducing the availability of active sites(Pathania
et al., 2017 Lin et al.,2011).
Figure 2: Effect of adsorbent dosage for the adsorption of CV onto cornstalk
Effect initial dye concentration
The effect of initial dye concentration on adsorption of CV onto CS was investigated using the concentration range 10 – 50 mg/L with equilibrium time of 120 minutes. The results are shown in Fig. 3. It is seen that the equilibrium adsorption capacity (qe) was
found to increase from 40 mg/g to 120 mg/g upon increase in initial dye concentration from 10 to 50 mg/L. On the other hand, the percentage removal was found to decrease upon increase in concentration. This is due to the scenario whereby as the concentration increased, the available sites become fewer. Thus, the percentage of dye removal was dependent upon the initial concentration(Khan, et al.,2009)
Figure 3: Effect of changing dye Concentration for the adsorption of CV onto Cornstalk.
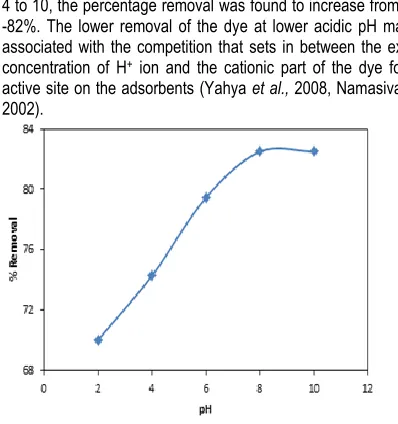
Effect of pH
4 to 10, the percentage removal was found to increase from 74% -82%. The lower removal of the dye at lower acidic pH may be associated with the competition that sets in between the excess concentration of H+ ion and the cationic part of the dye for the
active site on the adsorbents (Yahya et al., 2008, Namasivayam, 2002).
Figure 4: Effect of pH for the adsorption of CV onto corn stalk.
Adsorption isotherm:
Langmuir isotherm model
The fundamentals that facilitate better understanding about the nature of interaction between the adsorbent utilized, and the adsorbate is adsorption isotherms. Figure 5 presents the data obtained from the Langmuir isotherm, whereby the constants Q0
and b was calculated from slope while the intercept of the plot and values obtained are tabulated in table 1. The adsorption was found to be favorable.
Freundlich isotherm
Freundlich isotherm model was employed to estimate the adsorption intensity of the adsorbates on the adsorbent surface and the results are presented in Figure 6. The Freundlich isotherms KF represents the constant related to adsorption
capacity (Lmg-1) and n is the Freundlich isotherm constant related
to adsorption intensity. The result of the constant values was evaluated and presented in Table 1. It show that Freundlich model fits for CV dye (R2 0.972) adsorption process. It was also
observed that the value of n was greater than 1 indicating the favorable adsorption of CV onto Cornstalk
Table 1: Adsorption isotherm models
Figure 5: Langmuir isotherm model for the adsorption of CV on CS
Figure 6: Freundlich isotherm model for the adsorption of CV onto CS
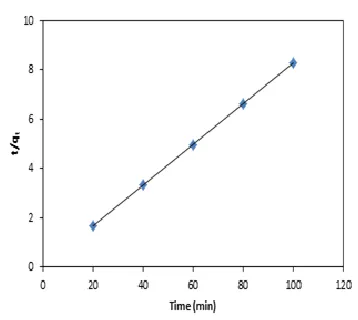
Adsorption kinetics
Figure 7 shows pseudo-first order plot of log (qe-qt) versus t from
which the values of k1 and qe were determined from the slope and
the intercept respectively, the result is presented in Table 2. The adsorption mechanism over a complete range of the contact time is explained by the pseudo – second order kinetic model. Table 2 shows that the R2 values obtained as experimental data for
pseudo second order kinetics is higher than that for the pseudo-first order kinetic model. Therefore, from the plot obtained, the adsorption was best fit by pseudo-second order kinetic model due to a high correlation coefficient determination. This is based on the assumption that the rate limiting step may be chemisorption involving valence forces through sharing or exchange of electrons between adsorbent and adsorbates(Bharathi, 2012, Bello et al.,2010).
Figure 7: Pseudo-first order kinetic model for the adsorption of CV onto CS
Figure 8: Pseudo-second order kinetic model for the adsorption of CV onto CS
Conclusion
In summary, the work shows the possibility of using cornstalk for the uptake of crystal violet dye. Effects of contact time, adsorbent dosage, initial Dye concentration, and pH on the % removal of the dye suggested an equilibrium adsorption time of 80 min for CS, optimum weight of 0.25g/50 cm3 of the dye and at a pH of 8. The
adsorption data was well described by the Freundlich isotherm equation. The rates of sorption were found to conform to pseudo-second-order kinetics with good correlation. This study reveals that Cornstalk can be employed as a low cost adsorbent for the removal of crystal violet from aqueous solutions.
Acknowledgement
The authors wish to acknowledge the efforts of Department of Chemistry, Al-Qalam University Katsina for providing the reagents and apparatus used during the course of this research.
REFERENCES
Ahmad, M. A., Puad, N. A. and Bello, O. S. (2014) ‘Kinetic, equilibrium and thermodynamic studies of synthetic dye removal using pomegranate peel activated carbon prepared by microwave-induced KOH activation’, Water Resources
and Industry. Elsevier, 6, pp. 18–35. doi:
10.1016/j.wri.2014.06.002.
Aksu Z, T. (2005) ‘Biosorption of reactive dyes on the green alga Chlorella vulgaris.’, J Process Biochem, 40, pp. 1347–1361. Annadurai, G., Juang, R.S., Lee, D. J. (2002) ‘Use of cellulose-based wastes for adsorption of dyes from aqueous solutions.’, J. Hazard. Mater., B 92, pp. 263–274.
Ansari R, M. Z. (2010) ‘Removal of basic dye methylene blue from aqueous solutions Using sawdust and sawdust coated with polypyrrole’, j Iran Chem Soc, 7, pp. 339–350.
Banat F, Al-Asheh S, A. (2003) ‘Evaluation of the use of raw and activated date Pits as potential adsorbents for dye containing waters.’, Process Bio Chem, 39, pp. 193–202. Bello OS, Adelaide O.M, Hammed M.A, (2010) ‘Kinetic and
equilibrium studies of Methylene blue removal from aqueous solution by adsorption on treated sawdust’, Macedonian J
Chem Eng, 29, pp. 77–85.
Bharathi K.S, (2012) ‘Equilibrium, thermodynamic and kinetic studies on adsorption Of a basic dye by Catullus lanatus rind’, Iran J Energy Environ, 3, pp. 23–34.
Bulut Y, A. (2006) ‘A kinetics and thermodynamics study of Methylene blue adsorption on Wheat shells.’, Desalination, 194, pp. 259–267.
Chamarthy, S., Seo, S. and Marshall, W. E. (2001) ‘Adsorption of selected toxic metals by Modified peanut shells’, Journal
Chemical Technology and Biotechnology:, 76, p. 593.
Dogan M, Abak H, A. M. (2009) ‘Adsorption of Methylene blue onto Hazelnut shell: kinetics, Mechanism and activation parameters.’, J Hazard Mater, 164, pp. 172–181.
El-Maghraby A. and El Deeb H.A. (2011) ‘Removal of a Basic Dye from Aqueous Solution by Adsorption Using Rice Hulls’,
Global NEST Journal, 13, p. 90–98.
Ghorai, S., Sarkar, A., Raoufi, M., Panda, A. B., Schonherr, H., & Pal, S. (2014) ‘Enhanced removal of methylene blue and methyl violet dyes from aqueous solution using a nanocomposite of hydrolyzed polyacrylamide grafted xanthan gum and incorporated nanosilica.’, ACS Applied
Materials & Interfaces, 6, p. 4766–4777.
Gonga, V. K. (2005) ‘Application Of low-cost adsorbents For dye removal – A review.’, Journal of Environmental
Management, 90, p. 2313–2342.
Khan, T. A., Ali, I., Singh, V. V., Sharma, S. (2009) ‘Utilization of Fly Ash as Low Cost Adsorbent for the Removal of Methylene Blue, Malachite Green, and Rhodamine B Dyes from Textile Waste Water.’, Journal of Environmental
Protection Science, 3, pp. 11–22.
Mafra M.R. , Mafra L. I, Zuim D.R., V. E. C. and F. M. A. (2013) ‘Adsorption of remazol brilliant blue on an orange peel adsorbent.’, Brazilian Journal of Chemical Engineering, 30, p. 657–665.
Malik, R., Ramteke, D. S. and Wate, S. R. (2007) ‘Adsorption of malachite green on groundnut shell waste based powdered activated carbon’, Waste Management, 27(9), pp. 1129– 1138. doi: 10.1016/j.wasman.2006.06.009.
Miyah, Y. et al. (2017) ‘Assessment of adsorption kinetics for removal potential of Crystal Violet dye from aqueous solutions using Moroccan pyrophyllite’, Journal of the Association of Arab Universities for Basic and Applied
Sciences, 23, pp. 20–28. doi: 10.1016/j.jaubas.2016.06.001.
Pathania, D., Sharma, S. and Singh, P. (2017) ‘Removal of methylene blue by adsorption onto activated carbon developed from Ficus carica bast’, Arabian Journal of
Chemistry. King Saud University, 10, pp. S1445–S1451. doi:
10.1016/j.arabjc.2013.04.021.
Kumar R. (2011) ‘Biosorption of hazardous crystal violet dye from aqueous solution onto treated ginger waste (TGW)’,
Desalination, 265(1), pp. 112–118.
Velmurugan, P., Rathina, K. V. And Dhinakaran, G. (2001) ‘Dye removal from aqueous solution Using low cost adsorbent’,
Int. Journal of Env. Sci., 1, p. 1492–1500.
Lin, Y., He, X.,G. Han, Q. Tian, W. H. (2011) ‘Removal of Crystal Violet from aqueous solution using powdered mycelial biomass of Ceriporia lacerata P2’, J. Environ. Sci., 23, pp. 2055–2062.
Yahya S Al-Degs, Musa I El-Barghouthi, A. (2008) ‘Effect of solution pH, ionic strength, and temperature on adsorption behaviour of reactive dyes on activated carbon’, J Dyes