RESEARCH ARTICLE
KINETICS AND MECHANISM OF DIRECT CONVERSION OF METHANE INTO METHANOL REACTION
ON MOO3 (010) CATALYST: A SIMULATION STUDY
1,2
Mehrnoosh Dashti
1
United Nations University, Institute for the Advance Study of Sustainability, Tokyo, Japan
2
Department of Mechanical Engineering, Islamic Azad University, Central Tehran Branch, Tehran, Iran
ARTICLE INFO
ABSTRACT
In this investigation, kinetics and mechanism of heterogeneous direct catalytic conversion of methane
into methanol over MoO3 (010) surface was studied using computer simulation. The rate of CH3OH
formation (TOF) was determined under different reaction conditions
Torr P
Torr P
C T
C 590 , CH 40 80 , O 80 150 480
( 0 0 4 2
and 100 200 )
2 Torr
PHO . The
presence of H2O was found essential for selective CH3OH production. According to this analysis, the
TOF was increased with increasing
4 2 CH
O P
P and reaches a maximum value at 9.2 ratios. The order of
reaction with respect to 4
CH
P , 2
O
P and O H
P
2
at T5400C were found l0.7,m0.1and, n0.8
respectively. The activation energy of the reaction was obtained385kcal/mole. Selectivity toward
CH3OH formation was determined 77% in the above temperature range. However, the selectivity for
HCHO and other products (C2H6 and CO2) was obtained 22% and 1%, respectively, in this range.
Copyright © 2015Mehrnoosh Dashti.This is an open access article distributed under the Creative Commons Attribution License, which permits unrestricted use, distribution, and reproduction in any medium, provided the original work is properly cited.
INTRODUCTION
In the past decades, fossil fuels have played a major role in production of energy for industry and transportation in the world. The energy consumption of these fuels resulted in increasing enormous amount of pollutants and green house gasses in our surrounding. To overcome this environmental pollutions and to adequate the shortage in the proved reserves of fossil fuels, it is necessary to use the new and cleaner energy resources as alternative ones. Conversion of methane into methanol as a transportable liquid fuel has attracted many attentions in both scientific and technological community. This challenge stems from both environmental and economical views. In this regard, Olah et al. (Olah et al., 2006) have studied the economy of methanol as compare to oil and gas. From scientific viewpoints, the kinetics and mechanism of direct conversion of methane into methanol reaction is not clearly understood. Therefore, many research groups around the world attempt to elucidate detail understanding of this important process. Currently, methanol is produced from natural gas (mainly methane) through reforming reaction in two steps via syngas (CO+H2) as an intermediate in industrial
scale (Lunsford, 2000). Concerning the first step, Mariana and Schmal (Mariana and Schmal, 2003) have studied the support effects on syngas production through partial oxidation and CO2 reforming reaction of methane using Pt catalyst.
*Corresponding author: Mehrnoosh Dashti
Department of Mechanical Engineering, Islamic Azad University, Central Tehran Branch, Tehran, Iran.
Today, research is underway to oxidize methane directly into methanol in high yield by using a single exothermic reaction step. There are three different methods involving in the oxidation of methane into methanol: gas-phase non-catalytic homogeneous oxidation (Han et al., 1995; Verma, 2002), liquid phase homogeneous catalytic oxidation of methane (Mylvaganam et al., 2000) and heterogeneous catalytic oxidation (Raja and Ratnasamy, 1997). In these studies, the yield of methanol production for the direct selective oxidation of methane is low and formaldehyde is a major by-product of the reaction. A review on these three methods is reported in (Zhang et al., 2003). Thus, direct heterogeneous catalytic conversion of methane into methanol is interesting and promising as compared to the other methods. In the present study, the direct catalytic conversion of methane into methanol reaction will be discussed under different conditions. Liu et al.
(Liu et al., 1984) have used N2O oxidant in the conversion of
methane into methanol reaction over MoO3/SiO2 catalyst.
Their report indicates that during the reaction, the generated methyl radical reacts with the catalyst producing methoxide ions, and subsequently these ions could react with the H2O to
form methanol. Moreover, Khan and Somorjai (Khan and Somorjai, 1985) have studied the partial oxidation of methane with N2O and H2O on silica-supported molybdena who
obtained the kinetics parameters of the reaction. Gesser et al. (Gesser et al., 1985) have also investigated the effect of reaction parameters (temperature, pressure, O2 concentration
and residence time of reactants) on methanol yield in the direct
ISSN: 0976-3376
Vol.06, Issue, 10, pp. 1895-1901, October, 2015Asian Journal of Science and TechnologyASIAN JOURNAL OF
SCIENCE AND TECHNOLOGY
Article History:
Received 30th July, 2015
Received in revised form
24th August, 2015
Accepted 19th September, 2015
Published online 31st October, 2015
conversion of methane into methanol. A higher CH3OH yield
was reported in high pressures, high temperatures and low O2
concentrations.
Hall et al. (Hall et al., 1995) have presented an excellent review on history (since 1905) and catalysts performance in the partial oxidation of methane into methanol and formaldehyde reactions on the basis of the oxygen space-time yield (STY) values. Concerning the catalyst performance, Wang and Otsuka (Wang and Otsuka, 1996) have studied the effect of structure of active sites in the Fe-containing catalysts during the oxidation of methane into methanol reaction by using by H2-O2 gas mixture. A selectivity of 23% and 45% for
methanol and formaldehyde was obtained over the FePO4
model catalyst in the presence of H2, respectively. In the other
work, Beata (Beata, 2004) has studied the partial oxidation of methane to formaldehyde and methanol using molecular oxygen over Fe-ZSM-5 catalyst (Si/Fe = 45) with high selectivity of methanol ~74%.
Some research groups have also examined other catalysts. Aoki et al. (Aoki et al., 1998) have investigated direct conversion of methane into methanol over MoO3/SiO2 catalyst
at 873K in an excess amount of water vapor. They have measured a higher methanol yield due to depression of successive oxidation of methanol and formaldehyde into carbon oxides on the surface of the catalyst due to silicomolybdic acid (SMA) formation. In addition, the selective oxidation of methane in a gas mixture of CH4-O2
-NO2 over MoO3 catalyst was studied by Takemoto et al.
(Takemoto et al., 2001) who found the enhancement of methane activation with O2 and N2O in the presence of the
catalyst.
Since direct conversion of methane into methanol has an economic advantage as compared to indirect reaction, fundamental studies of the process are necessary to achieve this goal. According to analysis of different studies, it is observed that the MoO3 surface is a selective catalyst for the
direct conversion of methane into methanol reaction (Aoki et al., 1998; Takemoto et al., 2001; Moshfegh and Dashti, 2004). The kinetics and mechanism of this reaction over MoO3(010)
was studied from photocatalytic viewpoint by Moshfegh and Dashti (Moshfegh and Dashti, 2004). To investigation the reaction under thermal condition, this work has studied the kinetics and mechanism of direct catalytic conversion of methane into methanol over MoO3 (010) surface in the
presence of water vapor molecule using computer simulation method.
Reaction Model
MoO3 (010) Catalyst
Molybdenium trioxide, MoO3, has been known as a catalyst
for many partial oxidation reactions. Catalytic activity of MoO3 depends on chemical composition and special situation
of oxygen atoms in its structure. The MoO3 has an
orthorhombic layer structure with the following lattice
parameters:
0
963
.
3
A
a
0
855
.
13
A
b
and0
696
.
3
A
c
.Each layer consists of bi-layer planes of MoO6 octahedral that
are parallel to (010) crystal face.
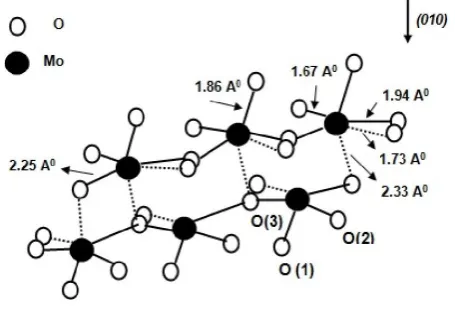
This surface is the most exposed face of the catalyst that can participate in surface chemical reactions. Yin et al. (Yin et al.,
2001) reported that the three different types of surface oxygen centers exit at the (010) cleavage face. These are the terminal oxygen, O (1), the asymmetric bridging oxygen, O (2), and the symmetric bridging oxygen, O (3). The O (1) is coordinated to one molybdenum atom directly and O (2) and O(3) are located between two molybdenum atoms.
Figure 1. Crystal structure of orthorhombic MoO3 with (010) direction, different surface oxygen and their corresponding bond
length is also shown.
Figure 1 illustrates these three different types of oxygen with their corresponding bond length. It is well established that the O(1) is an active site for CH4 adsorption (Chen et al., 2000).
Following CH4 adsorption on the catalyst surface, the first C-H
bond is broken and the produced methyl radicals are adsorbed at the O(1) sites. As a result, a vacancy (defect) is generated on the surface according to the following steps (Haber and Lalik, 1997):
2
2
1
O
V
O
Surface
(1)
V
e
V
(2)
V
e
V
2 (3)where V represents oxygen vacancy. Equilibrium between oxygen atoms in the lattice, surface and gas phase is a dynamic one. A continuous process of evaluation of oxygen from the surface and its re-adsorption by the surface must take place, as shown in Figure 2.
The surface always populated by transient oxygen species
)
(
,
)
(
22
surf
O
surf
O
andO
2(
surf
)
, which are strongly electrophilic species and are responsible for the total oxidation of hydrocarbon molecules (Haber and Erwin Lalik, 1997).
Reaction Mechanism
For the direct catalytic conversion of methane into methanol, this study proposed three elementary steps as follows: 1) hydrogen abstraction from methane resulting in formation of methyl radical
C
H
3
formation, 2) insertion of oxygen to form methoxide ion (CH3O
-), and 3) hydrolysis of the methoxide into methanol (Aoki et al., 1998). In general,
O
ion surface sites in early transition metal oxides such as TiO2,V2O5, MoO3 and WO3 are able to abstract H from methane
(Kaliaguine et al., 1978). In this context, formation of surface active site and dehydrogenation of methane is proposed by the following reactions sequence:
) ( ) ( 2 8 ) ( 4
8Mo O CH4g Mo H2Og CO2g
V VI
(4)
O
g
Mo
O
Mo
V(
)
VI2
1
2
(5)
O
g
Mo
O
Mo
V(
)
2
VI2
1
2
2(6)
) ( )
( 3
4g MoOH CH ads
CH O
MoVI RDS VI (7)
It is well documented (Chen, 2000; Ward et al., 1987) the rate determining step (RDS) for conversion reaction of methane into methanol is the abstraction of first hydrogen atom from methane as specified in reaction (7) shown above. The methyl radical formed
CH3
on the surface is highly active and therefore it reacts with MoVIO= surface site of MoO3 (010)catalyst. As a result, the intermediate methoxide ion will produce according to the following reaction:
3.
3
(
ads
)
Mo
O
Mo
OCH
CH
VI V(8)
Then, the facile reaction of molybdenum methoxide
)
(
Mo
VOCH
3 with water vapor forms methanol (Liu et al.,1984):
OH CH OH Mo ) g ( O H OCH
MoV 3 2 V 3 (9)
In a parallel reaction, the molybdenum methoxide ion may also react with surface sites to produce formaldehyde by the following mechanism:
HCHO OH
Mo Mo O Mo OCH
MoV VI V V
2 2
3 (10)
To refresh the surface sites and complete the catalytic reaction cycle, the following reaction is also suggested:
O H O Mo Mo OH Mo OH
MoV VI V VI 2 (11)
In addition to formaldehyde, the formation of other by-products namely
C
2H
6 andCO
2 are also considered in this model. These products can be produced through the following reactions:)
(
)
(
)
(
3 2 63
g
C
H
g
C
H
g
H
C
(12)
)
g
(
H
2
)
g
(
CO
)
g
(
O
)
g
(
CH
4
2
2
2 (13)Therefore, according to the above mechanism, the MoVIO- active surface site plays an important role in the direct conversion of methane into methanol reaction over MoO3(010)
surface.
Simulation procedure
Assumptions
The model is based on dynamic flow system that the reaction occurs at constant atmospheric pressure. The (010) face of the MoO3 catalyst is considered as a two-dimensional 100
100uniform
Mo
VIO
surface sites with periodic boundary condition. In this reaction, the model has considered CH4, O2and H2O as reactants and CH3OH, HCHO, C2H6, CO2 and
CH3OH as products. The reaction temperature is varied from
C
0
480
to590
0C
K at constant total pressure of P=760 Torr. Liu et al. (Liu et al., 1984) reported that the water vapor plays an important role in selective formation of methanol by nitrous oxide over MoO3– SiO2 catalyst, so, water vapor isessential for the selective formation of methanol. Assumptions of the model are as following:
(a)The principle of conservation of sites is considered at the catalyst surface as defined below:
1
22
4
O
HO
V
CH
(14)where
4
CH
,2
O
and
H2O represents the fraction of surface coverage of methane, oxygen and water molecules, respectively and
V is fraction of surface vacant sites.b) All reactions proceed in forward direction.
c) The occurrence probability of all the reactions considered one except the RDS reaction.
d) Surface reaction mechanism is obeyed by Eley-Ridal scheme.
e) Refreshment of surface sites is implemented by considering reaction (11).
f) To obtain the surface density of any adsorbed species, the model has used canonical continuous partition function for the both gas and adsorbed phases. By assuming the identical chemical potential of both phases
g
a
, the surface density of adsorbedCH
4,O
2 orH
2O
molecule
2
cm
molecules
is computed using the following
2
12exp
[
(
)
]
RT
E
E
mkT
h
kT
P
n
b
a
(15)
where P is partial pressure of incident gas in Torr, Eb is
bonding energy of any adsorbed molecule on surface atom in unit of kcal/mole, Ea is adsorption activation energy for
CH
4,2
O
orH
2O
molecules in unit of kcal/mole, T is absolute temperature in Kelvin and h, m, k, and R are usual definition. g) It’s convenient to generate a normalized adsorption probability that is defined between zero and one. This quantity is the ratio of surface density ofCH
4,O
2 orH
2O
orgenerally
n
i (where i represents any of the reactants) to sumof all reactant surface species
(
)
j j i
n
n
is considered as
probability adsorption for any incident molecule in initial stage of the reaction.
h) The resident time of all products is negligible. In addition, the desorbed product molecules are not reabsorbed on the surface of the catalyst. In the other word, the deactivation of the catalyst surface is ignored.
Considering ensemble at microscopic reactions in this system, Metropolis Monte Carlo method (Metropolis et al., 1953) was utilized to monitor the movement of species at the catalyst surface until obtaining equilibrium condition. At each surface site, there is a different probability for reaction to occur but for simplicity the model has considered equal probability for all reactions except RDS reaction.
Algorithm
As mentioned above, the MoO3 surface catalyst is considered
as a two-dimensional 100
100 uniform surface sites. Therefore, in every simulated time step, the number of incident reactant molecules (CH
4,O
2,H
2O
) is 10000. So,on average there is one incident molecule per site. In addition, it has allowed that the system to reach stationary state in every time step. To simulate the reaction, first, a site and one incident specie are selected randomly. Then, by considering adsorption probability of the reactant molecules (discussed in Assumptions section), surface specie is identified.
Then, adsorbed specie takes place in the reactions according to the proposed mechanism described in the Reaction Mechanism section. Finally, the numbers of product molecules formed are counted in each reaction step. The computed number is converted to rate of desired product formation in terms of Turn Over Frequency (TOF). The TOF value defines as number of
OH
CH
3 molecule produced per surface site per second. For evaluating the effect of various parameters on reaction kinetics and the rate of methanol formation, TOF value for CH3OHformation is computed under different conditions. In addition, it has also considered other reaction product molecules namely
6
2
H
C
andCO
2 in the overall reaction.It is to note that formation of these parallel reaction resulted in reduction of
CH
3OH
production.RESULTS AND DISCUSSION
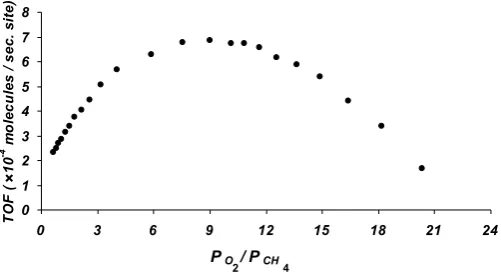
Effect of Pressure
In order to study the effect of reactants partial pressure on the rate of CH3OH formation (TOF), it has investigated the
influence of
4 2 CH
O
P
P
on the methanol production rate atconstant temperature (
T
540
0C
) andP
H2O
200
Torr
.Figure 3 shows the variation of methanol formation rate in term of TOF as a function of
O
2 toCH
4 partial pressure ratio.Figure 3. The variation of CH3OH formation rate (TOF) with
oxygen/methane partial pressure ratios
(PHO Torr T 0C
540 , 200
2
).
It is obvious that the rate of methanol formation increased by increasing
4 2 CH
O
P
P
ratio. It is believed when the partialpressure of methane increases, the methyl radical
C
H
3
active species is produced extensively on the catalyst surface. This is consistent with the proposed model (reaction (7)).
The generated
C
H
3 is reacted with surface oxygen resultingin
MoO
VCH
3 formation (reaction (8)). Consequently, the rate of methanol formation is increased under these conditions. This behavior continues rising and reaches a maximum valueof
6
.
9
10
4(
sec
.
)
site
molecules
at9
.
2
4 2 CH
O
P
P
.Then, the TOF is gradually declined with increasing the ratio. The reason for the reduction in the rate of methanol formation is believed due to HCHO formation via parallel reaction (10) since this reaction favors at higher O2 partial pressures.
Moreover, other carbonated products such as C2H6 and CO2
may also produce as were specified in reactions (12) and (13).
Kinetics Order
In general, the rate of the reaction
(
r
r)
is defined asfollowing equation: n O H m O l CH r
r
k
P
P
P
r
2 2 4
(16)
0 1 2 3 4 5 6 7 8
0 3 6 9 12 15 18 21 24
PO / PCH
T
OF
(
1
0
-4 m
o
lec
u
les
/
s
e
c
.
si
te
)
4
×
r
k
is reaction rate constant is defined by)
(
exp
E
RT
A
k
r
a where A is the temperatureindependent pre-exponential factor, Ea is activation energy of
overall reaction and l, m and n are reaction kinetic orders with respect to CH4, O2 and H2O partial pressure, respectively. In
order to determine the orders of reaction, the model has utilized equation (16) by keeping reaction temperature constant (
T
540
0C
) by determining the rate of CH3OHformation. To obtain reaction order with respect to CH4
(
l
)
,the partial pressure of CH4 was varied between 40 and 80 Torr
at constant oxygen and water partial pressure
)
260
,
100
(
2
2
Torr
P
Torr
P
O
HO
(Liu et al., 1984).Figure 4 shows the variation of TOF values versus methane partial pressure in log-log plot (equation (16)). In this plot, the slope represents the corresponding reaction order
(
l
)
. According to this plot, it has found that the rate of CH3OHformation with respect to CH4 is
l
0
.
7
.Similarly, Figure 5 depicts the variation of TOF as a function of
2
O
P
in logarithmic form. Variation of the partial pressure of O2 over the range of 80 to 150 Torr at constant methane andwater partial pressure
(
75
,
266
)
2
2
Torr
P
Torr
P
O
HO
results in
m
0
.
14
for the order of reaction with respect to O2 partial pressure. For determination of reaction order withrespect to H2O, the CH4 and O2 partial pressure were held in
75 and 280 Torr, respectively and
P
H2O was varied between100 and 200 Torr [9]. Figure 6 presents H2O partial pressure
versus TOF. It has obtained the order of reaction with respect to H2O partial pressure
(
n
)
is 0.8.Figure 4, logarithmic plot of TOF as a function of CH4 partial pressure
) 260 100
, 80 40
, 540
( 0 4 24 2
Torr P
and Torr P
Torr P
C
T CH O HO
Figure 5. Logarithmic plot of TOF as a function of O2 partial pressure
) 266 75
, 150 80
, 540
( 0 2 4 2
Torr P
and Torr P
Torr P
C
T O CH HO
Therefore, the rate of CH3OH formation with respect to CH4,
O2 and H2O partial pressure were approximately obtained first,
zero and first order, respectively.
A similar result was also obtained by Khan and Somorjai (Khan and Somorja, 1985) in the oxidation reaction of CH4
with N2O over MoO3 –SiO2 catalyst in the presence of water
vapor in the reactant gas. They have obtained
l
=0.8,m
=0.2 andn
=1.1 for reaction order of reactants. The positive values indicates that the increase of TOF resulting the rise in CH4 andH2O partial pressures and the zero order shows the
independency of the rate on O2 partial pressure.
It is worth noting that it has also investigated the order of the reaction under photo irradiation of MoO3 (010) surface at
atmospheric conditions. The following values were obtained
30
.
0
l
andm
1
.
03
as reported (Moshfegh and Dashti, 2004).Figure 6. Logarithmic plot of TOF as a function of H2O partial pressure
) 280 75
, 200 100
, 540
(T 0C PH2O Torr PCH4 TorrandPO2 Torr
-8 -7.9 -7.8 -7.7 -7.6 -7.5 -7.4 -7.3 -7.2 -7.1 -7
3.6 3.8 4 4.2 4.4
ln PCH (Torr)
ln
TOF
(
m
ol
e
c
u
le
s
/
s
e
c
.
s
it
e
)
l = 0.7
4
-7.4 -7.3 -7.2 -7.1
4.3 4.4 4.5 4.6 4.7 4.8 4.9 5
ln PO (Torr)
ln
TO
F
(m
ol
e
cu
lre
s
/
s
e
c
.
s
it
e
)
m = 0.14
2
-7.7 -7.65 -7.6 -7.55 -7.5 -7.45 -7.4 -7.35 -7.3 -7.25 -7.2
4.6 4.8 5 5.2 5.4
ln PH O (Torr)
ln
TOF
(m
ol
e
c
ul
e
s
/
s
e
c
.
s
it
e
)
Ea Determination
In order to study the effect of reaction temperature on the rate of methanol formation, this study has used the Arrhenius equation defined as:
)
exp( E RT
C
rr a (17)
where C is equal to
A
P
CH lP
O mP
HOn2 2
4 . The coefficient C
is considered a typical constant because the partial pressures are constant. Figure 7 illustrates the experimental and simulated Arrhenius plot for the reaction in different temperatures. The activation energy of the total reaction (activation energy of methanol formation) is obtained by variation of temperature over the range of 480 to 590 0
C
.Figure 7. The Arrhenius plot for direct catalytic conversion of methane into methanol reaction
PCH Torr PO Torr PHO Torr T C
0
590 480
, 200 ,
504 ,
56 2 2
4
According to the data analysis, activation energy of
38
5
kcal/mole is obtained under the reaction conditions. This finding is consistent with the experimental result measured by Khan and Somorjai (Khan and Somorjai, 1985).
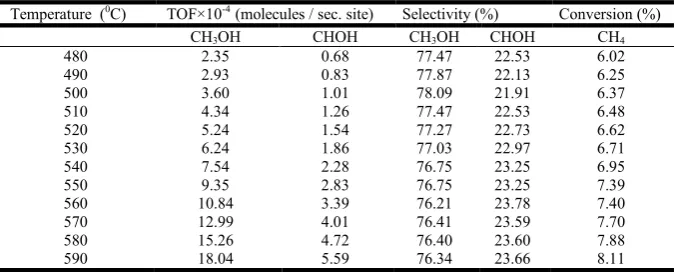
Selectivity and Methane Conversion
According to definition, the selectivity of a desired product in a catalyzed reaction defined by the following expression:
100
R
R
(%)
S
j Carbonproducts
i
i
(18)where Ri is the rate of formation of a certain product (i.e.
CH3OH ) and
j
represents sum of all rates for all the
reaction products containing carbon. The selectivity for both CH3OH and CHOH is computed under the reaction conditions.
The highest selectivity toward CH3OH formation was 76% at
temperature of 843 K.
Methane conversion was also calculated in this reaction by using the following equation:
100 ) ( %)
(
4
4
Unreacted CH
products of carbon Total
products of carbon Total mol
conversion
CH (19)
where products refer to CH3OH, CHOH, C2H6 and CO2 .
The selectivity of main reaction products (CH3OH and CHOH)
as well as methane conversion in temperature range from 763 to 873 K are listed in Table 1. It is important to note that the trace amount of C2H6 and CO2 were also noticed under the
assumed reaction conditions.
Conclusions
Kinetics and mechanism of heterogeneous direct catalytic conversion of methane into methanol over MoO3 (010) surface
was investigated in different reaction conditions
)
1
,
580
480
(
0C
T
0C
P
tot
atm
using computersimulation method. Based on the proposed mechanism, MoVIOH- resulted from the RDS reaction step considered as an active site and the presence of H2O vapor is essential in the
CH3OH formation.
The rate of CH3OH formation in terms of TOF was increased
with
4 2 CH
O
P
P
ratio and reaches a maximum(
6
.
9
10
4(
sec
.
)
site
molecules
at 9.2 ratios. Accordingto the kinetics data analysis, the reaction order with respect to
CH4, O2 and H2O at
540
(
813
)
0
K
C
T
were1
.
0
,
7
.
0
m
l
andm
0
.
8
, respectively.-12 -11 -10 -9 -8 -7 -6
1.2 1.22 1.24 1.26 1.28 1.3 1.32 1.34 1.36
103 / T (K-1)
ln
TOF
(
m
ol
e
c
ul
es
/
s
e
c
.
s
ite
)
41 ± 4 kcal/mole
(Khan & Somorjai)
38 ± 5 kcal/mole
(This Work)
Table 1. The rate of methanol and formaldehyde formation with their corresponding selectivity and CH4 conversion in different reaction temperatures
Temperature (0C) TOF×10-4 (molecules / sec. site) Selectivity (%) Conversion (%)
CH3OH CHOH CH3OH CHOH CH4
480 2.35 0.68 77.47 22.53 6.02
490 2.93 0.83 77.87 22.13 6.25
500 3.60 1.01 78.09 21.91 6.37
510 4.34 1.26 77.47 22.53 6.48
520 5.24 1.54 77.27 22.73 6.62
530 6.24 1.86 77.03 22.97 6.71
540 7.54 2.28 76.75 23.25 6.95
550 9.35 2.83 76.75 23.25 7.39
560 10.84 3.39 76.21 23.78 7.40
570 12.99 4.01 76.41 23.59 7.70
580 15.26 4.72 76.40 23.60 7.88
The activation energy for the reaction from the Arrhenius plot was obtained
E
a
38
5
kcal
/
mole
. The selectivitytoward CH3OH and CHOH formation were obtained about
77% and 22% at temperature of
480
0(
753
)
K
C
and)
863
(
590
0C
K
, respectively.Acknowledgements
The author would like to express her sincere appreciation and thanks to her MSc Supervisor, Dr. A. Z. Moshfegh for sharing his valuable advice that greatly assisted this research. Useful discussion with Dr. S. Azizian, Mr. M. Fazeli and Dr. Kh. Zakeri is greatly acknowledged.
REFERENCES
Aoki K., Ohmae M., Nanba T., Takeishi K., Azuma N., Ueno A., Ohfune H., Hayashi H., and Udagawa Y. 1998. Catalysis Today, 45, 29.
Beata M., 2004. Applied Catalysis A: General, 277, 147. Chen M., Friend C. M. and Kaxiras E. 2000. Journal of
Chemical Physics, 112, 9617.
Gesser H. D. and Hunter N. R. 1985. Chemical Reviews, 85, 235.
Haber J. and Lalik E. 1997. Catalysis Today, 33, 119.
Hall T. J., Hargreaves J. S. J. and Taylor G. J. 1995. Fuel Processing Technology, 42,151.
Han L.B. Tsubota S., Kobayashi T. and Uaruta M. 1995.
Journal of Chemical Society, Chemical Communication, 93.
Kaliaguine S. L., Shelimov B. N. and Kazansky V. B. 1978.
Journal of Catalysis, 55, 384.
Khan M. M. and Somorjai G. A. 1985. Journal of Catalysis., 91, 263.
Liu H. F., Liu R. S., Liew K. Y., Johnson R. E. and Lunsford J. H. 1984. Journal of American Chemical Society, 106, 4117.
Lunsford J. H. 2000. Catalysis Today, 63,165.
Mariana M. V. M. Souza and Schmal M., 2003. Catalysis Letters 91, 11.
Metropolis N., Rosenbluth, A. W., Rosenbluth M. N., Teller, A. H. and Teller E. 1953. Journal of Chemical Physics, 21, 1087.
Moshfegh A. Z. and Dashti M. 2004. Surface Review and Letters., 11, 33.
Moshfegh A. Z. and Dashti M. 2004. Proceedings of the 13th International Congress on Catalysis, 11-16 July, Paris, France, P2-067.
Mylvaganam K., Bacskay G. B. and Hush N. S. 2000. Journal of American Chemical Society, 122, 2041.
Olah G.A., Goeppert A., Surya Prakash, G.K., Beyond Oil and Gas: The Methanol Economy, Wiley-VCH, Weinheim, 2006.
Raja R. and Ratnasamy P. 1997. Applied Catalysis A: General
158, L7.
Takemoto T., Tabata K., Teng Y., Dai L. X. and Suzuki E. 2001. CatalysisToday 71, 47.
Verma S. S. 2002. Energy Conversion and Management 43 1999.
Wang Y. and Otsuka K. 1996. Journal of Molecular Catalysis A: Chemical, 111, 341.
Ward M. D., Brazdil J. F., Mehandru S. P. and Anderson A. B. 1987. Journal of Physical Chemistry, 91, 6515.
Yin X., Han H. and Miyamoto A. 2001. Journal of Molecular Modeling, 7, 207.
Zhang Q., He D. and Zhu Q. 2003. Journal of Natural Gas Chemistry 12, 81.