An Approach for Selecting Candidates in Soft-handover
Procedure Using Multi-Generating Procedure and
Second Grey Relational Analysis
Neng-Yih Shih and Hsing-Chung Chen (Jack Chen)
Department of Computer Science and Information Engineering, Asia University 41354 Taichung, Taiwan
{shih, cdma2000}@asia.edu.tw
Abstract. The objective of this paper is to develop a decision-making approach for selecting candidates in soft-handover procedure in 3th or 4th generation mobile communication through grey relational analysis of the series similarity and approximation. The multi-generating and second grey relational analysis procedure is applied to select candidates in soft-handover procedure with considerations of the velocity and acceleration similarity of multi-generating data. The validation of computer simulation models illustrate how the approach can be applied in candidates selection in soft-handover, and obtain the best results of feasibility and effectiveness for user equipment (UE) in 3th or 4th generation mobile communications. Moreover, the approach could be easily applied to soft-handover procedure for the mobile communication systems. In this proposed approach is performed to select the candidate target cells by UE instead of eNodeB. It could provide a first solution to choose the candidate target cells through comparing multiple measured data for candidate-selecting with the target communication cell.
Keywords: generating procedure, grey relational grade, difference generating, candidates selecting, soft-handover, 3G, 4G.
1.
Introduction
people nowadays access the Internet anytime and anywhere through their smartphones, tablets, laptop and other devices.
Mobile communication should enable full accessibility to user equipment (UE) simultaneously and guarantee the Quality of Service (QoS) [3, 4, 5]. Thus, the QoS is a significant measurement tool of Internet quality in mobile users. Usually, the signal strength from serving cell and neighboring cells are viewed as the decision-making factors in handover process. When UE is on process of receiving or sending data, UE is periodically sending measurement report Reference Signal Received Power (RSRP) and Reference Signal Received Quality (RSRQ) from the serving eNodeB and the neighboring eNodeB [4]. If the monitored signal strength of the serving cell drops under the threshold or below the signal level of neighboring eNodeB, the UE have to perform a soft-handover as soon as possible to accommodate the required QoS. There are many research of handover decision are conducted solely based on RSRP [6, 7].
The Grey System Theory is proposed by Deng (2002) [8], and it is mainly applied to measure system models, analyze relations between systems, establish models, predict the system performances and make decisions [9, 10, 11]. The grey relational analysis method is used to compare the geometric relationships of the data series. It is also applied to analyze the causal relationship of the input and output variables, and to identify the major variables and secondary variables from system perspective. In the grey relational analysis method, the relationship between series is developed on the basis of geometric closeness between each data series. However, it is founded that there are some flaws in the traditional grey relational analysis method. Therefore, an approach, the multi-generating and second grey relational analysis, is proposed in this research to improve the reliability of data [12]. First, the approach shows that if the curves of data series are close to each other, then the relationship that the Grey Relational grade shows will be optimal. Furthermore, the approach does not require large amount of data or typical distribution pattern, and only perform small amount of calculations. Hence, it is regarded as an effective means to improve the mathematical statistics. The grey relational analysis, under the requirement of relatively small data sets, is adopted in research to determine the relationship between the grades. This analysis will show how this approach accurately quantifies the similarity and approximation relationship of data series.
The rest of the paper is organized as following. Related works of the research are introduced in Section 2. The multi-generating and second grey relational analysis approach are illustrated in Section 3. After that, an approach for selecting candidates in soft-handover procedure is proposed in Section 4, followed by the conclusions in section 5.
2.
Related Works
Mainly, the signal strength from serving cell and neighboring cells in existing 3th generation or 4th generation mobile communication systems are viewed as the decision-making factors for candidate target cells in soft-handover processes. However, the details of how the measurement reported by UE and what kind of related approach could be used to improve the soft-handover processes are very important in this paper. Thus, the related works of measurement report in LTE are described in Section 2.1. In addition, the grey relational grade models are also illustrated in Section 2.2.
2.1. Measurement Report in LTE
To simplify the experiment of handover procedure of UE, input measurements are divided into 2 signals, RSRP and RSRQ. The details [9] will be explained in the following subsections.
Reference Signal Received Power. Reference Signal Received Power (RSRP) is defined as the linear average over the power contribution of the resource elements that carry cell-specific reference signal within the considered measurement frequency bandwidth. The cell-specific reference signal, according to [17], can be used for RSRP measurement. RSRP can be calculated from the transmit power (Ps) of the serving cell, eNodeB, the path loss value (PLus) from UE to the serving cell eNodeB, and additional shadow fading with a log-normal distribution. The RSRP can be calculated as following Equation (1).
(1) The reporting range of RSRP is defined from -140 dBm to -44 dBm with 1 dB resolution. The detail of RSRP Measurement report is shown in [18].
Received Signal Strength Indicator. E-UTRA Carrier Received Signal Strength Indicator (RSSI) is the total received wideband power observed by the UE from all sources, including co-channel serving and non-serving cell, adjacent channel interference, thermal noise and so on. RSSI can be calculated by Equation (2) as below.
(2) The reporting range for UTRA carrier RSRI is from -100 dBm to -25 dBm. The detail of RSSI Measurement report is shown in [9].
m s us
mRSRP x P PL x
m s ue,
m int noice,
mReference Signal Received Quality. Reference Signal Received Quality (RSRQ) can be calculated by the ratio N RSRP/RSSI, where N is the number of resource block (RB) of the E-UTRA carrier RSSI measurement bandwidth. RSSI includes thermal noise and interference received from the target eNodeB, thus RSRQ, calculated by the following Equation (3). It can show the relation of signal, interference and thermal noise.
(3)
The reporting range of RSRQ is defined from -19.5 dB to -3 with 0.5 dB resolutions. The detail of RSRQ Measurement report is shown in [18].
2.2. Grey Relational Grade Models
Grey relational analysis (GRA) [19-21] is commonly used in Asia. It is a significant evaluation model that scales the level of similarity and difference between the sequences by grey relational grade [19]. The main procedure of GRA is firstly translating the performance of all alternatives into a comparability sequence. This step is called grey relational generating. According to these sequences, a reference sequence (ideal target sequence) is defined. Then, the grey relational coefficient between all comparability sequences and the reference sequence is calculated [20]. GRA is developed based on the point-set topology, it performs an overall comparison between two sets of data rather than a comparison between two points. Thus, it is used to reduce the subjective parameter setting within the model [21].
There are four models are analyzed in this subsection. These models will be compared in this Section.
Deng’s GRG Approach. Since 2002, Deng’s Grey relation grade (GRG, for short) [8] has been widely used to solve problems under small data set in many fields. The specific steps can be summarized as follows:
Determining the Reference Series and Comparative Series. At first, the reference series are represented as , and the comparative series are given as
.
Calculate the Relational Coefficient. The Grey correlation coefficient can be expressed as following Equation (4).
(4)
where , is representing the absolute
value of the difference, is the minimum absolute differences,
mm
m
RSRP x
RSRQ x N
RSSI x
0 0 1 2
X { x ( k ) k , , ,n }
1 2 , where 1 2 i i
X { x ( k ) k , , ,n } i , , ,m
)
(
k
i
i i
i k i k
i
i i
i k
minmin maxmax
maxmax
( k ) ( k )
( k )
( k ) ( k )
0 1 2 1 2
i( k ) x ( k ) x ( k ) ,i i , , .k , ...n
i i k
minmin( k ) i
i k
is the maximum of absolute differences, and discrimination coefficient which can be changed from 0 to 1, and in this research, we assume that .
Calculate the Deng’s GRG. After the grey relational coefficient having been derived, the grey relational grade is calculated by the average value of the grey relational coefficient as the following Equation (5).
(5)
According to Equation (5), there are four axioms of the grey relational grade as below.
1) Normality: , ;
2) Integrity: we have
for ;
3) Symmetry: we have for ;
4) Closely: if the value of became smaller, then the value of will become greater.
According to Equation (5), Grey relational coefficient is function of and discrimination coefficient . In this paper, the operator is selected. The discrimination coefficient can be automatically selected, please see Ref. [22]. The reference series, the comparative series, the order of non-dimensional data, and the transformation of negative relation and positive relationship data can be pre-processed in the Grey relational generation.
Grey Slope Similarity Incidence Approach. In 2010, the grey slope similarity incidence model is proposed by Li-zhi Cui et al. [16]. It is constructed on the basis of grey slope incidence. It is indicated that this model can satisfy similarity and be used to calculate the correlation data of positive or negative. The reference series are represented as , and the comparative series are given as below.
, and
The grey relational coefficient is given as the following Equation (6):
(6)
where .
The GRG is given as the following Equation (7) below.
0 5.
n k i i k n X X 10 ( )
1 ) , ( 1 ) , (
0 X0 Xi (X0,Xi)1X0Xi
Xi,Xj
Xj,Xi
i j Xi,XjX
Xss0,1,2,m;m2
Xi,Xj
Xj,Xi
X
Xi,Xj
Xi,XjX
) ( ) ( )
(k x0 k xi k
i
) (k i ) (k i
i(k)
0.50 0 1 2
X { x ( k ) k , ,,n }
1 2 , where 1 2
i i
X { x ( k ) k , ,,n } i , ,,m
n
k
m
i
k
x
k
x
k
i ii
(
)
(
)
(
1
),
0
,
1
,
2
,
.
2
,
3
...
n
k
m
i
k
x
k
x
R
i
max
i(
)
min
i(
),
0
,
1
,
2
,
.
1
,
2
,
3
...
)
(
0i
k
n k m i R k R k k k k i i ii 1,2, . 2,3...
) ( ) ( 1 1 )) ( ) ( sgn( ) ( 0 0 0
0
0
)
(
)
(
if
0
)
(
)
(
if
1
1
))
(
)
(
sgn(
0 00
(7)
Liu’s Grey Relational Grade Approach. In Liu’s Grey Relational Grade Approach [23], he assumed that the reference series are represented as , and the comparative series are given as the following Equation (8).
, and
Let and
, then
(8)
where is the Grey correlation coefficient of series i and j.
The Improved Grey Slope Relational Grade Approach. The improved Grey Slope Relational Grade (GSRG, for short) approach is proposed by Sun [24], he combined current practical models, and developed his approach with multiple influence factors.
In this model, we assume that the reference series are represented as , and the comparative series are given as
,
and , then the Equation (9) is
presented as below.
(9)
According to the above, the model has achieved a certain effect on the application. Most of the figures reflect the improvements based on the similarity between the data series. However, the procedure of these methods is too complex for data analysis. Therefore, the key factors are how to accurately quantify the geometric relationship of series proximity and similarity and improve the simplicity and practicability of grey relational analysis model.
n k i ik
n
2 00
(
)
1
1
0 0 1 2
X { x ( k ) k , ,,n }
1 2 , where 1 2
i i
X { x ( k ) k , ,,n } i , ,,m
n
k
m
i
k
x
k
x
k
i ii
(
)
(
)
(
1
),
0
,
1
,
2
,
.
2
,
3
...
.
,
2
,
1
,
0
)
(
1m
i
k
s
n k ii
j
i
m
j
i
k
s
k
s
s
n k j iij
.
,
2
,
1
,
0
,
)
(
)
(
1
1
1
ij j i j i ijs
s
s
s
s
ij
0 0 1 2
X { x ( k ) k , ,,n }
1 2 , where 1 2
i i
X { x ( k ) k , ,,n } i , ,,m
n k m i k x k x
k i i
i( ) ( ) ( 1), 0,1,2, . 2,3...
)) ) ( , ) ( max( / ) ) ( , ) ( min( 1 ( 2 1 ) ( ) ( 2 1 1 / )) ( ) ( sgn( ) ( 0 0 0 0 0 0 0 0 i i i i i i i i x k x k x k x k x k x k k k
k
MGSRA Approach: To generate series that show the similarity of the physical characteristics of speed, acceleration, and the original data series of displacement, three sets of data , and are generated as follows:
Step 1: The first set of generating procedure data series: as original data series. The second set of generating procedure data series as below.
.
Step 2: The third set of generating procedure data series as below. , where are reference series for each set, others are compared series for each set. Each set of series will be pre-processing, respectively. Step 3: Then, the Deng's GRG , , and are calculated. Step 4: Calculate that if then , . Thus, each
original series comparative reference series can generate similar physical nature of displacement, velocity, acceleration, and three grey relational grades. By overall considerations, each grey relational grade whichever is greater for the reference series.
Step 5: Set reference series as , and the
comparative series are listed as .
Step 6: Do a second grey relational grade to get the order of the series grey relational grade. The order considerate data series of the development trend of similarity and proximity. As a result, more objective and practical, and the calculation method than are simple.
□
3.
Multi-Generating and Second Grey Relational Analysis
Approach
Due to Deng [8] only considered the similarity between the two series in the analysis process, he did not considered the serial oscillation and trend issues. Therefore, in the analysis of oscillation and distribution of complex data, the results are often not consistent with the actual serial (i.e. they simply look for each variable by the correlation calculations result between two adjacent data series). It does not consider the difference between the changing rate of each variable, and the changes of the relation. Meanwhile, it does not take full examination the data series, which overlooks the changing rate of the potential information, as well as the changing difference of information and oscillation data when there will be a large deviation. Thus, many GSRG approaches [12, 14, 23, 24] were proposed in order to improve the Deng’s GRG approach [8]. For example, the use of the grey relational analysis of B–mode approach
0
i
X X1i
2 i X m i n k k x
Xi { i( ) 1,2, , } 0,1,2, ,
0
, } 1 , , 2 , 1 ) ( ) 1 ( ) ( { 1
1
n k k x k x k x
Xi i i i i0,1,2,,m
, } 2 , , 2 , 1 ) ( ) 1 ( ) (
{ 2 1 1
2 x k x k x k k n
Xi i i i i0,1,2,,m
0
i
i1,2,,m) , (X00 Xi0
(X01,Xi1) ( , )
2 2 0 Xi
X
1
) ,
( 0 t
i t
X X
( 0, p)1
i p
X X
t
p
2
} 2 , 1 , 0 ) , ( max { ˆ 0
0 X X t
X it
t
i
i1,2,3m} 2 , 1 , 0 ) , ( { ˆ 0
X X t
[13] is performed with the concept of similarity and proximity in analyzing the data series trends. In this paper, the data series focus on the rate of changing of potential information. The multi-generating and second grey relational analysis (MGSRA approach, for short) procedure is first proposed in [12], and this paper.
Here, there are three examples calculated by Deng’s GRG model [8], B-mode GRG [13], Slope GRG [16], Cui’s GRG [16] and MGSRA Approach. At first, the Example 1 is given as below.
Example 1. A comparsion between the data series obtained from the Ref. [12, 16]. Assume that four data series are listed as below.
, ,
, ,
where is reference series, and , and are comparative series.
The result of the grey relational grade and data in Ref. [12, 16] are compared with MGSRA Approach in Table 1.
Table 1. Calculated different GRG
Models
Deng's Model GRG [8]
B-mode GRG [13] Slope GRG [16] Cui’s GRG [16] MGSRA
0.739 0.387 0.894 0.910 0.643
0.878 0.643 0.995 1 1
0.568 0.126 0.109 0.053 0.369
Results
(Order) 020103
Note1: abbreviated as
According to the comparison, these approaches are constructed to meet the behavior of the GRGs , and analysis the trends of and . The MGSRA Approach is proved to be fully reflecting its similarity between these series based on the results of GRG.
Example 2. The comparsion of the data series selected from the Ref. [12, 23]. Assume that four data series are listed as below.
, , , , 6.4} 5 4.6 3 2.8 2.5 1.3 {1 0 X 4.5} 4 3.5 3 2.5 2 1.5 {1 1 X 7.14} 5.6 5.16 3.4 3.18 2.85 1.53 {1.2 2 X 6} 7 2 5 1 3 2.5 {1 3 X 0
X X1 X2 X3
01
02
03
03 0102
020103 020103 020103
) , (X0 Xi
0i03 01
02
X0 X2
where is reference series; , and are comparative series.
The results of calculations of GRG and relation order with Liu’s calculation models [23] are compiled with MGSRA Approach in Table 2.
Table 2. The comparison of Dang, Cao, Liu and our model [12] for GRG calculations Models Dang’s GRG
(1994) [23]
Cao’s GRG
[23] Liu’s GRG [15] MGSRA
0.962 1 0.9615 0.7693
0.880 0.880 0.8906 0.7435
0.7642 0.9759 0.7424 0.6615
Results (Order)
The computing model is constructed in this paper, and obtains the results . It meets the characteristics of the GRG, and shows this model is feasibility and effectiveness.
Example 3. A comparsion of the data series chosen from the Ref. [12, 24]. Assume that four data series are listed as below.
, , ,
,
where is reference series; , and are the comparative series.
The results of calculations, in this paper, the GRG and relation order with Sun’s calculation are compiled with MGSRA Approach in Table 3.
Table 3. The comparison of GRG calculations with Sun and our model Models Dang’s
GRG(1994) [24]
Dang’s
GRG(2004)[24] Sun’s GRG[24] MGSRA
0.9742 0.9783 0.9867 0.8927
0.9295 0.9239 0.8040 0.4057
0.9277 0.9238 0.8133 0.5822
Results (Order)
In fact, after analyzing the results of the GRG, it can be seen that Dang's GRG cannot reflect the true closeness of the series curves. Therefore, the MGSRA Approach is constructed to further compare with Sun’s model [24] in order to improve the validity of the results. According to the above, the proposed MGSRA Approach is an improved method in comparison with the previous grey relational analysis methods [8, 16, 23, 24]
0
X X1 X2 X3
01
02
03
03 02 01 010302 010203 010203
03 02
01
6} 5 3 2.5 2.5 2 {1 0 X 5.8} 4.8 2.8 2.4 2.3 1.8 {1 1 X 5.7} 4.1 3 2.2 2.3 1.8 {1 2 X 5.8} 4.3 3 2.2 2.5 2.08 {1 3 X 0
X X1 X2 X3
01
02
03
03 02 01 in candidate selection in soft-handover procedure. The existing grey relational analysis methods can be broadly divided into three categories. One stressed that the absolute displacement difference between the reference series and comparative series. Another emphasizes the reference series and comparative series in terms of the relationship of data change rate. The third one is considering the relation between the aforementioned, discussing both the absolute displacement difference between the series and the series itself, and the related change rate. In particular, the last one is a more comprehensive presentation of the geometric similarity between the data series. However, these methods increase the complexity and uncertainty of the parameters of the model [25]. To develop a procedure series that also examines the similarity in the velocity and acceleration of data series, we measure not only the original data, but also two more sets of series. The applications of traditional Deng’s grey relational grade only do two times of computing on grey relational grades for comprehensive response. In this paper, we first propose a new grey relational analysis method, the MGSRA Approach, to discuss and analyze the problems like requirements on data size, typical distribution pattern, and small amount of calculations.
Finally, the results of simulation show that this procedure has more feasibility and effectiveness than others. The grey relational computing model gains the advantages compared with the previous studies. It is simpler and retains the Deng’s grey relational grade and meets the four axioms.
4.
Approach for Selecting Candidates in Soft-Handover
Procedure Using MGSRA
4.1. MGSRA candidate target cell selecting for soft-handover procedure
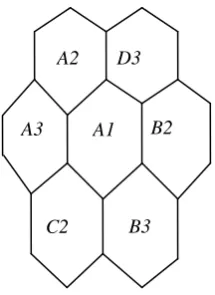
For the fundamental cellular communication model as shown in the Fig.1, MGSRA candidate target cell selecting for soft-handover procedure in the proposed scheme is defined with four factors P, Q, W, I, which are presented as the following Equation (10).
Cell x = (P, Q, W, I) (10)
where x = {A1, A2, A3, B2, B3, C2, D3}, and P is the reference signal received power, which is the power level of the received signal in the mobile station and including the signals from the current serving cell and neighbor cells; Q is the reference signal received quality; W is the received signal strength indicator, which is the total received wideband power observed by the UE from all sources; I is real-time idle channel numbers.
The approach for selecting candidate target cells in soft-handover procedure using MGSRA Approach (MGSRA Candidate-selecting Procedure, for short) in the 4th generation mobile communication is described as below.
MGSRA Candidate-selecting Procedure
Input: Cell x= (P, Q, W, I), where x = {1, 2, 3, 4, 5, 6, 7}, where the reference signal received power (RSRP, denoted P), reference signal received quality (RSRQ, denoted Q), received signal strength indicator RSSI (Distance, denoted W), idle channel number (ICN, denoted I).
Output: The target cell, and candidate cells
Step 1: Sort the reference signal received powers, where all the results of reference signal received powers are sorted are from high to low. The highest one will be chosen to be the next serving cell called target cell, Cell x’, according to the rule of existing mobile communication system. Step 2: Perform MGSRA Approach, and generate the result of the grey relational
grades of the series comparing with the Cell x’, which has the highest received power
Step 3: Sort the result of series via the comparison of grey relational grades. Step 4: Choose the candidate cells from the series, where the numbers of
candidate cells are depending on the mobile communication system.
4.2. MGSRA candidate target cell selecting for soft-handover procedure
present as the input for the proposed procedure. In this example, each data is assigned the equal weight for the initial simulation in the first round. They are discussed in the following case studies, Case I and Case II. For each case study, the corresponding data set will be performed by MGSRA Candidate-selecting Procedure, individually.
Fig. 1. Typical cellular communication model (Cell A1: serving cell)
Case I. The measured data set collected by a UE for Case I is listed as below.
P Q W I
Cell A1=(6.0,5.0,7.0,4.0) the original serving Cell x for UE Cell C2=(9.0,9.0,8.0,5.0)
Cell B3=(9.0,9.0,8.0,4.0)
Cell B2=(5.0,3.0,5.0,8.0)
Cell A3=(2.0,1.0,7.0,1.0)
Cell D3=(1.0,1.0,4.0,3.0)
Cell A2=(1.0,2.0,1.0,7.0)
To perform MGSRA Candidate-selecting Procedure, the measured data of serving cell and neighborhood cells are inputted as below.
A1 A3
C2 B3
P Q W I Cell A1=(6.0,5.0,7.0,4.0)
Cell C2=(9.0,9.0,8.0,5.0)
Cell B3=(9.0,9.0,8.0,4.0)
Cell B2=(5.0,3.0,5.0,8.0)
Cell A3=(2.0,1.0,7.0,1.0)
Cell D3=(1.0,1.0,4.0,3.0)
Cell A2=(1.0,2.0,1.0,7.0)
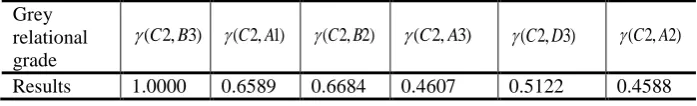
Step CI-1:Sort the inputs according to the reference signal received powers. All the reference signal received power are sorted from high to low. Thus, the Cell C2 is chosen to be the target cell by UE, and Cell B3, A1, B2 in descending orderfor the candidate target cells according to the rule of existingmobile communication system. The sorted results are listed as below.
P Q W I
Cell C2=(9.0,9.0,8.0,5.0) the target Cell x’ for UE
Cell B3=(9.0,9.0,8.0,4.0) the first candidate target cell for UE Cell A1=(6.0,5.0,7.0,4.0) the second candidate target cell for UE Cell B2=(5.0,3.0,5.0,8.0) the third candidate target cell for UE Cell A3=(2.0,1.0,7.0,1.0)
Cell D3=(1.0,1.0,4.0,3.0)
Cell A2=(1.0,2.0,1.0,7.0)
Step CI-2:After Step CI-2, MGSRA Approach is performed. Theresults of the series of grey relational grades comparing with Cell C2, the highest received power, are listed as below.
C ,B2 3
1 ;
C , A2 1
0 6589. ;
C ,B2 2
0 6684. ;
C , A2 3
0 4607. ;
C ,D2 3
0 5122. ;
C , A2 2
0 4588. .
Step CI-3:After calculating the MGSRA Approach, the results are listed in Table 4.
Table 4. The results of the series of grey relational grades comparing with Cell C2, the highest received power
Grey relational grade
Results 1.0000 0.6589 0.6684 0.4607 0.5122 0.4588 ( 2, 3)C B
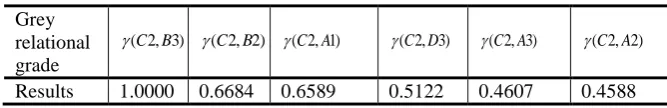
Step CI-4:The results of candidate series are Cell B3, Cell B2, and Cell A1 in descending order. Thus, UE can choose the Cell B3 and CellB2 to be the first candidate cell and the second candidate cell, individually, from Table 5, where the number of candidate cells is chosen based on the mobile communication system. The results in Table 5 are sorted and listed in descending order as below.
P Q W I
Cell C2=(9.0,9.0,8.0,5.0) the target Cell x’ for UE Cell B3=(9.0,9.0,8.0,4.0) the first candidate cell for UE Cell B2=(5.0,3.0,5.0,8.0) the second candidate cell for UE Cell A1=(6.0,5.0,7.0,4.0) the third candidate cell for UE Cell D3=(1.0,1.0,4.0,3.0)
Cell A3=(2.0,1.0,7.0,1.0)
Cell A2=(1.0,2.0,1.0,7.0)
Table 5. The sorted results of the series of grey relational grades Grey
relational grade
Results 1.0000 0.6684 0.6589 0.5122 0.4607 0.4588
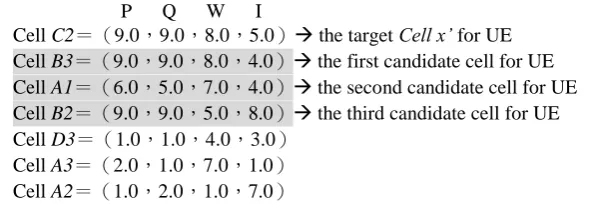
Case II. The measured data set collected by a UE for Case II is listed as below. P Q W I
Cell A1=(6.0,5.0,7.0,4.0) the original serving Cell x for UE Cell C2=(9.0,9.0,8.0,5.0)
Cell B3=(9.0,9.0,8.0,4.0)
Cell B2=(9.0,9.0,5.0,8.0)
Cell A3=(2.0,1.0,7.0,1.0)
Cell D3=(1.0,1.0,4.0,3.0)
Cell A2=(1.0,2.0,1.0,7.0)
To perform MGSRA Candidate-selecting Procedure, the measured data of serving cell and neighborhood cells are inputted as below.
P Q W I Cell A1=(6.0,5.0,7.0,4.0) Cell C2=(9.0,9.0,8.0,5.0)
Cell B3=(9.0,9.0,8.0,4.0)
Cell B2=(9.0,9.0,5.0,8.0)
Cell A3=(2.0,1.0,7.0,1.0)
Cell D3=(1.0,1.0,4.0,3.0)
Cell A2=(1.0,2.0,1.0,7.0)
( 2, 3)C B
Step CII-1: Sort the inputs according to the reference signal received powers. All the reference signal received power are sorted from high to low. Thus, the Cell C2 is chosen to be the target cell by UE, and Cell B3, Cell A1, and Cell B2 in descending order for the candidate target cells according to the rule of existing mobile communication system. The sorted results are listed as below.
P Q W I
Cell C2=(9.0,9.0,8.0,5.0) the target Cell x’ for UE
Cell B3=(9.0,9.0,8.0,4.0) the first candidate target cell for UE Cell B2=(9.0,9.0,5.0,8.0) the second candidate target cell for UE Cell A1=(6.0,5.0,7.0,4.0) the third candidate target cell for UE Cell A3=(2.0,1.0,7.0,1.0)
Cell D3=(1.0,1.0,4.0,3.0)
Cell A2=(1.0,2.0,1.0,7.0)
Step CII-2: After Step CII-1, MGSRA Approach is performed. Theresults of the series of grey relational grades comparing with Cell C2, the highest received power, are listed as below.
C ,B2 3
1 ;
C ,B2 2
0 4908. ;
C , A2 1
0 6133. ;
C , A2 3
0 4026. ;
C ,D2 3
0 4578. ;
C , A2 2
0 3984. .
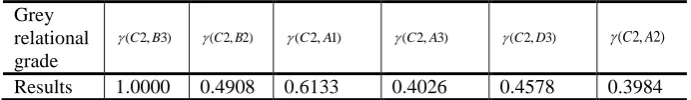
Step CII-3: After calculating the MGSRA Approach, the results are listed in Table 6.
Table 6. The result of series of grey relational grades comparing to the cell which has the highest received power
Grey relational grade
( 2, 3)C B
( 2, 2)C B ( 2, 1)C A ( 2, 3)C A ( 2, 3)C D ( 2, 2)C A
Results 1.0000 0.4908 0.6133 0.4026 0.4578 0.3984
P Q W I
Cell C2=(9.0,9.0,8.0,5.0) the target Cell x’ for UE Cell B3=(9.0,9.0,8.0,4.0) the first candidate cell for UE Cell A1=(6.0,5.0,7.0,4.0) the second candidate cell for UE Cell B2=(9.0,9.0,5.0,8.0) the third candidate cell for UE Cell D3=(1.0,1.0,4.0,3.0)
Cell A3=(2.0,1.0,7.0,1.0)
Cell A2=(1.0,2.0,1.0,7.0)
Table 7. The sorted results of the series of grey relational grades Grey
relational grade
Results 1.0000 0.6133 0.4908 0.4578 0.4026 0.3984
Finally, according to the above Case I and Case II, after dealing with them, MGSRA candidate-selection procedure could get the proof that it could accurately and fast find the candidates out through distinct overall measured data.
5.
Conclusions
The MGSRA Candidate-selecting Procedure could find easily the candidates out, through considering multiple measured factors on the same time instead of the traditional approach only satisfying one of the conditions in RSRP, RSRQ, and RSSI. ICNs are assumed that it should be periodically by serving cell and neighborhood cells via some common channel, and be collected by UE. It is a very special factor that is a novel idea in order to achieve the UE’s viewpoint. The proposed procedure could be performed to select the candidate target cells by UE instead of eNodeB. Therefore, it is the first proposed approach could choose the candidate target cells through comparing multiple measured data for candidate-selecting with the target cell. Moreover, it could be easily applied to soft-handover procedure for 3th generation or 4th generation mobile communication systems. In conclusion, the MGSRA Approach is proved to be an effective means to apply in selecting candidates in soft-handover procedure for 3th generation or 4th generation mobile communications. With several simulations are validated, the approach can be used to select the candidates in soft-handover procedure, and obtain the best results of feasibility and effectiveness for UE in 4th generation mobile communications.
Acknowledgements. This work was supported in part by the National Science Council, Taiwan, Republic of China, under Grant NSC 102-2221-E-468-007, also by Asia University, Taiwan, under Grant 101-asia-28.
( 2, 3)C B
References
1. Dahlman E., Parkvall S., Sköld J., Beming P.: 3G Evolution: HSPA and LTE for Mobile Broadband. (2007)
2. Jeong H.D.J., Lim J., Hyun W., An A.: A Real-time Location-based SNS Smartphone Application for the Disabled Population. Computer Science and Information Systems, Vol. 10, No. 2, 747–765. (2013)
3. Hofestadt, H.: GSM-R: Global System for Mobile Radio Communications for Railways. In Processding of International Conference on Electric Railways in a United Europe, Amsterdam, Netherlands, 111–115. (1995)
4. Barbu G.: E-TRAIN–Broadband Communication with Moving Trains. International Union of Railway. (2008)
5. European Telecommunications Standards Institute (ETSI): Requirements for support of radio resource management. 3GPP TS 36.133 V10.5.0. (2012)
6. Anas M., Calabrese F.D., Mogensen P.E., Rosa C., Pedersen K. I.: Performance Evaluation of Received Signal Strength Based Hard Handover for UTRAN LTE. Department of Electronic Systems, Aalborg University, Nokia Networks. (2007)
7. Wikipedia: History_of_mobile_phones. [Online].
http://en.wikipedia.org/wiki/History_of_mobile_phones. (2012)
8. Deng J.: Method of Grey Theory. In Processding of Wuhan Huazhong of University Science and Technology, 37–138. (2002)
9. Chen H.C., Cahyadi Y., Marsha A.V.: A Grey Prediction Based Hard Handoff Hysteresis Algorithm for 3GPP LTE System. In Processding of International Conference on Broadband and Wireless Computing, Communication and Applications (BWCCA 2012), University of Victoria, Victoria, Canada, 590–595. (2012)
10. Chen H.C., Cahyadi Y., Deviani R., Liu T.W., Wen J.H.: Using GM (1, 1) Model to Forecast the Trend of Research in Internet of Things. In Processding of International Conference on Automatic Control and Artificial Intelligence (ACAI 2012), The Institution of Engineering and Technology (IET), Xiamen, China, 2247 – 2250. (2012)
11. Chen H.C., Deviani R., Shih N.Y., Liu C.C., Cahyadi Y.: Application of GM (1, 1) Model for Forecasting Research Trends of Security in Internet of Things. In Processding of the 5th IET International Conference on Ubi-media Computing (U-Media 2012), The Institution of Engineering and Technology (IET), 47-51, Xining, China. (2012)
12. Shih N.Y., Chen H.C.: Multi-Generating Procedure and Second Grey Relational Analysis. In Processding of 2013 Seventh International Conference on Innovative Mobile and Internet Services in Ubiquitous Computing (IMIS 2013), 601-604, Asia University, Taiwan, July 3-5. (2013)
13. Wang Q.Y.: The Grey Relational Analysis of B-Mode. The Journal of Huazhong University of Science and Technology, Vol. 17, 77–82. (1989)
14. Dang Y., Liu S., Liu B., Mi C.: Improvement on Grade of Grey Slope Incidence. Engineering Science, Vol.6, No.3, p23– 26. (2004)
15. Liu S., Guo T. B., Dang Y.: Grey System Theory and Application. Science Publisher: Beijing, 46–63. (2010)
16. Cui L.Z., Liu S.F., Li Z.P., Cui J.: Study on Grey Slope Similarity Incidence and Its Applications. Statistics & Information Forum, Vol. 25, No. 3. (2010)
17. Rezaei et.al.: Grey Prediction Based Handoff Algorithm. World Academy of Science, Engineering and Technology. (2005)
18. Dahlman E., Parkvall S., Sköld J., Beming P.: 3G Evolution: HSPA and LTE for Mobile Broadband. (2007)
19. Deng J.L.: Introduction of grey system. Journal of Grey System. Vol. 1, No. 1, 1–24. (1989) 20. Kuo Y.Y., Yang T., Huang G.W.: The Use of Grey Relational Analysis in Solving Multiple
21. Chan J.W.K., Tong T.K.L.: Multi-Criteria Material Selections And End-Of-Life Product Strategy: Grey Relational Analysis Approach. Materials & Design, Vol. 28, No. 5, 1539– 1546. (2007)
22. Shih N.Y., Liu H.C.: Intelligent Estimation of Distinguishing Coefficient in Grey Relational Grade. In Proceedings of Cross-Strait Conference on Information Science and Technology, 88–94. (2008)
23. Liu W., He X.: A New Grey Relational Grade Mode. Statistics and Decision, Vol.14, 160– 161. (2011)
24. Sun Y.G., Dang Y.G.: Grey Slope Relational Grade Improved Mode. L. Ilu Nxintan, Vol.8, 12–13. (2007)
25. Yin H.Z., Liu B., Zhang H., Zhang R.: A New Computation Model of Incidence Grade Met Four Axioms of Grey Incidence. Henan Science, Vol. 24, No. 2, 162–165. (2006)
Neng-Yih Shih was born in Changhua, Taiwan, in 1959. He received his B.S and M.S. degrees in the Department of Automatic Control Engineering, from Feng Chia University, Taiwan, in 1982 and 1984. He received a Ph.D. degree in Institute of Aeronautics and Astronautics from the Nation Cheng Kung University, Taiwan, in 2001. He is currently an associate professor with the Department of Computer Science and Information Engineering, Asia University, Taiwan. He is also Secretary General of Asia University, a position he has held since Aug. 2011. His main research interests include the application of expert control, networked control system and intelligent systems.
Hsing-Chung Chen (Jack Chen) is the corresponding author of this paper. He received the Ph.D. degree in Electronic Engineering from National Chung Cheng University, Taiwan, in 2007. During the years 1991-2007, he had served as a Mobile Communication System Engineer at the Department of Mobile Business Group, Chunghwa Telecom Co., Ltd. From Feb. 2008 to Feb. 2013, he was the Assistant Professor of the Department of Computer Science and Information Engineering at Asia University, Taiwan. Since February 2013–present, he is the Associate Professor at the same University. He is also the Research Consultant of Department of Medical Research at China Medical University Hospital, China Medical University Taichung, Taiwan. Currently, he is interested in Information Security, Cryptography, Role-based Access Control, Computer Networks and Wireless Communications. He was Program Co-Chair of numerous conferences. Dr. Chen was the Editor-in-Chief of Newsletter of TWCERT/CC from July 2012 to June 2013.
![Table 2. The comparison of Dang, Cao, Liu and our model [12] for GRG calculations](https://thumb-us.123doks.com/thumbv2/123dok_us/1175888.1620250/9.595.126.468.522.627/table-comparison-dang-cao-liu-model-grg-calculations.webp)