www.scienceworldjournal.org ISSN 1597-6343
Spatio-Temporal Variations Of Top Soil Coarsening As A Pedo-Geomorphic Indicator Of Land Degradation And Desertification Status In A Part Of
Semi-Arid Zone Of Nigeria
SPATIO-TEMPORAL VARIATIONS OF TOP SOIL COARSENING AS
A PEDO-GEOMORPHIC INDICATOR OF LAND DEGRADATION
AND DESERTIFICATION STATUS IN A PART OF SEMI-ARID ZONE
OF NIGERIA
1Ndabula, C., 1Jidauna, G.G., 3Oyatayo, K., 4Iorkua, S.A., and 5Iguisi, E.O.
1Department of Geography and Regional Planning, Federal University Dutsin-Ma, Katsina State
2Department of Geography, Ahmadu Bello University Zaria, Kaduna State, Nigeria 3Department of Geography, Kwararafa University Wukari, Taraba State, Nigeria 4Department of Geography, Benue State University, Benue State, Nigeria
Corresponding author: [email protected]/[email protected]
ABSTRACT
Soil degradation is commonly mentioned as an indicator of desertification, not much is focused on specific form of soil degradation such as top soil coarsening which is rarely studied with respect to desertification. The major aim of this study therefore, is to assess the spatio-temporal patterns of top soil coarsening as a pedo-geomorphic indicator of desertification status (extent, rate and magnitude) in the semi-arid zone of Nigeria. This achieved using top soil grain size index (GSI) evaluated from remotely sensed reflectance of three (3) bands R, B and G of multi-temporal Landsat images (TM, 1987; ETM+, 2000 and OLI/TIR, 2015) and computed using a ratio algorithm. The multi-temporal sets of GSI (1987, 2000 and 2015) were generated from corresponding temporal Landsat images and top soil grain size sensitivity index (GSSI) was evaluated from the sensitivity analysis of the geometric mean of the three sets of GSI. Each of the temporal GSIs and the GSSI were segmented into five (Very High, High, Moderate, Low and Very Low) sensitivity to desertification areas. Result show that there is a generalized temporal trend of increasing intensity of top soil fine sand content or coarsening and hence desertification in the study area. Although the intensity varies among all the respective sensitivity areas mapped. For instance the highest intensity of 21.15% was recorded in the Very High Sensitivity Area, followed by Moderate (18.39%), High (17.50%), Low (12.82%) and Very Low (7.53%). The spatial extents of the distribution of top soil coarsening or fine sand content show a decline in the Very High and High Sensitivity Areas at annual rates of 1.46 and 1.39 km2 respectively, while in the Moderate, Low and Very Low Sensitivity Areas expansion at annual rates 1.17, 1.38 and 1.38 Km2 respectively. Dynamic rate for the period (1987-2015) among sensitivity areas stood at Very High (3.56%), High (1.36%), Moderate (3.32%), Low (8.63%) and Very Low (43.74%). The single factor ANOVA analysis at 0.05 level of significance showed that there is significant variation in the change in top soil coarsening over the period (1987-2013) as well as among the various desertification sensitivity areas.
Key words: Desertification, Pedo-geomorphic, Indicator, Top Soil, Coarsening, Grain Size
INTRODUCTION
Desertification is a climate-related eco-geomorphic hazard and slow-onset disaster characterized by persistent exposure and sensitivity to adverse biophysical perturbations caused by both proximate and underlying biophysical and socio-economic factors resulting in land degradation mainly but not exclusively in arid, semi-arid and dry sub-humid areas (Ndabula, 2015). It also sustains a progressive shifting and conversion of the eco-geomorphic systems towards desert-like state. The cost (economic, technologic, and chronologic) of reversibility increases with the extent, rate and intensity of land degradation and desert-like state and becomes irreversible only if neglected to exceed a certain threshold to convert into desert landscape (Ndabula, 2015). Climatic conditions together with geomorphologic processes help to mould desert-like soil surface features in arid zones (Xiao et al., 2006). The identification of these soil features serves as a useful input for understanding the desertification process and land degradation as a whole (Shrestha et al,. 2005). Top soil coarsening is one of the most visible signs and symptoms of soil degradation and desertification in semi-arid lands
Top soil coarsening is one of the aspects of soil degradation that is not commonly studied especially with respect to desertification. Top soil coarsening is a form of soil degradation whereby there is the concentration of the top soil, of coarser sandy particles that would ordinarily be randomly distributed throughout the top soil. This occurs when the finer particles are removed by erosion (Xiao et al., 2006). Major causes include human activities such as over-grazing, over-cultivation and climatic factors such as high rainfall and wind storms intensities.
Among the few studies of top soil coarsening as an indicator of land degradation and desertification (Su et al., 2004; Xiao et al., 2006; Wang et al., 2006; Wang et al., 2008; Hongyanet al., 2008;and Macchiato et, al., 2008). Soil particle size distribution is one of the most important physical attributes in soil systems (Hillel et, al., 1980). Particle size distribution characterizes the soil texture and other physical properties such as the movement and retention of water, solutes, heat and air and thus changes in soil grain size distribution greatly affects soil fertility (Su et, al., 2004). It is on the basis of this that Su et, al. (2004) and Xiao et, al. (2006) posited that changes in top soil grain size distribution was useful parameter for monitoring soil degradation and desertification process. Wang et, al. (2006, 2008) showed that
Fu
ll L
en
gt
h Rese
ar
ch
Ar
Spatio-Temporal Variations Of Top Soil Coarsening As A Pedo-Geomorphic Indicator Of Land Degradation And Desertification Status In A Part Of
Semi-Arid Zone Of Nigeria landuse has considerable influence on particle size distribution.
Hongyanet, al. (2008) had examined both climatic and anthropogenic influences on top soil distribution in semi-arid east Asian, steppe using four environmental/human activity factors; mean annual temperature (MAT), mean annual precipitation (MAP) and human disturbance index (HDI) and landuse/landcover (LULC).Major causes of topsoil coarsening include overgrazing and over cultivation which tend to accentuate both wind and water erosion (FU et al., 2002) which entrenches finer soil particles thereby increasing concentration of coarser sand particles in the top soil.
The focus on examining top soil coarsening among other aspects of soil degradation is increasingly important in view of its diverse implications on other aspects of soil fertility. It is generally reported that Soil Organic Carbon (SOC) content is negatively correlated with coarse sand percentage implying that reduction of soil fertility is linked to top soil coarsening (Liu etal., 2007). Soil degradation due to topsoil coarsening results in soil compaction and reduction in primary productivity of the soil (Noy-Meir, 1973). Xiao et al., (2006) found that in inner Mongolia the GSI has a positive correlation with fine sand content. The more severe the desertification, the coarser the topsoil grain size composition (ie coarse grains >2mm). top soil coarsening also affects soil bulk density.
MATERIALS AND METHODS Study Area
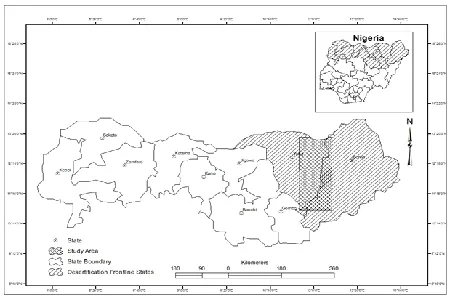
The Sudano-sahelian ecological zone of Nigeria has its southern boundary crossing latitude 12oN on the western frontier to latitude 10oN 30’ on the eastern frontier, extending to latitude 14oN as the northernmost boundary (Kowal and Knabe, 1972; Mortimore, 1989). The generally low lying relief plains of the Chad Basin is geologically a sedimentary formation, but the Yobe axis of the study area principally comprises crystalline and sedimentary rocks, underlain by basement complex rocks. The climate is semi-arid with wide seasonal and diurnal temperatures. A long dry season is followed by a single short wet season. The high intensities rainfalls and strong Harmattan (NE easterly) trade wind are the dominant geomorphic agents influencing the fluvial and aeolian processes respectively to account for this semi-arid geomorphic landscape pattern. The soils of Borno-Yobe vary in color, texture, structure, physic-chemical and other essential characteristics. Fig3.1.2.4 reveals the distributin of soil. Vertisols (dark heavy clay soils (firkin)) dominate the flat plains close to Lake Chad and most parts of wetlands and floodplains. Regosols found mainly in the sand dunes are shallow with weakly developed profiles. The vegetation is dominantly of sudan and sahel savanna and is characterized by sparse shrubs, grasses and woody trees.
Fig 1: Desertification Frontline States Showing the Study Area Source: Ndabula, 2015
Data Type and Sources
Multi-temporal Satelite images (landsat.TM, 1987, ETM+ , 2000 and OLI/TIR, 2015) were downloaded from the GLCF. The selection of images was based on availability and systematic sampling at an approximate 15 year interval. Also the use of only Landsat images is based on the fact that when selecting RS data for change detection application, it is important to use images of the same sensor, radiometric and spatial resolution and near acquisition dates in order to minimize effects of external sources such as sun angle, seasonal and phenological differences. First of all, optical images of high resolution were preferred over microwave, since most of the biophysical indices require information that are captured in the Visible, NIR and Thermal bands. High resolution Landsat.TM, Landsat.ETM and Landsat.OLI/TIR provided better spectral, spatial and radiometric properties for extraction and computation of biophysical indices especially of vegetation and soil conditions,
Image Preprocessing Techniques
In most cases it is preferable to convert satellite image data to physical quantities such as Surface or Top of Atmosphere (TOA) spectral radiance and reflectance, before using the data to interpret the landscape. It is the surface or TOA spectral reflectance that is characteristic of a particular surface type. The objective of image pre-processing was to prepare image bands for reliable and accurate information extraction of landscape biophysical characteristics, which depends heavily on using physically derived quantities from satellite images. The pre-processing was performed on band x band basis.
Band x Band radiance and reflectance correction using ENVI software using landsat metadata as contained in the USGS handbook user guide that came with the images.
Band x Band resampling of the multi-temporal data sets of landsat images in ArcGIS software
Band x Band mosaicing and subseting of the study area in Erdas imaging software
The following pre-processing operations were performed in the order below
Conversion of calibrated Digital Numbers (DNs) to radiance Dark Object Subtraction (DOS)
Conversion of radiance to reflectance values Conditional enforcement of positive values Reprojection
Spatio-Temporal Variations Of Top Soil Coarsening As A Pedo-Geomorphic Indicator Of Land Degradation And Desertification Status In A Part Of
Semi-Arid Zone Of Nigeria Mosaicing
Subsetting
Conversion to surface or top of the atmosphere (TOA) radiance
LandSat images used in this study were not in the original USGS GeoTIFF with metadata format. Hence, conversions of Qcal –to- Lλ were not automatically computed in GIS software. For landSat data not in the original USGS GeoTIFF with metadata format, conversion of Qcal –to- Lλ need to be manually computed. Two methods were used, depending on the scene calibration data available in the header file(s). The two methods and formulas have been adapted from USGS (2001) Landsat handbook. Preliminary field reconnaissance was conducted to aid image interpretation
Evaluation and mapping of top soil grain size index (GSI) and sensitivity index (GSSI)
Top soil grain size index computes the ratio of three (3) bands R, B and G. Top Soil Grain Size Index (GSI) for the three multi-temporal landsat datasets were first evaluated and mapped using the algorithm developed by (Xiao et al., 2006)
GSI= (R - B)/(R + B+ G) ……….. (1)
Where, R = band3, G = band2, B = band1, NIR =band4 for landsat TM amdETM+ and R = band4, G = band3, B = band2, NIR = band5 for landsatOLI/TIR
The GSSI was then evaluated and mapped from the geometric mean of the three GSI datasets
GSSI= ∑(GSI_87 + GSI_2000+ GSI_2013)1/3.
The multi-temporal sets of GSI (1987, 2000 and 2013) are generated from corresponding temporal landsat images and GSSI from the sensitivity analysis of the geometric mean of the three sets of GSI that have been generated in raster map format. GSSI= ∑(GSI_87 + GSI_2000+ GSI_2013)1/3
All the GSI and GSSI raster maps were classified into vulnerability classes using natural breaks (Jenks, 1967; 1977) to reveal spatio-temporal patterns based on hierarchical organization in the landscape. The extent, rate and intensity of change were computedusing the landuse/landcover change structures approach suggested by Wang et, al (2010) and applied by Ndabulaet al.,2013).
Annual rate of conversion or change (L) was computed using the logarithmic approach of Landis (2001).
Annual rate of conversion or change (L) was computed using the logarithmic approach of Landis (2001).
L=10(log (Ubi-Uai))/T ………(2) Where;
L= Rate of conversion or change
Ubi= Areal extent of landcover at the beginning of study Uai= Areal extent of landcover at the end of study T= period between the beginning and the end
NB: this logarithmic approach according to (Landis, 2001) gives better estimates than the direct approach that divides rate of
change by time (Ubi-Uai/T)
Landcover/landscape Change Intensity Index (Ti): the extent of a particular landcover change divided by total land area (B) in the study period. It can be used to compare the strength of land use change or potential trends (Wang, 2010). It measures landcover change in the breadth and depth and thus a good measure of magnitude or intensity of landcover change.
Ti = (Ubi-Uai)/B……….(3)
Ti = intensity of the landcover change in the study period. Uai = Areal extent of landcover at the beginning of study Ubi = Areal extent of landcover at the end of study B = total areal extent of study area
Landcover/landscape Dynamic Index: This is the rate of change of landcover type within a certain period of time (Wang, 2010)
K = Ubi –Uai X 1 X 100% ………..(4) Uai T
K = Built-up dynamic index for landcover within study period. Uai= Areal extent of landcover at the beginning of study Ubi = Areal extent of landcover at the end of study T = study Period.
NB: This approach differs from rate of growth used in (a) above
RESULTS AND DISCUSSIONS
According to Xiao et al, (2006) top soil grain size has a positive correlation with fine sand content. Where higher values represent higher finer rather than coarser sand content and hence decreasing top soil coarsening and lower values less finer and coarser sand content and hence increasing top soil coarsening and thus desertification. Higher values towards 1.0 signify high fine sand content and hence high tendency of top soil coarsening while negative values or nearly 0 represent water or dense vegetation. Top soil coarsening or increasing fine sand content may result from the gradual loss in clay and silt likely due to water or wind erosion.
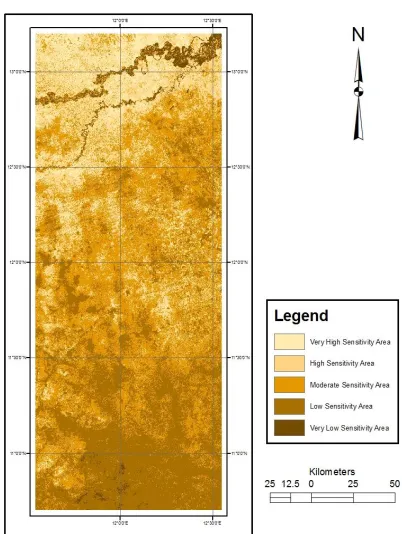
Results revealed in Figs 1a, 1b, 1c and 1d indicates inter annual temporal increasing trend as seen in the values of GSI; In 1987 (-0.143 to 0.456), 2000 (-0.107 to 0.497) and 2015 (-0.079 to 0.515). the upper limit positive values has been increasing steadily from 0.456 in 1987 to 0.497 in 2000 and 0.515 in 2915 signifying increasing top soil coarsening. This implies that the analysis of sensitivity areas leaves the northernmost Very High, High and Moderate higher sensitivity areas as increasing top soil coarsening. On the other hand the lower negative values have been decreasing steadily from 0.143 in 1987 to 0.107 and -0.079 in 2015 signifying increasing vegetation regeneration and recovery from desertification especially in the Low and Very Low sensitivity areas to the south of the study area. However, the GSSI which seeks to show long term mean values revealed values in the range of -0.084 to 0.420 hence top soil coarsening is caused by short term changes in land surface conditions such as climatic variations, vegetation changes and human activities such as grazing and cultivation.
From Figs 2a, b, c, and d and the respective Tables 1a, 1b, 1c and 1d all show that there is a generalized temporal trend of increasing intensity of top soil fine sand content or coarsening and hence desertification in the study area. Although the intensity
Spatio-Temporal Variations Of Top Soil Coarsening As A Pedo-Geomorphic Indicator Of Land Degradation And Desertification Status In A Part Of
Semi-Arid Zone Of Nigeria varies among all the respective sensitivity areas mapped. For
instance the highest intensity of 21.15% was recorded in the Very High Sensitivity Area, followed by Moderate (18.39%), High (17.50%), Low (12.82%) and Very Low (7.53%). These inter annual spatio-temporal patterns of change in intensity can be attributed to short term climatic variations such as seasons, dry spells, and droughts. Also human activities such as grazing, cultivation that reduce vegetation cover are at the root of these desertification dynamics.
The spatial extents of the distribution of top soil coarsening or fine sand content show a decline in the Very High and High Sensitivity Areas at annual rates of 1.46 and 1.39 km2 respectively, while in the Moderate, Low and Very Low Sensitivity Areas expansion at annual rates 1.17, 1.38 and 1.38 Km2 respectively. Dynamic rate for the period (1987-2015) among sensitivity areas stood at Very High (3.56%), High (1.36%), Moderate (3.32%), Low (8.63%) and Very Low (43.74%). In Table 1a it can clearly be seen that inter annual patterns among sensitivity areas tend to fluctuate in some cases while in others they reveal a steady pattern. For instance, in the Very High, Moderate and Low sensitivity areas they pattern is erratic fluctuations among the years under review, while in the High and Very Low sensitivity areas steady expansion has been observed. The study went further applied the Top Soil Grain Size Sensitivity Index (GSSI) to examine mean extents and rates of top soil coarsening among the sensitivity areas. Results indicated mean extents are as follows; Very High (1618 Km2), High (7266 Km2), Moderate (13154 Km2), Low (6017 Km2) and Very Low (2517 Km2).
Top soil coarsening as observed in this study may have resulted from loss of fine grain fractions due to human activities such as over-grazing and over-cultivation through erosion and also an increase in coarse grain fractions by climatic changes. This study disagree in part with the report of Abubakar et al (1999) which said there was no top soil coarsening. However it agrees in the aspect of increasing regeneration of vegetation and thus top soil coarsening since in the southern parts were decreasing GSI values of negative to zero values signifies vegetation increase. Post analysis field corroboration observed this phenomenon mostly on badlands where either due to grazing, or over-cultivation the top soil compaction has resulted in hard panning of soil surface. These areas have shown very clear visible signs of poor or reduced primary production or decline in vegetation cover as posited by Noy_Meir (1973). Primary production in arid and semi arid regions is higher on coarse texture soils, than on fine texture soils, but when top soil coarsening sets in primary production declines. The post field description of state of the various classes which was supported with laboratory analysis of fine sand content which is has positive correlation with top soil coarsening (Xiao et al., 2006)
CONCLUSION
This study successfully showed that the use of fine sand content or top soil coarsening using evaluated from remote sensing or satellite data is a convenient, reliable means of studying desertification in space and time. The generalized trend is that there is an increasing rate, extent and intensity of fine sand in the top soil of the study area which signifies desertification.
Efforts towards combating desertification should be focused on specific forms of desertification such as top soil coarsening which has multiple effects on other aspects of soil fertility. Areas
undergoing top soil coarsening were observed in the field to also correlate with badland (paved soil surfaces with very scanty short thorny shrubs. It also leads to reduction in soil organic carbon. GSI is also positively correlated to other soil physical parameters such as bulk density, soil moisture holding capacity and soil organic carbon. Therefore, loss of fine sand content or increasing coarser sand content in the top soil is very detrimental to soil fertility and productivity. Both wind and water erosion are adduced as the probable processes accounting for top soil coarsening. Therefore, the green belt project is seen as one major way of combating top soil coarsening and thus desertification in the study area.
Spatio-Temporal Variations Of Top Soil Coarsening As A Pedo-Geomorphic Indicator Of Land Degradation And Desertification Status In A Part Of
Spatio-Temporal Variations Of Top Soil Coarsening As A Pedo-Geomorphic Indicator Of Land Degradation And Desertification Status In A Part Of
Semi-Arid Zone Of Nigeria
Table 1a: Spatio-temporal patterns of Top Soil Coarsening Sensitivity Areas (Based on GSI and GSSI analysis) in the study area
Source: fieldwork, 2015
Table 1b: Post Field Analysis and Description of Top Soil Coarsening Sensitivity Areas (Based on GSSI)
REFERENCES
Abubakar, S.M. (1996). Rehabilitation of degraded lands by means of fallowing in a semi-arid area of northern Nigeria. Journal of Land Degradation and Development, 7(2): 133-144
Abubakar, S.M., Kudaminya, Y.R., & Eyong, P.N. (2002). Assessment of environmental degradation using satellite remote sensing technologies in Talata Mafara area, northern Nigeria.
Ati, O.F. (2006). Rainfall characteristics in drought prone Sudano-Sahelian zone of Nigeria. Unpublished Ph.D thesis, Department of Geography Ahmadu Bello University, Zaria.
Blench, R. (2010). Conflicts between pastoralists and cultivators in Nigeria. Paper prepared for department for international development (DFID), Nigeria.
Cater, R.C. & Alhassan, A.B. (1998). Groundwater, soils, and development in the Oases of the Manga grasslands, northeast Nigeria In: Hydrology and Changing Environment, Eds; Wheather, H and Kirby, C Proceedings of the British Hydrological Society, Exeter,
Spatio-Temporal Variations Of Top Soil Coarsening As A Pedo-Geomorphic Indicator Of Land Degradation And Desertification Status In A Part Of
Semi-Arid Zone Of Nigeria pp 205-211.
Fricke, W. (1979. Cattle husbandry in Nigeria: a study of its ecological conditions and social-geographical differentiations. Heidelberger GeographischenArbeiten, Heft 52. Heidelberg: GeographischesInstitut der Universität.
Fu, H., Wang, Y., Wu C., & Ta, L. (2002). Effect of grazing on soil physical and chemical properties of Alxa desert grassland. J. Desert Res. 22:339-343.
Fu-Wen, X., & Wen-Yao Z. (2007) Land Deformation Monitoring by GPS in the Yangtze Delta and the Measurements Analysis. Chinese Journal of Geophysics50:10.1002/cjg2.v50.6, 1501-1514. Online publication date: 1-Nov-2007.
Hill, J., Megier, J., & Mehl, W. (1995.a). Land degradation, soil erosion and desertification monitoring in Mediterranean ecosystems. Rem. Sen. Rev. 12(1-2):107-130.
Hillel, D. (1980). Fundamentals of soil physics. Academic Press: New York.
Jenks, G. F. (1967). The data model concept in statistical mapping, International Yearbook of Cartography 7: 186– 190.
Jenks, G. F. (1977). Optimal data classification for choropleth maps, Occasional paper No. 2. Lawrence, Kansas: University of Kansas, Department of Geography Kosmas, C., Kirby, M., & Geeson, N. (1999). The MEDALUS
project: Mediterranean desertification and land use. Manual on Key Indicators of Desertification and Mapping Environmentally Sensitive Areas to Desertification European Commission Project ENV4 CT 95 0119 (EUR 18882).
Kowal, J.N. & Knabe, D. (1972). An agroclimatological atlas of northern states of Nigeria. Ahmadu Bello University Press, Zaria.
Liu, H., Yin, Y., Tian, Y., Ren, J., & Wang, H. (2008). Climatic and anthropogenic controls of topsoil features in the semi-arid East Asian Steppe. Geophysical Research Letters, 5:1-5. Macchiato, M., Carone, M.T., Coppola, R., (--) Summa, V. (2008).
Land degradation study in the Mediterranean areas at different scales: results of two years of activities in the framework of MILMAR MEDIA project. Paper presented at the 5th international conference on land degradation in Valenzano, Bari, Italy, 18-22 september, 2008.
Millennium Ecosystem Assessment (MEA) (2005). Ecosystems and Human Well-being: Desertification Synthesis. World Resources Institute, Washington D.C.
Mortimore, M. (1989). Adapting to drought: farmers, famines, and desertification in West Africa. Cambridge University Press, New york, USA.
Ndabula, C., Averik P. D., JidaunaG.G., Abaje I., Oyatayo T. K., & Iguisi, E. O. (2013) . Analysis of the Spatio-Temporal Dynamics of Landuse/ LandcoverStuctures in the Kaduna Innercore City Region, Nigeria, American Journal of Environmental Protection, 2013, Vol. 1, No. 4, 112-119. http://pubs.sciepub.com/env/1/4/7
Ndabula, C. (2015). Spatio-temporal patterns of biophysical indicators of desertification status in the Borno-Yobe area of Nigeria. Unpublished Ph.D thesis in the department of geography, Ahmadu Bello University, Zaria.
Noy-Meir, I. 1979/80, Structure and function of desert ecosystems, Israel Journal of Botany, 28:1-19.
Oladipo, E.O. (1994). Some aspects of the spatial characteristics of drought in northern Nigeria. Natural Hazards, 8: 171-188.
Rayar, A.J. (1987). Studies on some physico-chemical parameters of soils of Borno state. Annals of University of Maiduguri, 4: 283-291.
Shrestha, D.P., Margate, D.E., Meers, F., & Anh, V.H. (2005). Analysis and classification of hyperspectral data for mapping land degradation. An application in southern Spain. International Journal of Applied Earth Observation and Geoinformation. 7 (2): 85-86.
Su, Y.Z., Zhao, H.L., Zhang, T.H., & Zhao, X.Y. (2004). Soil properties following cultivation and non-grazing of a semi-arid sandy grassland in northern china. Soil Tillage Resources, 75: 27-36.
Symeonakis, E & Drake, N. (2004). Monitoring desertification and Land Degradation over Sub-saharan Africa. International Journal of Remote Sensing. Print/ISSN 1366-5901 Online 2004 Tailor and Francis Ltd http://www.tandf.co.uk/journals
USAID [United State Agency for International Development] (1999). Environmental and natural resources management: a report to congress. US government printing office, Washinton, DC.
Wang, Y. (2010). Typical agricultural areas of China _Dezhou city’s structure changes based on past Decade data. Journal of Geography and Geology, 2(1): 93-97 Wang, H. (2008). Climatic and anthropogenic controls of top soil
features in the semip-arid east Asian steppe. Geophysical Resource Letter, 35, LO4401, doi 10. 1029/2007GL032980.
Wang, X.D., Fu, B,J., Zhao, W.W., Hu, W.F., & Wang, Y.F. (2008). Multi fractal characteristics of soil particle size distribution under different landuse types on the loess plateau, China. Catena, 72: 29-76.
Wang, X.D., Li, M.H., Liu, S,Z., & Liu, G.C. (2006). Fractal characteristics of soils under different landuse patterns in the arid and semi-arid regions of the Tibetan Plateau, China. Geomatics, 134: 56-61.
Ward, A. (1979). Progress for a small planet. W.W Norton, New York.
Xiao, J. Y., Shen, YJ., & Tateishi R. (2005). Development of topsoil grain size index for monitoring desertification in arid land using remote sensing, International Journal of Remote Sensing.
Xiao, J., Shen, Y., Tateishi, R., & Bayaer, W. (2006). Development of top soil grain size index for monitoring desertification in arid land using remote sensing. International Journal of Remote Sensing, 27(12): 2411-2422,