ISSN 2347-4289
Impacts Of Future Loads On Power Distribution
System And Processing Using Distributer
Genera-tors
Abdulfatah Badran, Dr. Salaheldeen Kamal, Dr. Abdrabbou El-Sinaary
PG Student, Dept. of Electrical Power Eng., Azharuniversity, Cairo, Egypt
Assistance professor, Dept. of Electrical Power Eng., Azharuniversity, Cairo, Egypt Professor, Dept. of Electrical Power Eng., Azharuniversity, Cairo, Egypt
Email: [email protected]
ABSTRACT: This paper discusses the impacts of future loads behavior and its types on power distribution system. It is seen that increases the power losses, voltage drop and transformers loading ratio. The neglect of these increases in loads can lead to several problems. So it is necessary toface and solve these problems by pre-expectationfor the amount of these future increases in electrical loads . This paper has provided various types of electrical loads behavior in the future through the timeline for those loads , also provided a real example as a part of the electric distribution network in Egypt.Future loads estimation & its impacts on power system distribution study has been performed.This paper provides a solution to this problem by using distributer generators Technique.
Keywords: distributer generators (DG), Impacts of Distributed Generation Penetration and future electrical loads impacts.
1
I
NTRODUCTIONDistributer generators Technique can solve several problems in power system distribution such as increasing in power losses and voltage drop , So it can be used to treat problems resulting from the electrical future loads .There are many fac-tors that cause increased future electrical loads , for example there is a new residential expansions such as The cities of the first generation in Egypt (8 cities) from 1977 to 1982: The Sixth of October - Tenth of Ramadan - May 15 - New Damietta - New Borg El Arab new -alsalehih - Sadat - Touristic Villages .The cities of the second generation (9 cities) from 1982 to 2000: New Cairo - Sheikh Zayed - Badr - transit - BeniSuef new, new -almineaa - Noubarya - Sunrise - north of the Gulf of Suez. The cities of the third generation (7 cities) from 2000 to now: the new Assiut - New Thebes - the new Sohag - Aswan new - new Qena -Fayyoum new - new Akhmeem. There are also increases in existing electrical loads on the network due to increased air conditioning loads, electrical heaters , lighting loads and increase the vertical heights of some existing build-ings.This new residential expansions and an increase in the existing electrical loads on the network cause several prob-lems on power system distribution such as increased power losses ,voltage drop &transformer stations loading ratio.To solve this problem, study and analysis of power distribution system for loads during different time periods is cosidered. By Take several readings of the electrical loads of the network and draw a scheme for these readings, Through this scheme, the approximate values for future loads during a limited time segments is obtained by using MATLAB program. After future loads estimation, Perform load flow without distributer genera-tors units and determine voltage at each bus, power factor, power losses, and the loading ratio for each transformer , the impacts of future loads will appear clearly where the increase in power losses , voltage drop and transformer stations load-ing ratio.
2
D
ISTRIBUTED GENERATION DEFINITION,
I
MPORTANCE AND ITS IMPACTS ON POWERD
ISTRIBUTIONS
YSTEM.
Distributer generators (DG) is related with the use of smallgenerating units installed in strategic points of the elec-tricpower system and, mainly, close to load centers. Thetech-nologies applied in DG comprise small gas turbines,micro-turbines, fuel cells, wind and solar energy, etc. DG can be used in an isolated way, supplying the consumer's local de-mand, or in an integrated way, supplying energy to the remain-ing of the electric system. In distribution systems, DG can pro-vide benefits for the consumers as well as for the utilities, es-pecially in sites where the central generation is impracticable or where there are deficiencies in the transmission system. In this context, the utilities obligation of providing access to dis-tribution network to independent producers that want to install DG units confronts with the need of controlling the network and guaranteeing appropriate security and reliability levels. The uncertainties involved in system planning and operation become larger than in the past and certainly new methods need to be developed to analyze and to foresee the behavior of the system.The planning of the electric system with the presence of DG requires the definition of several factors, such as: the best technology to be used, the number and the capac-ity of the units, the best location, the network connection way, etc. The impact of DG in system operating characteris-tics, such as electric power losses, voltage profile and reliabil-ity.The selection of the best places for installation and the size of the DG units in large distribution systems is a complex combinatorial optimization problem.
3
C
ASES
TUDY:
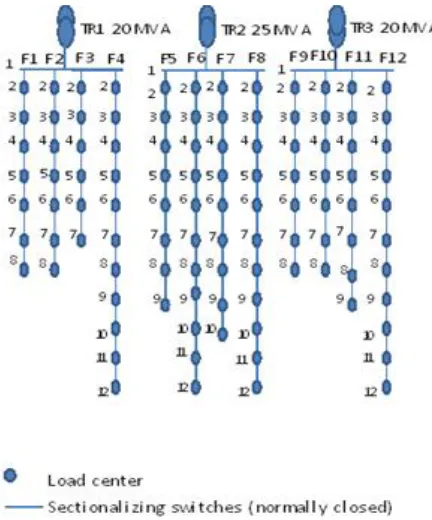
Figure (1) substation 66/11 KV@year 2010.
In this paper, we will study the feeder 1 on transformer 1 load data history from 1995 to 2010, then draw load time chart In order to deduce through it the electrical load behavior in the future .The load data history is shown in the following table 1:
Figure (2) load time chart which indicate the load behavior with time.
3.1FUTURE LOADS BEHAVIOR AND TYPES
In figure 2, it is easily to detect the electrical loads behavior & types, There are increases in existing electrical loads on the network due to increased air conditioning loads, electrical heaters, lighting loads and increases the vertical heights of some existing buildings. Also, it is possible to observe that there is a new residential expansions cause increased future electrical loads as it is clearly shown in the Table(1) where there is anew loads center at 2005 & 2010 years. From the above, it is possible to shorten the types of future loads as follows :
3.1.1VERTICAL FUTURE LOADS
This term can be used to express the increase in loads which existing on the distribution network because of increased HVAC loads , electrical heaters, lighting & water pumps loads, and increases the vertical heights of some existing buildings .
3.1.2HORIZONTAL FUTURE LOADS
This term can be used to express the new loads center caused by the new residential expansions.
Figure (3) Bus 2 load timeline.
3.2FUTURE LOADS ESTIMATION
It is possible to use curve fitting methods by MATLAB program to estimate the future loads from loads data history which clearly isshown in load- time chart as follows: For example we can detect future loads on bus 2 at 2020 year as shown in figure (3), by curve fitting methods using MATLAB program, the load behavior in the future can be obtained as shown in figure (4),
Figure (4) Bus 2 load behavior in the future.
There are many factors that control the electrical load behavior in the future, for example, the amount of population growth and density, which followed a new urban expansion, technological development and well-being available and economic growth . These states can be classified as follows :
3.2.1 LINEAR MODEL:
This state indicates that the rate of increase is nearly constant, this gives an indication of the stability of growth rates , population density and therefore the stability of increase the electrical load ratio .
3.2.2 EXPONINTIALINCREASE:
ISSN 2347-4289
system distribution , this gives an indication of the growth acceleration and population density rates and thus acceleration rates increase the electrical load .
3.2.3 SATURATION STATE :
This case reflects the network access to the state of stability and future increases will be very slight . This is a rare situation exists on a small scale.
The importance of these states study is to use the best way to estimate the future loads by curve fitting as show in the following table:
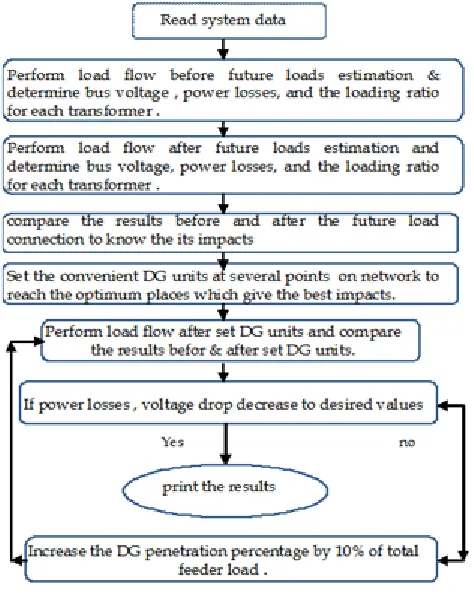
Through these results, note asignificant increase in the ex-pected loads at 2020 year. By the same method, find the fu-ture loads at all load centers. It is seen that the transformer loading ratio reach 94.2 %. To see the impacts of these in-creases on power distribution system and proccess these im-pacts, must perform the following flow chart steps,
Figure (5) Case study flow chart steps
4
F
UTURE LOADS IMPACTS ON POWER DISTRIBUTION SYSTEMTo see the impacts of future loads , must perform load flow befor and after future loads estimation , then compare the results .
4.1 LOAD FLOW BEFOR FUTURE LOADS ESTIMATION:
System data in the following tables (3), (4). By using ETAP program we can get more accurate results for load flowas TA-BLE(5),
4.2 Load flow after future loads estimation:
System data after add the futur load in the following table(6),
TABLE 3 SHOW LOADS DATA AT YEAR 2010
TABLE 4 SHOW LINE NETWORK DATAOF FEEDER 1
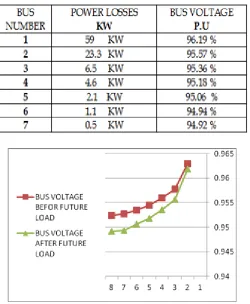
TABLE 5 SHOW POWER LOSSES &VOLTAGE DROP CALCULATIONS OF FEEDER 1 BEFORFUTURE LOADS
ESTIMATION
TABLE 7 SHOW POWER LOSSES &VOLTAGE DROP CALCULATIONS OF FEEDER 1 AFTERFUTURE LOADS
ESTIMATION
Figure (6) PU voltage along feeder 1 befor and after future loads calculation.
5
M
INIMIZATION OF VOLTAGE DROP AND POWER LOSSES BYUSING DISTRIBUTED GENERATORS,
After setting of DG units with 33% penetration level , the results in table (8) can be obtained . (The penetration level is defined as the ratio between the generation produced from DG units to the total loads of feeder).
TABLE 8 SHOW POWER LOSSES AND VOLTAGE DROP CALCULATIONS OF FEEDER 1 AFTER ADD DG UNIT WITH
33% PENETRATION LEVEL .
Figure (7) PU voltage along feeder 1 befor and after DG penetration.
TABLE 9 SHOW POWER LOSSES REDUCTINAFTER DG UNIT PENETRATION
6
E
CONOMIC STUDYBy considering cost of KWH = 0.25 LE (Egyptian pound) Annual saving = saving (KW) * number of hour per year (8760)* cost of KWH
In the case study:
The saving in losses = 38.1 KW
Annual saving = 38.1 KW * 8760 hour * 0.25 LE = 83439 LE Total saving/year for only feeder 1 on TR1 at transformer sta-tion = 83439 LE.
7
C
ONCLUSIONShortly, there are several problems caused by increasing of electrical loads in the future , so it is necessary toface and solve these problems by pre-expectationfor the amount of these future increases in electrical loads .This paper has pro-vided various types of electrical loads behavior in the future through the timeline for those loads , also provided a real ex-ample as a part of the electric distribution network in Egypt.Future loads estimation & its impacts on power system distribution study has been performed,.This paper has also offered to solve all these problems resulting from increasing in the future electrical loads by using distributed generators.In the end ,it is possible thatovercome the power losses increase and voltage drop problems by using small DG units . On the economic side, this study save a large amount of the annual economic cost resulting from power losses .
A
CKNOWLEDGMENTSISSN 2347-4289
VI.
R
EFERENCES[1] R. E. Brown and L. A. Freeman, “Analyzing the Relia-bility Impact ofDistributed Generation”, Proceedings of the IEEE Summer Meeting, pp.1013-1018, July 2001.
[2] P. P. Baker, “Determining the Impact of Distributed Generation on Power Systems: Part 1 - Radial Distri-bution Systems”, Proceedings of IEEE PES Summer Meeting, Vol. 3, pp. 1645 -1656 Seattle, 2000.
[3] F. L. Alvarado, “Locational Aspects of Distributed Generation”, Proceedings of IEEE PES Winter Meet-ing, Volume 1, pp. 140, Ohio, 2001.
[4] G.X. Luo and A. Semlyen, "Efficient Load Flow for Large Weakly Meshed Networks", IEEE Trans on Power Systems, Vol. 5, No. 4, November 1990.
[5] D. Shirmohammadi, H.W. Hong, A. Semlyen and G.X. Luo, "A Compensation-Based Power Flow Method for Weakly Meshed Distribution and Transmission Net-works", IEEE Trans on Power Systems, Vol.3, No.2, May 1988.
[6] R. Billinton and R. Allan, “Reliability Evaluation of En-gineering Systems: Concepts and Techniques”, Ple-num Press – New York, Second Edition, 1992.
[7] PSS/E 25, On-line Documentation, Schenectady, US: Power Technologies,Inc., December 1997.
[8] J. G. Slootweg, W. L. Kling, “Impacts of Distributed Generation on PowerSystem Transient Stability”, in Proc 2002 IEEE Power EngineeringSociety Summer meeting.
[9] Donnelly, M.K., Dagle, J.E., Trudnowski, D.J., Rog-ers, G.J., “Impact ofthe Distributed Utility on Trans-mission System Stability”, IEEE Transactions of Pow-er Systems, Vol. 11, No. 2, pp. 741-746, 1996.