DOI:10.21276/ijprhs.2017.04.16
B Dasetal CODEN (USA)-IJPRUR, e-ISSN: 2348-6465
Original Article
Development of a New Rapid, Efficient and
Reproducible Reverse Phase - HPLC Method for the
Analysis of Decitabine in Bulk and Tablet Dosage
Form
Byasabhusan Das
1,*, Niranjan Panda
2, Kanhu Charan Panda
2, 31
Department of Pharmaceutical Analysis & QA, Anwarul Uloom College of Pharmacy, Hyderabad, India
2
Department of Pharmaceutics, Anwarul Uloom College of Pharmacy, Hyderabad, India
3
Research Scholar, Department of Pharmaceutical Sciences, JNTUA, Anantapur, India
A R T I C L E I N F O A B S T R A C T
________
1. INTRODUCTION
Decitabine is an Inhibitor of Nucleic Acid Synthesis. Decitabine is a cytidine antimetabolite analogue with having potential antineoplastic activity. It incorporated into DNA and inhibits the DNA methyltransferase enzyme, resulting in the hypomethylation of DNA and intra-S-phase arrest of
International Journal of Pharma Research and Health Sciences
Available online at
www.pharmahealthsciences.net
Received: 21 Aug 2017 Accepted: 28 Aug 2017
Development of a new rapid, efficient and reproducible reverse phase-HPLC method for the analysis of Decitabine in bulk drug and tablet dosage form. This separation was achieved by using Develosil ODS HG-5 RP column 150mm x 4.6mm, 5µm (particle size) i.d. in isocratic mode, with mobile phase containing ACN : Acetate buffer (55:45), adjusted to pH 3.9 using ortho phosphoric acid. The flow rate was maintained at 1.0 ml/min and analyte were monitored at 254 nm. The retention time of Decitabine was found to be 2.97 min. The linearity for Decitabine were in the range of 0-60 µg/ml. The recoveries of Decitabine were found in the range of 100.4933%, 101.4733% and 100.0467%. The developed method was validated as per ICH guidelines and successfully applied to the further analysis of Decitabine in bulk and tablet dosage form
Keywords:Decitabine, RP-HPLC, ICH Guidelines.
Corresponding author *
Byasabhusan Das Assistant professor
Anwarul Uloom College of Pharmacy, New mallepally,
replication of DNA. Chemically Decitabine is a 4-amino-1-[(2R,4S,5R)-4-hydroxy-5-(hydroxyl methyl) oxolan-2-yl]-1,2-dihydro-1,3,5-triazin-2-one. Decitabine is physically Fine white crystalline powder. 1
Decitabine is a hypomethylating agent. It hypomethylates DNA by inhibiting the DNA methyltransferase enzyme. Decitabine functions are same kind of azacitidine, although decitabine can only be incorporated into DNA strands while azacitidine can be entered into both DNA and RNA chains. The structure of Decitabine as shown in figure-1.
Fig 1: Chemical structure of Decitabine
The literature survey reveals that the few HPLC methods are developed and validated for the estimation of Decitabine. The reported methods are available for the estimation of Decitabine individually are new validated high performance liquid chromatographic method, and the spectrophotometric method, UV-HPLC, derivative spectrophotometric method, RP-HPLC, and liquid chromatography.
Decitabine has been determined in pharmaceutical preparations by stability-indicating high performance liquid chromatography method, estimation of Decitabine with the other drugs. Since there is no reported method on analysis of Decitabine in bulk and tablet dosage forms. The aim and objective of this study was to develop and validate the assay method of Decitabine in bulk and tablet dosage form.2
2. MATERIALS AND METHODS
Materials
All standard purified materials were used for this study. The solvents which are used in the preparation of various solutions should be HPLC grade and obtained from Merck Specialties Pvt. Ltd. Mumbai. Active pharmaceutical ingredients Decitabine were supplied by Spectrum Pharma Research Solutions, Hyd.3The formulation was purchased in a local market. Instrumentation The High performance liquid chromatography system consists of A suitable HPLC having a isocretic system equipped with auto rheodyne injector and UV detector.
Chromatographic conditions
The chromatographic analysis was performed on Develosil ODS HG-5 RP 150mm x 4.6mm 5µ m particle size.4 The column temperature was maintained at 30°c.The mobile phase consisting of acetonitrile : Acetate buffer (pH=3.9) = 55:45 with a flow rate of 1.0 ml/min. The detection
wavelength was set at 254 nm and had given acceptable retention time and good resolution in Decitabine. The run time was taken as 10 min.
Standard solution preparation
Weigh accurately and transferred exactly 25mg of Decitabine working standards into a 10 ml clean and dry volumetric flask and add 6 ml of mobile phase (diluent), then sonicated for 10 minutes and make up to the mark with Mobile phase (diluent).51 ml from the above stock solution was taken into a 10 ml clean and dry volumetric flask and made up to 10 ml with Mobile phase (diluents). The standard solution preparation consists of 100μg/ml (or) 100ppm of
Decitabine.
Sample preparation
Accurately weigh 25 tablets of Decitabine and calculate the average weight of each tablet than calculate the equivalent weight to 25 tablets was transferred into a 100 ml volumetric flask, 70 ml of diluent added and sonicated for 25 minutes, further the volume made up to the mark with Mobile phase (diluents) filtered. From the filtered solution 0.2 ml was pipette out into a 10 ml of clean and dry volumetric flask and made up to 10 ml with Mobile phase (diluents).
Preparation of buffer: 0.01M (CH3COONa)
Weigh accurately 0.82034 gm of sodium acetate in a 1000 ml of volumetric flask add about 900 ml of milli-Q water added and degas to sonicate and finally make up the volume with water and adjust the pH upto 3.9 with dil. Ortho Phosphoric Acid (OPA).
Method validation6, 7, 8
The optimized chromatographic method was validated according to the ICH guidelines 15,16 for the validation of parameters like linearity, accuracy ,precision, and repeatability, limit of detection (LOD), limit of quantification (LOQ) and robustness.
System suitability parameters
System suitability parameters are validated by injecting five
times of 100μg/ml concentrations of standard solution of
Decitabine in to the HPLC system. 9The parameters like symmetry, resolution factor, theoretical plates and tailing factor were calculated.
Linearity
The range of linearity was evaluated by injecting the standard solution of Decitabine in five different replicates into the system. The linearity concentrations of Decitabine were prepared in the ranges of 25-150 μg/ml and 50-300
μg/ml.10Plot a linear graph by taking the peak area versus
concentration (on Y-axis and X-axis). The linear regression coefficient, correlation coefficient was calculated. The correlation coefficient (r2) value should be 0.999.
Precision Repeatability
and their corresponding values for mean, standard deviation and %RSD are calculated. Reproducibility
Accuracy
The accuracy was validated by using a minimum of three different concentrations of standards, Decitabine, 75%, 100% and 125%.12The percentage recoveries are analyzed from the obtained amount of Decitabine in pharmaceutical dosage forms.
Method robustness13,14
The robustness can be determined by varying the following parameters
1) Flow rate: It can be determined by altering the flow rate
from 1 ml/min to 1.2 ml/min. The standard solution of Decitabine was prepared and was injected by changing the flow rate along with the optimized method.
2) Column temperature: It can be determined by varying
the column temperature ±5%. The standard solution of Decitabine was prepared and injected by changing mobile phase composition along with the optimized method.
3) Wavelength: It can be determined by changing the
wavelength. The standard solution of Decitabine was prepared and was injected by changing a wavelength along with the optimized method.
LOD and LOQ17
Limit of detection (LOD) and limit of quantification (LOQ) of Decitabine was calculated from the standard grpah method. The linearity solutions of Decitabine were prepared and injected. LOD and LOQ were calculated by using following equations.
LOD= (3.3σ/S), LOQ= (10σ/S)
Where σ = standard deviation of the response; S =slope of
the calibration curve of the analyze.
3. RESULTS AND DISCUSSION
Method development and optimization
A simple Reverse Phase-HPLC method for the analysis of Decitabine in pharmaceutical dosage form. In method development the solubility of the active pharmaceutical ingredient was checked in different solvents like methanol and water. The Decitabine is slightly soluble in ethanol/water (50/50), methanol/water and soluble in DMSO at 90 mg/ml; soluble in ethanol at 2 mg/ml with warming. Finally the standards are diluted by Acetonitrile: Acetate buffer (pH=3.9) in the ratio of 55:45.18, 19
The different mobile phases like acetonitrile and acetate buffer were used in various compositions with a flow rate of 1 ml/min but the peak resolution; retention time and tailing factor were not satisfactory. Finally by changing the composition ratio (55:45) of the mobile phase was selected at a flow rate of 1 ml/min.
The chromatographic analysis was tested by using different columns like Develosil ODS HG-5 Reverse Phase 150mm x 4.6mm 5µ m particle size columns maintained at different temperatures like 27,30 were used, but the retention time, peak resolution and tailing were not in the desired limits.
The actual chromatographic analysis were achieved on Develosil ODS HG-5 RP 150mm x 4.6mm 5µ m particle size by using mobile phase composition of Acetate buffer and acetonitrile in the ratio of (45:55).20
Table 1: System suitability parameters of standard solution Parameter Acceptance Criteria Result Theoretical plates >4000 5842
Tailing Factor <2.0 0.93
% of RSD for Area <2.0 0.07
% of RSD for RT <1.0 0.58
SD = Standard deviation; RSD = Relative Standard deviation; Rt = Retention Time
System suitability parameters
The system suitability tests were conducted before performing the validation and the parameters were within the acceptance criteria like retention times of Decitabine were found to be 2.97 minutes. The theoretical plate count was >4000, peak tailing was <2.0 and the % RSD of peak areas of standard were ≤ 2.0 (Table-1), (fig.2). 21 Hence the proposed method was successfully applied to routine analysis without any problems.
1.72 2.11
2.97
0 1 2 3 4 5 6 7 8 9 10
Retention Time (min) 0
20 40 60 80 100
Intensity
(
mV
)
Fig 2: HPLC chromatograph of standard solution (i. e. Decitabine)
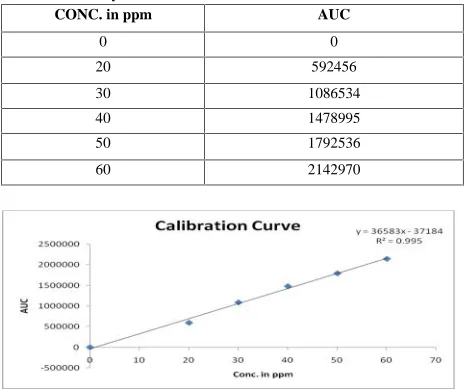
Linearity
The linearity of Decitabine was prepared in the range of 0-60
μg/ml. These were represented by linear regression equation
y (Decitabine) =36583. x+37184 (r2=0.995). From the calibration curve the regression line for the drug was linear. (Table 2), (fig. 4).
Table 2: Linearity of Decitabine
CONC. in ppm AUC
0 0
20 592456
30 1086534
40 1478995
50 1792536
60 2142970
Precision
Injected standard preparation five times in same concentration in to the system. The precision of developed analytical method expresses closeness of agreement between a series of measurements obtained from the multiple sampling of the homogenous under the prescribed conditions. Repeatability and intermediate precision for Decitabine were shown in table 3 and 4.22This indicated the method was highly precise.
Table 3: Determination of repeatability for Decitabine
HPLC Injection Replicates of Decitabine
Retention Time Area
Replicate–1 2.97 1449563
Replicate–2 2.97 1448520
Replicate–3 2.97 1445163
Replicate–4 2.97 1445896
Replicate–5 2.97 1448576
Average 2.97 1447544
Standard Deviation 0.0 1902.566
% RSD 0.0 0.131434
Table 4: Determination of Intermediate precision for Decitabine
Conc. Of Decitabine (API) (µg/ml)
Observed Conc. Of Decitabine (µg/ml) by the proposed method
Intra-Day Inter-Day
Mean (n=6) % RSD Mean (n=6) % RSD
20 20.25 1.06 19.45 0.84
40 39.41 0.94 40.95 0.94
60 60.36 0.05 60.12 0.35
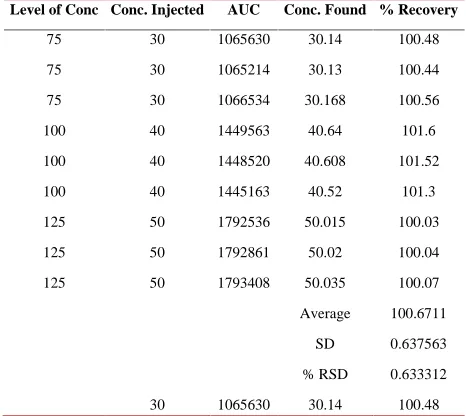
Accuracy [23]
The percentage recoveries for Decitabine were found to be 98-102% and the % RSD for Decitabine were found to be 0.633312. The results of recovery studies were shown in table 5.
Table 5: Accuracy for standard solution
Level of Conc Conc. Injected AUC Conc. Found % Recovery
75 30 1065630 30.14 100.48
75 30 1065214 30.13 100.44
75 30 1066534 30.168 100.56
100 40 1449563 40.64 101.6
100 40 1448520 40.608 101.52
100 40 1445163 40.52 101.3
125 50 1792536 50.015 100.03
125 50 1792861 50.02 100.04
125 50 1793408 50.035 100.07
Average 100.6711
SD 0.637563
% RSD 0.633312
30 1065630 30.14 100.48
Robustness
Robustness data for Decitabine by changing the parameters like flow rate, temperature and wavelength. It was shown in table 6.
Table 6: Robustness: Flow rate
Change in parameter % RSD
Flow (1.1 ml/min) 0.97
Flow (0.9 ml/min) 0.91
Temperature (270
C) 0.93
Temperature (230
C) 0.97
Wavelength of Detection (255 nm) 0.59 Wavelength of detection (253 nm) 0.57
Limit of detection (LOD) and limit of quantification (LOQ)
The LOD and LOQ values were calculated by using the slope and y-intercept obtained from the standard graph. The LOD and LOQ values for Decitabine were found to be 0.73
μg/ml and 2.19μg/ml (Table 6).
4. CONCLUSION
The proposed analytical technique of RP-HPLC is simple, accurate and precise method for the estimation of Decitabine in bulk and pharmaceutical dosage form was developed. The developed method was validated as per ICH guidelines. Statistical analysis proves that the method is repeatable, sensitive for the analysis of Decitabine in pharmaceutical dosage form.
5. ACKNOWLEDGEMENT
The authors express their attitude to Spectrum Pharma research solutions, Hyderabad. For providing best samples of pure Decitabine.
6. REFERENCES
1. Patil KR, Rane VP, Sangshetti JN, Shinde DB. A stability-indicating LC method for the simultaneous determination of telmisartan and ramipril in dosage form. Chromatographia. 2008 Apr 1;67(7-8):575. 2. Baht and Leena:J of Liq. Chrom., 30, 309, (2007) 3. H.H.Williard, L.L.Merit, F.A.Dean and F.A.Settle,
Instrumental methods of pharmaceutical analysis, 7th edition, C.B.S.Publishers, New Delhi,( 2002).
4. GN Menon, LB White, Department of Analytical Research,Abbott Laboratories, (PubMed-index for MEDLINE).
5. Deshpande Arinash et al., Annual meeting and exposition,( Oct, 2006).
6. Wankhede SB, Tajne MR, Gupta KR, Wadodkar SG. RP-HPLC method for simultaneous estimation of telmisartan and hydrochlorothiazide in tablet dosage form. Indian journal of pharmaceutical sciences. 2007;69(2):298.
7. N. Torrealday: J of Pharmaceutical and biomed. Ana., 32, 847, (2003).
8. Method Validation of analytical procedures, ICH harmonized tripartite guideline, 108, 1996.
9. Labrid C. Roman Journal of International Medicines, 36, 137-144,(Jul-Dec 1998).
dosage forms. The Indian Pharmacist. 2005;4(36):69-72..
11. McClellan KJ & Plosker GI, Drugs; 58,143-157, (Jul 1999)
12. The complete Drug reference; Martindale,
Pharmaceutical press 32 edition;12thpage.
13. Matheson A.J., Noble S., Drugs, Volume 59, Number 4, April 2000, pp. 829-835(7).
14. Kasawar GB, Farooqui M. Development and validation of a stability indicating RP-HPLC method for the simultaneous determination of related substances of albuterol sulfate and ipratropium bromide in nasal solution. J Pharmaceut Biomed Anal 2010; 52:19–29
15. Sethi P.D., “High performance liquid chromatography:
Quantitative analysis of pharmaceutical formulation”,
2001; 1stEdn.; 5–11, 141.
16. Fronk A.S.,”Handbook of Instrumental Techniques for
Analytical Chemistry”, 1st Edn., Pearson Education,
2004 ;
17. Skoog D.A., Holler F.J., Nieman D.A.,” Principle of
Instrumental Analysis”, 6th ed Reprint, Thomson
Brooks/Cole publication, 2004 ; 300-351.(UV)
18. Sharma Y.R., “Elementary Organic Spectroscopy,
Principle & Chemical Applications”, S. Chand &
Company Ltd., New Delhi, 2005; 8.
19. Kalsi P.S., “Spectroscopy of Organic Compounds”, 5th
ed, New Age International Publishers New Delhi, 2002; 7.
20. Jens T. Carstensen, Rhodes C. T., “Drug stability
principle and practices”, 3rdEdn., Marcel Dekker Inc.;
331,338-339.
21. J. M. Green, A practical guide to analytical method validation, Anal. Chem. News & Features, 1 May 1996; 305A–309A.
22. P. A. Winslow and R. F. Meyer, Defining a master plan for the validation of analytical methods, J. Validation Technology 1997; 361–367.
Conflict of Interest: None