Research Article
CODEN: IJPNL6
DEVELOPMENT AND VALIDATION OF RP-HPLC METHOD FOR SIMULTANEOUS
ESTIMATION OF ATENOLOL AND AMLODIPINE IN BULK AND TABLET DOSAGE
FORM
Akki Srivani
1*, Sujitha Hazari
1and Swathi Malichetti
21
Department of Pharmaceutical Analysis and Quality Assurance, CMR College of Pharmacy,
kandlakoya (v), Medchal road, Hyderabad – 501 401, A.P, India
2
Department of Pharmaceutics, CMR College of Pharmacy, kandlakoya (v), Medchal road,
Hyderabad – 501 401, A.P, India
*Corresponding author e-mail: [email protected]
ABSTRACT
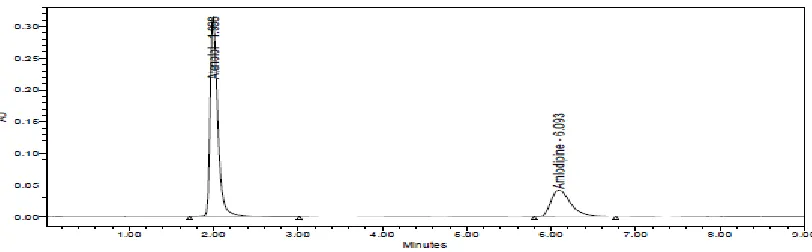
A new precise, accurate, reliable validated method for the determination of Atenolol and Amlodipine has been developed by using reverse phase high performance liquid chromatography (RP-HPLC) in pharmaceutical dosage form. Chromatographic separation was carried out by using mobile phase 0.02M Potassium dehydrogenate phosphate: acetonitrile (62:38v/v, PH-3.56 adjusted with Orthophosphoric acid) on Hypersil, BDS 150 x 4.6 mm, 5 at a flow rate 0.8ml/min with UV detection at 238nm.The retention times for Atenolol and Amlodipine were 1.998 and 6.093 min respectively and both drugs showed good linearity in the range of 250-750 µg/ml and 25-75 µg/ml. The proposed method has been successfully applied to pharmaceutical formulation and was validated according to ICH guidelines and method showed good precision with percentage relative standard deviation less than 2%. The percentage recovery for Atenolol and Amlodipine was found between 99.06-100.94% and 99.12-100.95% respectively indicating the proposed method was accurate and precise.
Key words: Atenolol (ATN), Amlodipine (AMLD), RP-HPLC, Simultaneous estimation.
INTRODUCTION
Atenolol (ATN) is chemically 2-[4-[(2 RS )-2-hydroxy-3-(1methylethyl) amino]. It is used in the treatment of Hypertension. Atenolol is a selective and competitive inhibitor of bête-1 adrenergic receptor in the heart and vascular smooth muscle, inhibiting sympathetic stimulation. Amlodipine is chemically 3-Ethyl-5-methyl (±)-2-[(2-aminoethoxy) methyl] - 4-(2-chlorophenyl)-1, 4-dihydro-6-methyl-3, 5- Pyridine dicarboxylate. Amlodipine is a long-acting dihydropyridine calcium channel blocker used as an anti-hypertensive and in the treatment of angina. Like other calcium channel blockers, Amlodipine acts by relaxing the smooth muscle in the arterial wall, decreasing total peripheral resistance and hence reducing blood pressure; in angina it increases blood flow to the heart muscle. Amlodipine affects the amount of calcium found in
your heart and muscle cells. These results in relaxation of blood vessels, which can reduce the amount of work the heart has to do.
Literature survey revealed few analytical techniques are available for estimation of Atenolol alone as well as in combine dosage form such as UV ,HPLC, HPTLC.[3-7] Similarly few analytical methods are available for estimation of Amlodipine alone and its combination with drugs such as UV and HPLC.[8-17] keeping this objective in mind an attempt has been made to develop and validate the RP-HPLC method for the simultaneous estimation of ATN and AMLD which would be highly sensitive having good resolution reproducible and cost effective. Various validation aspects of the analysis accuracy, precision, recovery, the limits of detection and quantification etc have been measured as per ICH guidelines. [18]
International Journal of Pharmacy
MATERIALS AND METHOD
Equipment: Chromatographic separation was
performed on HPLC system - Water’s alliance 2695 with 2996 module Photo Diode Array (PDA) detector equipped with a solvent delivery pump, automatic sample injector and column thermostats. Waters Empower2 software was applied for data collecting and processing.
Chemicals and reagents: Methanol, Acetonitrile
(HPLC grade) was used. Buffer used wasPotassium dehydrogenate orthophosphate. Reference standards Atenolol and Amlodipine were obtained from SPECTRUM PHARMA. AMLONG Tablets of ATN (50mg) and AMLD (5mg) manufactured by sun pharmaceuticals Ltd were procured from local market.
Preparation of standard solutions:
Standard Preparation: Accurately Weighed and transferred 50mg of Atenolol and 5mg of Amlodipine working Standards into a 10 ml clean dry volumetric flask, add 7ml of diluent , sonicated for 5 minutes and make up to the final volume with diluents. From that 1ml was pipette out into 10ml volumetric flask and made up to 10ml with diluents.
Preparation of sample solution:
Sample Preparation: 5 tablets were weighed and calculate the average weight of each tablet then the weight equivalent to 5 tablets was transferred into a 100 mL volumetric flask, 60mL of diluent added and sonicated for 25 min, further the volume made up with diluent and filtered. From the filtered solution 2ml was pipette out into a 10 ml volumetric flask and made up to 10ml with diluent.
Preparation of buffer:
Buffer: (0.02M KH2PO4)
Accurately weighed 2.72gm of Potassium dihyrogen ortho phosphate in a 1000ml of volumetric flask add about 900ml of mille-Q water added and degas to sonicate add 0.5ml of Triethylamine and finally make up the volume with water then PH adjusted to 3.56 with dil. Orthophosphoric acid solution.
Optimized chromatographic conditions:
Chromatographic conditions:
Flow rate : 0.8ml/min
Column : Hypersil, BDS 150 x 4.6 mm, 5.
Detector wave length : 238nm Column temperature : 30°C Injection volume : 10L
Diluent : water:
Methanol (50:50)
PH : 3.56
METHOD VALIDATION
System suitability test: This parameter was evaluated before each stage of validation. Six replication injections of standard preparation were injected. Asymmetry, number of theoretical plates and relative standard deviation of peak area were determined.
Linearity: Solutions were prepared containing
250µg/ml, 375µg/ml, 500µg/ml, 625µg/ml, 750µg/ml, concentrations of Atenolol and 25µg/ml, 37.5µg/ml, 50µg/ml, 62.5µg/ml, 75µg/ml, concentrations of Atenolol which corresponding to 50, 75, 100, 125 and 150% respectively of the test solution concentration. Each solution was injected, linearity was evaluated by linear- regression analysis.
Accuracy: Accuracy was determined by the recovery
studies at three different concentrations (corresponding to 50, 100 and 150% of the test solution concentration) by addition of known amounts of standard to pre-analyzed sample preparation. For each concentration, three sets were prepared and injected.
Precision: Intraday and inter day variations were determined by using six replicate injections of one concentration and analyzed on the same day and different days. Precision of an analytical method is usually expressed as the standard deviation or relative standard deviation (coefficient of variation) of a series of measurements.
Robustness: The robustness was evaluated by
assaying test solutions after slight but deliberate changes in the analytical conditions. The factors chosen for this study were the flow rate (±0.1ml/min), mobile phase composition (buffer: methanol by 5%), temperature (±5ºc).
Limit of detection (LOD) and Limit of
quantification (LOQ): LOD and LOQ was calculated
from linear curve using formulae
LOD= 3.3 * σ / slope, LOQ= 10 * σ / slope
(Where σ = the standard deviation of the response and S = Slope of calibration curve).
Specificity: Specificity was checked for the
demonstrate separation of both ATN and AMLD from impurities.
RESULTS AND DISCUSSIONS
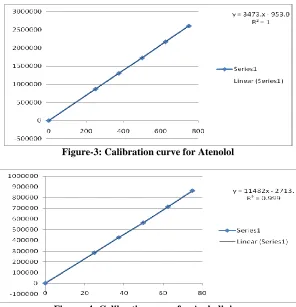
Several mobile phase compositions were tried to resolve the peak of ATN and AMLD. The mobile phase containing buffer: Acetonitrile in proportion of 62:38v/v was found ideal to resolve the peak of ATN and AMLD satisfactory. Retention time of ATN and AMLD were 1.998and 6.093min respectively (Figure 1&2). Result of assay is shown in Table-1. The proposed method was found to be linear in concentration range 250-750µg/ml for ATN and 25-75µg/ml for AMLD. The data was shown in Table-2 and Figure-3&4 system suitability parameters were evaluated and results shown in (Table-3), which were within acceptance criteria. The mean percentage recovery for ATN and AMLD was found to be between 99.06-100.94% and 99.12-100.95% respectively, which are well within the limit and hence the method was found to be accurate (Table-4). LOD and LOQ values were 0.905μg/ml and 2.744μg/ml for Atenolol and 0.779μg/ml and 2.362μg/ml for Amlodipine (Table-5). Results of
intraday and inter day precision were shown in the Table (6a&6b). The robustness of the method was investigated by varying experimental conditions such as changes in flow rate, mobile phase composition and temperature. The result obtained implies method is robust for routine qualitative analysis (Table7).
CONCLUSION
The proposed RP-HPLC method was validated as per International conference on harmonization (ICH) guidelines, and found to be applicable for routine quality control analysis for the simultaneous estimation of ATN and AMLD using isocratic mode of elution. The results of linearity, precision, accuracy and specificity, proved to be within the limits. The method provides selective quantification of ATN and AMLD without any interference. The proposed method is highly sensitive, reproducible, reliable, rapid and specific.
ACKNOWLEDGEMENT:
The authors are thankful to Spectrum Pharma Research Solutions, Hyderabad.
Figure-1: Chromatogram of ATN (500µg/ml) and AMLD (50µg/ml) standard
Figure-3: Calibration curve for Atenolol
Figure -4: Calibration curve for Amlodipine
Table -1 Analysis data of tablet formulation (AMLONG)
TABLET Label claim(mg) Assay ± SD (% label claim) %RSD
ATN 50 99.30±0.24 0.24
AMLD 5 99.39±0.19 0.19
RSD – relative standard deviation; SD – standard deviation
Table – 2: Result of Linearity
S. no Atenolol Amlodipine
Conc. (µg/ml) Peak area Conc. (µg/ml) Peak area
1 250 869404 25 284048
2 375 1303097 37.5 427794
3 500 1726230 50 564984
4 625 2171926 62.5 712811
5 750 2607986 75 864594
Table-3: System suitability studies
Parameters Atenolol Amlodipine Acceptance criteria
Theoretical plates 2687 3492 More than 2000
Tailing factor 1.45 1.49 Less than 2
Table-4: Recovery studies for Atenolol and Amlodipine DRUG Spiked level% Amount taken
(µg/ml)
Amount found (µg/ml)
Percent recovery n=3
% RSD
ATN 50 250 245.6 99.72 0.24
100 500 499.9 99.05 0.17
150 750 748.9 99.58 0.24
AMLD 50 25 24.7 100.01 0.47
100 50 49.1 99.90 0.29
150 75 76.2 99.71 0.19
n- Number of replicate injections
Table-5: LOD and LOQ for Atenolol and Amlodipine
DRUG LOD (µg/ml) LOQ (µg/ml)
Atenolol 0.905 2.744
Amlodipine 0.779 2.362
Table-6a: Results of intraday Precision
DRUG Conc. (µg/ml) Peak area (n=6) % RSD
ATN 500 2025634 0.8
AMLD 50 702153 0.51
Table-6b: Results of inter day Precision
DRUG Conc. (µg/ml) Peak area (n=6) % RSD
ATN 500 1961860 0.7
AMLD 50 677668 0.5
Table-7: Results of Robustness study
S. no Parameter Condition Mean Peak area (n=2) % change
ATN AMLD ATN AMLD
1. Flow rate 0.9 ml/min 1742937 593094 0.5 0.4
0.7 ml/min 1938326 668243 0.4 0.1
2. Mobile phase 60:40 v/v 1926623 593265 0.2 0.1
50:50 v/v 1943423 694373 0.4 0.2
3. Temperature 35ºc 1939975 682410 0.8 1.7
25ºc 1931161 667407 0.8 0.1
REFERENCES
1. Samya M El-Gizawy1, Osama H. Abdelmageed2, Mahmoud A. Omar. Ame J Anal Chem, 2012; 3(1): 422-430.
2. Richa Sah, Saahil Arora. J Adv Pharm Edu & Res, 2012; 2(3): 93-100.
3. Dr.M.B.Patel, Nimesh Prajapati, Rashmika Prajapati. (IJPRD), 2011; 3(2):0974-4304. 4. S. D. Kayal1, F.A.Khanet. Int J Pharm Res Dev, 2011; 144-153.
5. M. V. Kumudhavalli. Der Pharma Chemica, 2011, 3(4): 63-68.
6. J. Kavitha1, S. Muralidharan. Int.J. Chem. Tech Res, 2010; 2(2): 801-808.
7. D Sridharan, A Thenmozhi, S Sundaranandavalli. Asian J of Pharm Clinical Res, 2010; 3(2): 0974‐2441.
8. Ahsanul Haque, Asma Naznin1, A.N.M Hamidul Kabir. J. Pharm. Sci, 2010; 9(2): 131-138. 9. D.N.Vora, A.A.Kadav. Indian J Pharm Sci, 2008; 70(4): 542–546.
10. http://en.wikipedia.org/wiki/Combination_drug 11. http://www.drugbank.ca/drugs/DB01098