http://www.sciencepublishinggroup.com/j/sjac doi: 10.11648/j.sjac.20190702.12
ISSN: 2376-8045 (Print); ISSN: 2376-8053 (Online)
Removal of Malachite Green Dye from Aqueous Solution by
Adsorption Using Modified and Unmodified Local
Agriculture Waste
Mohammed Saleh Bashanaini, Mohammed Hadi Al-Douh
*, Hanan Saeed Al-Ameri
Chemistry Department, Faculty of Science, Hadhramout University, Mukalla, Hadhramout, Yemen
Email address:
*
Corresponding author
To cite this article:
Mohammed Saleh Bashanaini, Mohammed Hadi Al-Douh, Hanan Saeed Al-Ameri. Removal of Malachite Green Dye from Aqueous Solution by Adsorption Using Modified and Unmodified Local Agriculture Waste. Science Journal of Analytical Chemistry. Vol. 7, No. 2, 2019, pp. 42-56. doi: 10.11648/j.sjac.20190702.12
Received: April 7, 2019; Accepted: May 23, 2019; Published: June 3, 2019
Abstract:
Local agriculture waste (Shell’s seeds of Ziziphus spina christi) (SZC), in both its unmodified SZC and acid-modified (SZC-AC) forms, was investigated for its potential use as a low-cost adsorbent for the removal of malachite green (MG). Characterization of the adsorbents was carried out using scanning electron microscope (SEM), Fourier transforms infra-red spectroscopy (FTIR), pH surface, Boehm titration, including, other physical and chemical properties of adsorbent. The effects of initial dye concentration, contact time, solution of pH, temperature and adsorbent dosage were investigated in detail by batch adsorption experiments. For the adsorption of MG were fitted using Langmuir and Freundlich isotherm models, equilibrium isotherms were applicable with maximum monolayer adsorption capacity wear 48.780 mg/g and 370.370 mg/g for the raw shells seeds of Ziziphus spina christi (SZC) and the activated carbon prepared from shells seeds by sulphuric acid SZC-AC, respectively. Kinetics studies showed that both followed the pseudo-second order. Thermodynamics studies indicated that the adsorption of MG was spontaneous on SZC and SZC-AC, and the reactions were endothermic and exothermic, respectively. The proposed adsorbents were successfully applied to the removal of malachite green dye from different water samples with a recovery % >95% and a relative standard deviation (RSD%) <3%.Keywords:
Ziziphus spina christi, Malachite Green, FTIR, SEM, Boehm Titration1. Introduction
Water pollution today is one of the most undesirable environmental problems in the world and it requires solutions [1]. As the overall water demand for grows, the quantity of wastewater produced continuously increasing worldwide, this creates a need for efficient purification methods. Wastewater is often discharged into rivers and lakes or infiltrates into aquifers, where it can affect the quality of freshwater supplies, globally over 80% of the wastewater back into the environment without treatment cause negative consequences for the marine environment [2].
More than 600 organic and inorganic pollutants have been reported in water along with biological pollutants [3]. Among organic contaminants, dyes and coloring agents cause significant environmental harm on both human health and
aquatic organisms. These dyes are high toxicity, carcinogenic, mutagenic, teratogenic, and stable during aerobic degradation [4]. The discharges of industrial wastewater containing very low concentrations of dyes reduce light penetration through the water surface, precluding photosynthesis of the aqueous flora.
brain and liver when ingested, eye burns, fast breathing, profuse sweating and cancer of different parts of the body [6].
Many treatment technologies have been applied to decrease the concentrations dyes from an aqueous media such as adsorption techniques [7], biological treatment [8], decolorization and detoxification [9], photocatalytic degradation [10] and electrochemical degradation [11]. Among treatment strategies, adsorption was regarded to be an effective and preferable method for removing pollutants from wastewater, this method is low cost, the simplicity of design, high removal efficiency, ease of operation and availability. Adsorption is a separation process, in which the number of chemical components being collected (adsorbate) are increased at the surface of a solid (adsorbent).
Agricultural waste have advantages as adsorbents: readily available and exist in abundance, they are cost-effectiveness, renewable, require less processing time, offer suitable adsorption capability and can easily be regenerated [12]. Agricultural waste can be modified by treating it with different chemical agents eg., alkalis, acids, organic compounds, etc., or thermally, this modification could have beneficial effects on chemical/physical properties including increasing surface area, improve pore structure, adding a functional group. Modified adsorbents exhibit adsorption capacity, more selective and sensitive [13]. Many agricultural
wastes such as cotton stalk [14], olive stones [15], coconut shell [16], rice husk [17], orange peel [18], pistachio shell [19] and wheat bran [20] that used in adsorption applications.
Ziziphus spina christi seeds were used as raw material to prepared activated carbon by Omri and Benzina [21]. The activated carbon was obtained by using KOH as chemical activation in the ratio 3/4/1(w/w) a water/KOH/coal at 700°C carbonization temperature and 120 min. activation time. The results of liquid phase adsorption experiments revealed that the prepared activated carbon is a suitable adsorbent for copper from aqueous solutions with maximum capacity value is 104.16 mg/g.
Local agriculture waste shell’s seeds of Ziziphus spina christi is used in this investigation to preparing adsorbents, it grows abundantly in arid land regions in Hadhramout – Yemen, Figure 1. The aim of this investigation is to test the adsorption efficiency of MG from aqueous solution and some water samples onto raw shells seeds of Ziziphus spina christi
(SZC) and activated carbon prepared from shells seeds of
Ziziphus spina christi by sulphuric acid (SZC-AC). The various analytical factors affecting the removal of dyes are investigated as pH, the dose of adsorbent, the initial concentration of dye, the temperature and the contact time. However, the adsorption kinetic, thermodynamic and isotherm studies were determined to foresee the sorption behavior.
Figure 1. Shell’s seeds of Ziziphus spina christi a. before grinding, and b. after grinding.
2. Experimental Part
2.1. Materials
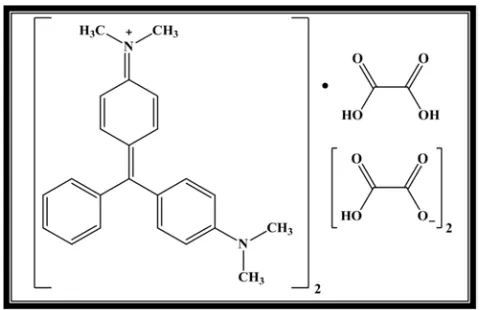
Malachite green (MG) dye, basic green, IUPAC name 4, [4-[[4-(Dimethylamino)phenyl]-phenylmethylidene]
cyclohexa-2,5-dien-1-ylidene]-dimethylazanium; 2-hydroxy-2-oxoacetate; oxalic acid, C.I. 42000; used as an adsorbate,
was purchased from Merck, chemical formula, C54H54N4O12,
molecular weight, 927.00 g/mol, and λmax: 616 nm. Chemical
Figure 2. Molecular structure of Malachite green MG.
2.2. Equipments
The concentrations of MG dyes were determined using JASCO V-750 UV-Vis spectrophotometer was used to determine the concentrations of MG dyes. The pH of the solution was adjusted by OAKTON pH-meter 10N 700. Fourier Transform Infrared FTIR spectroscopy 4000-400 cm
-1
JASCO 4600 FTIR spectrometer. Adsorbent weight was measured using a AND GR 200 electronic balance. These instrumental analyses and experiments were done at PCB Research Laboratory, Faculty of Science, Hadhramout University, Mukalla, Hadhramout, Yemen. The nitrogen adsorption-desorption isotherms were obtained on surface analyzer QUANTACHROME – NOVA 2000. Series were used to measurement of the specific surface area of adsorbent and Scanning electron microscopy JEOL - JSE - T20 in Egypt.
2.3. Preparations of Adsorbents
Shells seeds of Ziziphus spina christi for preparation of adsorbents were collected from trees of Ziziphus spina christi
in Hadhramout – Yemen. The raw materials were first washed repeatedly in order by distilled water to remove dirt and undesirable material from the surface and was then dried in an oven at 110 oC until a constant weight was reached. A part of dried raw materials was crushed and milled for use as raw adsorbent and termed SZC, another part was mixed with H2SO4 in a 3:1 weight proportion. The mixture was
carbonized at 150-200°C, for 4 hr, using a heating rate of 10°C/min. After the carbonization the samples, air flow was used to cool it, then were washed with distilled water at room temperature until the pH value of washed solution became 5-6. Finally, all samples were dried at 100°C until a constant weight was reached. The percentage yield from prepared activated carbon SZC-AC was calculated from the following, Equation (1):
Yield%= ×100 (1)
Where Wtf, Wti the mass of the resulting activated carbon
SZC-AC and the initial mass of the raw, respectively.
2.4. Adsorption Studies
All batch adsorption experiments were executed on shaking water bath carried out using shaker water bath at 100 rpm, 0.05 g of adsorbent / 50 mL of adsorbent solution put in 200 mL Erlenmeyer flasks closed with glass stoppers to avoid evaporation, the dye solutions were shaken at contact time, to determine the adsorption capacity of adsorbents, using variable concentrations of MG between 5-85 mg/L for SZC and between 80-550 mg/L for SZC-AC, to determining the period required to reach the adsorption equilibrium, time duration of shaking ranged between 15 min and 480 min, the influence of pH on elimination of MG was studied at pH range 2.0-10.0 using 0.01 mol/L NaOH or HCl solution, doses of adsorbent 0.025-0.18 g, the temperatures between 25°C and 50°C and ionic strength between 0.00-0.10 N of NaNO3 and NaCl. The capacity of adsorption of MG
removed by adsorbent qe and the removal percentage R% of
dye is determined by the following equations (2) and (3):
q V (2)
R% 100 (3)
Where q: mg/g is the equilibrium concentration of adsorbate on the adsorbent, Co: mg/L is the initial dye
concentration, Ce: mg/L is the dye concentration at
equilibrium, m: g is the mass of adsorbent and V: L is the volume of solution.
3. Results and Discussion
3.1. Characterization of Adsorbents
3.1.1. Surface Area Measurements
The surface area and porosity of adsorbents were estimated using liquid N2 adsorption at 77°C. Specific surface area was
estimated by the BET method (Brunauer–Emmet–Teller) the micropore size distribution, pore diameter and total pore volume obtained from the BJH methods (Barrett- Joyner- Halenda). Figure 3 shows the nitrogen adsorption-desorption isotherms and the pore size distributions of the adsorbent. Figure 3a Indicating both SZC and SZC-AC have plenty of micropores. It was exhibited an additional hysteresis loop at relative pressures indicating it has a significant amount of mesoporous [14, 22].
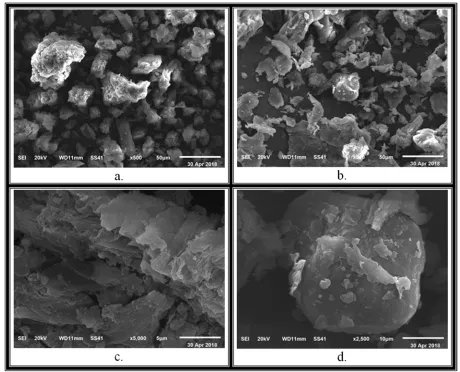
Almost pore diameter of adsorbent distribution less than 2 nm Figure 3b so that the porosity of SZC and SZC-AC are dominated by micropores [23]. This is verified by the derived textural properties shown in Table 1 and the SEM in Figure 4. Table 1 shows the value of the surface area (SBET), total
pore volume (Vt) and average pore diameter (r) for the
adsorbents. Specific surface area shows that SZC-AC has a higher BET specific surface area than SZC. The value SBET
Figure 3. Nitrogen adsorption-desorption curves a. and pore size distributions b. of adsorbents.
Table 1. Textural properties of SZC and SZC-AC.
adsorbents SBET (m2/g) Vt (cm3/g) r (nm)
SZC 8.644 0.017070 1.66
SZC-AC 21.493 0.03779 1.22
3.1.2. Scanning Electron Microscopy Analysis SEM
Scanning electron microscopy SEM has been a primary
tool for characterizing the surface morphology of the adsorbents [25], the morphology of the adsorbent surfaces was investigated using scanning electron microscopy JEOL - JSE - T20 in Egypt. SEM image of the SZC is shown in Figure 4(a,b), while the SEM image of SZC-AC, Figure 4(c,d) have large and well cavities and voids compared to the SZC. So, that there is a good possibility for removal dye.
3.1.3. FTIR Analysis
Figure 5. FTIR spectra of SZC and SZC-AC before and after dye adsorption.
Infrared spectroscopy is powerful tool for identifying different types of chemical bonds, and thus functional groups on the surface of the material. Figure 5 shows the FTIR spectrum of the SZC, SZC-AC, SZC/MG and SZC-AC/MG, which indicated various surface functional groups. The FTIR spectrum of the SZC has a peak at about 3435 cm-1 resulted from O-H stretching vibrations in alcohol carboxylic acids or phenol [26]. This peak observed in the higher energy region 3448 cm-1 and has less intense in SZC-AC. Hence, the water content is also reduced. The low-frequency values for these band suggest that the hydroxyl groups are involved in hydrogen bond. Two peaks were observed at 2909 and 2848 cm-1 attributed to stretching vibrations of C-H aliphatic
bonding observed in SZC. The carbonization by sulfuric acid is also very clear by the decrease in the intensity of C-H after carbonization [27].
The spectra of SZC and SZC-AC has a peak at 1681 cm-1 assigned to stretching vibrations of C=C aliphatic [19]. The phenolic C=C vibrations appear at 1600 cm-1 in SZC and SZC-AC spectrum, these peaks appear at 1567 and 1570 cm-1 in SZC-AC spectrum. The small band at about 1718 cm-1 are attributed to the existence of C=O stretching vibrations of ketones, lactones and carboxyl groups [28]. The bands at 2330 and 3320 cm-1 could be assigned to stretching vibrations in alkynes as acetylenes [29]. The SZC spectrum appears bands in the 1000-1384 cm-1 region assigned to C–O stretching in a carboxylic acid, alcohols and phenols [15]. The spectrum of SZC/MG and SZC-AC/MG shows there is no real shift in our absorption peaks, this is indicated as physical adsorption [26].
3.2. Physical Properties
The bulk density of the prepared adsorbate was measuring by weighing 5 mL of the adsorbent sample using cylinder [30]. The moisture content percent was determined using an oven drying method [31]. The ash content analysis for the adsorbents was determined by heating 0.30 g of samples in crucibles at 600°C using the electrical furnace for 6 hr [32]. The results of the textural properties of adsorbents are listed in Table 2. The SZC-AC has a lower bulk density and the moisture percent than SZC that attributed to after activation process the porosity on SZC-AC surface increases, therefore it is useful for adsorption which it has a high ash content, due to activating agent is dehydrates and decomposition molecules in the raw material and inhibited the formation of ash [33].
Table 2. Physical characteristics of SZC and SZC-AC adsorbents.
Adsorbents Bulk density g/mL Moisture content % Ash content % Yield%
SZC 0.78 46.5 1.6 -
SZC-AC 0.456 57.8 3.6 76.65
3.3. Chemical Properties
The study of the presence of acidic or basic functional groups on the surface adsorbents very important, which these groups effect to the surface charge of the adsorbent and adsorption solution. The amounts of acidic and basic surface groups were determined by Boehm’s method (Boehm’s titration) [34]. Dried adsorbents of 0.075 g were placed in four Erlenmeyer flasks added to each 25 mL of following 0.05 N aqueous solutions: sodium hydroxide, sodium carbonate, sodium bicarbonate and hydrochloric acid. The
samples were shaken for 72 hr at 25°C.
The equilibrated solutions were filtered to remove adsorbent particles, 5 mL were taken off and then titrated with 0.05 HCl or NaOH. The pH of the point of zero charge pHPZC and the pH surface was calculated for each adsorbent
by using an acid-base titration method [35]. The results of Behom's titration and pH determination present in Table 3. The amounts of acidic and basic total surface groups, expressed in meq/g, SZC-AC prepared with H2SO4 present a
higher number of acidic functions than SZC adsorbent.
Table 3. The chemical characteristics of SZC and SZC-AC adsorbents.
Adsorbents Surface groups (meq/g) Surface charge
Carboxyls Lactones Phenols Acidic Basic Surfaces pH pHPZC
SZC 1.2 6.00 9.65 16.85 4.54 6.25 6
3.3.1. The Effect of the Initial Concentration
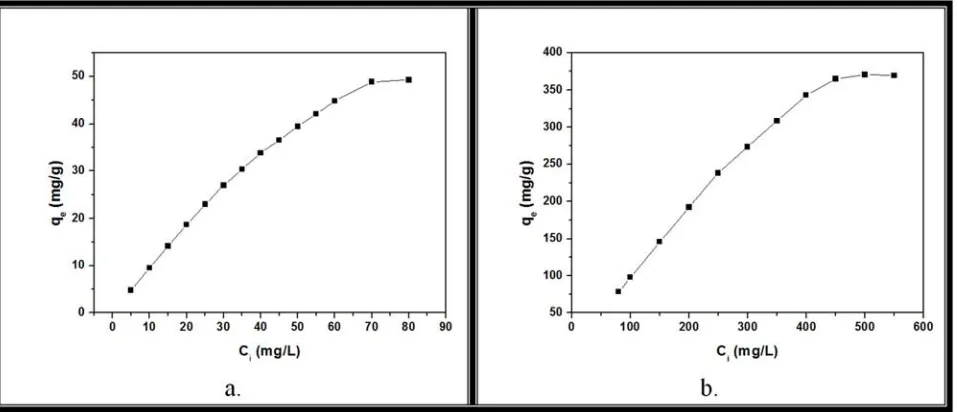
The adsorption is greatly influenced by the concentration of the solution and adsorption reaction are directly proportional to the concentration of the solution [36]. A concentration range of MG 5 to 85 mg/L onto ZSC and 80 to 550 mg/L onto ZSC-AC. Figure 6 shows the effect of initial MG concentration on the adsorption capacity of SZC and SZC-AC. We were found that with the increase in concentration of the MG from 5 to 60 mg/L, the adsorption capacity of MG adsorbed increased sharply from 4.662 to 45.625 mg/g adsorption for SZC, the adsorption capacity
increased from 49.470 to 365.251 mg/g when initial concentration of MG increasing from 50-450 mg/L for SZC-AC.
It attributed to an increase MG concentration, the rate of diffusion and therefore the higher the adsorption capacity [37]. At equilibrium enhanced slightly from 48.873 to 49.258 mg/g and from 371.3061 to 373.0871 with an increase in the initial dye concentration increased from 70 to 85 mg/L and from 500 to 550 mg/L onto SZC and SZC-AC, respectively. Due to the saturation of the available binding sites on the adsorbent [38].
Figure 6. Effect of initial concentration of MG on the adsorption capacity of a. SZC, and b. SZC-AC adsorbent.
3.3.2. Effect of Contact Time on Adsorption
Figure 7 shows the effect of contact time on adsorption capacity for MG at concentration 70 and 450 mg/L on SZC and SZC-AC, respectively. It was clearly observed that the adsorption process of MG dye onto SZC and SZC-AC was
relatively faster rapidly at the initial time, while with the increase of contact time from 300-480 min, the adsorption of MG increased slowly and gradually tended to equilibrium. Therefore, 360 min was selected as the optimum contact time for all further experiments.
3.3.3. Effect of pH
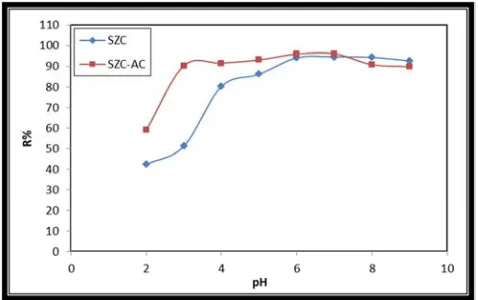
The effect of pH was investigated on the adsorption of MG onto SZC and SZC-AC at the pH range 2.00-9.00, the initial dyes concentration 35 mg/L and 200 mg/L onto SZC and SZC-AC, respectively, while the effect of initial pH on the removal percentage of MG, Figure 8. The results show that the removal percentage of MG on SZC and SZC-AC increased very sharply with an increase in pH from 2.00 to 3.00 but when the pH was between 5.00 and 9.00 for SZC and between 3.00 and 9.00. The increment speed of removal percentage was relatively laggardly. When the pH was between 6.00 and 7.00 the removal percentage reaches its maximum value. As shown previously, the pHPZC of SZC and
SZC-AC was 6 and 3.2, respectively. The adsorbents surface has a positively charged at pH less than the pHPZC when pH
is greater than pHPZC the surfaces of adsorbents have a
negatively charged, the negatively charged SZC and SZC-AC surface is favorable for the adsorption of cationic MG dye. Thus, less adsorption of basic MG dye occurs at lower pH [39].
Figure 8. Effect of pH on removal% of MG by SZC, Conditions: Ci SZC =
35 mg/L; Ci SZC-AC = 200 mg/L; 25°C; equilibrium time = 6 hr.
3.3.4. Effect of Adsorbent Dose
The effect of mass dosage was studied for removal of MG on SZC and SZC-AC by agitating in the range of 0.025 –0.1375 g, the effect of adsorbent dosage on the removal of MG is shown in Figure 9. It is apparent that increasing the
adsorbent dose from 0.025 to 0.100 g, the percent dye removal increasing readily from 53.257% to 97.802% and from 71.958% to 99.866% onto SZC and SZC-AC, respectively. Results the number of available adsorption sites increases by increasing the adsorbent dose, and slightly enhanced from 97.802% to 98.447% and from 99.866% to 99.940% when adsorbent dose increasing from 0.100 to 0.1375 g due to the number of sites available for adsorption site increases by increasing the adsorbent dose [40].
Figure 9. Effect of adsorbent dosage of SZC and SZC-AC on MG removal%. Conditions: m = 0.025-0.1375 g; Ci SZC = 70 mg/L; Ci SZC-AC = 450
mg/L; T = 25°C; equilibrium time = 6 hr.
3.3.5. Effects of Interfering Ions
The present of some ions in water samples, which interfere with the removal of MG dye, 200 mg/L of foreign ions such as Acetate, Oxalate, NO3-, Cl-, Na+, K+, Mg+2,Ca+2, Ba+2,
Fe+3 in 10 mg/L of MG studies to verify the possibility of analytical applications for the proposed method. The results presented in Table 4 show that these ions did not significantly interfere with the determination of the analysis, especially Mg+2 and Fe+3.
Table 4. Effect of interferences on the removal % of MG 10 ppm onto SZC and SZC-AC.
Removal % Interfering ions
Acetate Oxalate NO3- Cl- Na+ K+ Ca2+ Ba2+ Mg2+ Fe3+
SZC 95.870 95.377 82.831 91.740 96.727 97.377 92.442 92.961 88.468 78.494
SZC-AC 97.335 96.332 96.148 96.544 97.335 95.963 92.665 91.557 87.467 82.216
3.3.6. Effect of Ionic Strength
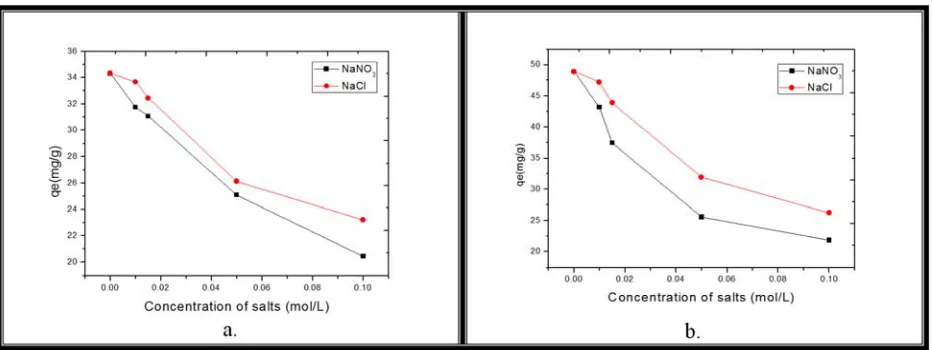
The wastewater contains many ions, therefore the presence of salt in water that may affect the efficiency of the adsorption process. The effects of ion strength on MG adsorbed on SZC and SZC-AC were tested by the addition of NaCl and NaNO3 to the dye solutions. The concentration of
salts used ranged from 0 to 0.100 mol/L. Figure 10, shows the effect of concentration of salts NaNO3 and NaCl on the
Figure 10. Effect of ionic strength on the removal % of a. MG by SZC, and b. MG by SZC-AC, Conditions: Ci SZC = 70 mg/L; Ci SZC-AC = 400 mg/L; T =
25°C; equilibrium time = 6 hr.
3.3.7. Effect of Temperature on the Adsorption Rate
The influence of temperature on adsorption of MG onto SZC was investigated at 25, 32 and 40°C. The capacities of adsorption of MG were represented in Table 5 and Figure 11a. It can be clearly seen that the amount of MG adsorbed on SZC at equilibrium increases with increasing temperature. When the temperature increased from 25°C to 40°C, the maximum amounts of MG removed increased from 48.873 mg/g to 62.029 mg/g, which indicates a high temperature favors MG adsorption for SZC adsorbents.
It is common that the increasing temperature may create a swelling influence inside the adsorbent structure facilitating [22]. For the SZC-AC, it was observed that the adsorption
capacities decreased as the temperature increased in range 25-50°C, which indicates a low temperature favors for removal of MG onto SZC-AC. The experimental results are shown in Figure 11b indicates that the adsorption of MG on to SZC-AC was exothermic in nature.
Table 5. Effect of temperature on maximum adsorption capacities of MG onto SZC and SZC-AC.
qmax mg/g
SZC SZC-AC
25°C 32°C 40°C 25°C 32°C 40°C
48.873 55.047 62.029 370.778 347.256 325.528
Figure 11. Effect of temperature on maximum capacities of MG onto a. SZC and b. SZC-AC.
3.4. Thermodynamic Studies
The mechanism of adsorption may be determined through other thermodynamic Parameter, such as a change in free energy ∆Go, change in enthalpy of adsorption ∆Ho and change in entropy ∆So. The ∆Go, ∆Ho and ∆So were calculated using the equations (4) – (6):
∆Go = – RT ln Kc (4)
∆Go = ∆Ho – T∆So (5) Where R is gas constant (8.314 J/mol/K), T is the absolute temperature in oK and K is the Langmuir constant. Standard enthalpy ∆H° and entropy ∆S° of adsorption could be estimated from Van’t Hoff equation(6).
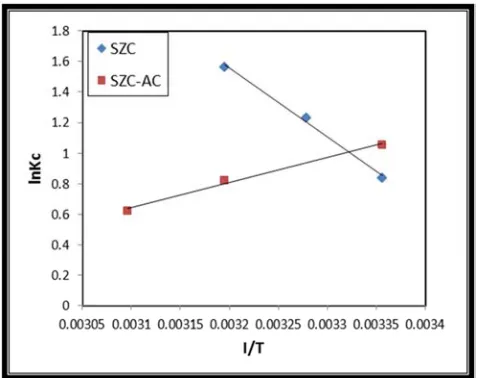
Figure 12. Plots of ln Kc versus 1/T for estimations of thermodynamic
parameters of the adsorption process.
Figure 12 was plotted between ln Kc versus 1/T, the
thermodynamic parameters are presented in Table 6. The positive value of ∆H° suggested the adsorption of MG dye onto SZC is endothermic nature and favored at a high temperature of the adsorption process, but the adsorption of MG dye onto SZC-AC is exothermic in nature. The low value of ∆H° indicates that a weak attractive force between MG and adsorbent surface, this implies the adsorption is physical in nature and loose bonding between the MG molecules and SZC and SZC-AC surface.
The negative values of ∆G° at various temperatures indicate that the adsorption of MG dye onto SZC and SZC-AC is feasible and spontaneous. A shown, the magnitudes of ∆G° from –0.027 to –0.173 K J/mol, a values suggest that the adsorption of MG on SZC and SZC-AC is consistent with electrostatic interaction between adsorption sites and the adsorbing ion physical adsorption, the positive value of ∆S° indicates the increased randomness during the adsorption process [37].
Table 6. Thermodynamic functions ∆Go, ∆So and ∆Ho of MG on SZC at (298, 305 and 313°K) and ZSC-AC at (298, 313 and 323°K).
SZC SZC-AC
∆H° (KJ/mol) ∆S° (KJ/mol) ∆G° (KJ/mol) ∆H° (KJ/mol) ∆S° (KJ/mol) ∆G° (KJ/mol)
298°K 305°K 313°K 298°K 313°K 323°K
0.5422 0.0022 -0.031 -0.173 -0.452 -0.044 -0.059 -0.038 -0.031 -0.027
3.4.1. Adsorption Isotherms
In the present study, the equilibrium data were analyzed using both the Langmuir and Freundlich isotherm models at different temperatures. The adsorption isotherm indicates how the adsorption molecules are distributed between the liquid phase and the solid phase when the adsorption process reaches an equilibrium state, the parameters of equilibrium isotherms often give information on adsorption mechanism, surface properties and affinity of the adsorbent [15, 42].
3.4.2. Freundlich Isotherm
The Freundlich adsorption isotherm [43]. Assumes that adsorption occurs on a heterogeneous surface through a multilayer adsorption mechanism and that the adsorbed
amount increases with the concentration. The Freundlich isotherm is expressed to equation (7):
ln qe= ln KF + 1/n ln Ce (7)
Where: n and KF [mg/g (L/mg)] are both the Freundlich
constants giving an indication of adsorption intensity and capacity, respectively.
The degree of non-linearity between solution concentration and adsorption is n dependent as follows: if the value of n is equal to unity, the adsorption is linear; If the value is below to unity, this implies that adsorption processes chemical; if the value is above unity adsorption is a favorable physical process Plot ln qe vs ln Ce Intercept ln KF and slop 1/n,
Figure 13.
3.4.3. Langmuir Isotherm
The Langmuir adsorption model [44] is based on the assumption that a maximum limiting uptake exists, corresponding to a saturated monolayer of adsorbate molecules at the adsorbent surface. The linear form of the Langmuir isotherm equation is given as equation (8):
1/qe=1/qmax+ 1/(qmax KL Ce) (8)
Where Ce: is the concentration of dye at equilibrium in
solution mg/L, qe: is unit equilibrium adsorption capacity,
qmax: is the theoretical maximum adsorption capacity mg/g
when monolayer is complete, KL: is the Langmuir adsorption
constant i a denoted the energy of adsorption and affinity of the binding sites L/mg.
Both qmax and KL were a determination from slop and
intercept of the plot of 1/qe vs 1/Ce. Langmuir isotherm can
be expressed in terms of a dimensionless constant separation factor or equilibrium parameter, RL is calculated using the
following equation (9):
RL= 1/(1+KLCo) (9)
Where Co: is the initial dye concentration, Kl is Langmuir
constant, the value of factor RL indicates either the adsorption isotherm to be unfavorable RL < 1), favorable (0 <
RL > 1), linear (RL = 1), irreversible (RL = 0).
The isotherm parameters for the adsorption of MG by SZC and SZC-AC at different temperatures are given in Table 7. The correlation coefficient (R2) in the Langmuir model was closer to unity than the Freundlich and theoretical maximum adsorption capacity of adsorbent calculated from Langmuir isotherm equation close to experimental maximum adsorption capacity, this shows the Langmuir model can well describe the adsorption MG dye onto SZC and SZC-AC rather than Freundlich model.
Therefore, it can infer that the mechanism MG adsorption on SZC and SZC-AC is intended to monolayer adsorption. When the temperatures increase, the values kL calculated
from Langmuir model also decrease for adsorption of MG onto SZC This also indicates that the adsorption process is exothermic in nature, but the value of kL increasing for
adsorption of MG into SZC-AC, this also indicates that the adsorption process is endothermic in nature. The value of RL
for all these studies at all temperature between 0 and 1. Therefore, the adsorption is favorable [45].The difference of kL values between SZC and SZC-AC refer to the difference
in binding strength and capacity of the MG with the surface of the adsorbent [25], Figure 14.
Figure 14. Langmuir plot for adsorption of MG on a. SZC and b. SZC-AC at different temperature.
Table 7. Adsorption isotherm parameters for the adsorption of MG on SZC and SZC-AC at different temperatures.
Adsorbent ToC Langmuir isotherm Freundlich isotherm
qmax mg/g KL L/mg RL R2 KF L/g n R2
SZC
25 48.780 0.469 0.02955 0.9974 13.791 2.2375 0.9366
32 57.143 0.534 0.026077 0.9952 16.712 2.26244 0.9308
40 62.112 0.559 0.024918 0.9981 18.04196 2.01776 0.9514
SZC-AC
25 370.370 0.166 0.01323 0.9981 73.936 2.7655 0.9128
40 344.828 0.117 0.01865 0.996 71.887 2.9913 0.9281
50 322.5806 0.095 0.018649 0.996 63.1871 2.94550 0.9338
3.4.4. Adsorption Kinetics
Several mathematical models have been suggested to describe adsorption operations. In this study, for kinetic
Pseudo-first-order model [15, 46] is represented by the following equation (10):
ln (qe-qt) = ln qe – K1t (10)
Where qe and qt refer to the amount of day adsorbent mg/g
at equilibrium and at any time, t min and K1 is the
equilibrium rate constant of pseudo-first-order adsorption 1/min. qe which were obtained from the slopes and intercept
of the linear plots in Figure 15a of ln(qe-qt) vs t, the
Pseudo-second-order [47]. The equation is represented as equation (11):
t/qt = 1/k2q2 2
+ 1/q2t (11)
In the above equation, qt denote the amounts adsorbed at
equilibrium at any time, q2 is the maximum adsorption
capacity of pseudo-second-order adsorption mg/g.min-1, the value of k2 and q2 for the adsorption of the
pseudo-second-order kinetic model can be calculated from the plot of t/qt
against t, Figure 15b.
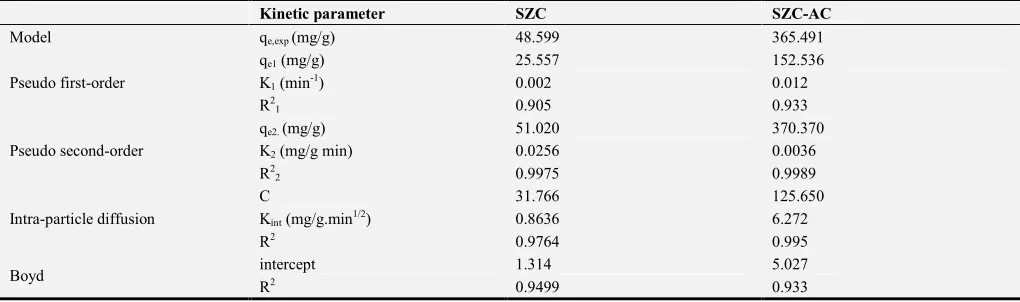
Kinetic parameters of kinetic models are given in Table 8. Lower values of the correlation value for the pseudo-first-order model, this value suggested that first-pseudo-first-order kinetics was not followed during the adsorption process, but the correlation coefficient values of pseudo-second order are closer to unity. Moreover, the qe values calculated 51.020
mg/g and 370.370 mg/g onto SZC and SZC-AC, respectively. From pseudo-second-order model were more consistent with the experimental values 48.598 mg/g and 365.488 mg/g onto SZC and SZC-AC, respectively.
Therefore, it can be concluded that the adsorption of MG onto SZC and SZC-AC followed pseudo-second-order kinetic model. The adsorption process controlled either by one or more steps, e.g. film or external diffusion, pore diffusion, and intra-particle transport surface diffusion and adsorption on the pore surface. The possibility of intra-particle diffusion was explored by using the intra-intra-particle diffusion model [48], can be expressed as follows equation (12):
qt = Kit1/2 +c (12)
Where qt is the amount of solute on the surface of
adsorbent at time t (mg/g) Kit is the intra-particle diffusion
rate constant mg/(g min1/2, and c is a constant reference to the thickness of the boundary layer, the larger value of c, the greater the boundary layer effect.
Figure 15c presents the plots of qt of MG onto SZC and
SZC-AC versus t1/2 for adsorbents revealed that the data points are related by two straight lines, then the adsorption process controlled by more steps, the first straight portion represents to mass transfer MG from bulk solution to the external surface of adsorbents and diffusion of MG onto the adsorption site. The straight line deviation from the origin indicates that the adsorption process is not only controlled by intra-particle diffusion and might be due to the difference in the mass transfer rate in the initial and final stages of adsorption, the large value of the intra-particle diffusion constant Cint that indicate the boundary
layer has a more significant effect about the diffusion mechanism [49].
3.4.5. The Boyd Kinetics Model
To suggest the slow step involved in the adsorption process the kinetics data were also subjected to Boyd kinetics [50], the Boyd kinetics model is represented by the following equation (13):
Bt = – 0.4977 – ln (1-F) (13) Where F represents the fraction of solute adsorbed at any time, t min, as calculated from equation (14):
F = qt/q0 (14)
Where q0 is the amount of adsorbents adsorbed at infinite
time mg/g and qt is the amount of adsorbents adsorbed at any
time t min. Bt calculated from equation (13) and the Bt values were plotted vs time t, Figure 15d, when the line pass throw the origin, the adsorption mechanism was governed by external mass transport where particle diffusion is the rate-limiting step.
Table 8. Kinetic parameters for the adsorption MG onto ZSC and ZSC-AC.
Kinetic parameter SZC SZC-AC
Model qe,exp (mg/g) 48.599 365.491
Pseudo first-order
qe1 (mg/g) 25.557 152.536
K1 (min-1) 0.002 0.012
R2
1 0.905 0.933
Pseudo second-order
qe2. (mg/g) 51.020 370.370
K2 (mg/g min) 0.0256 0.0036
R2
2 0.9975 0.9989
Intra-particle diffusion
C 31.766 125.650
Kint (mg/g.min1/2) 0.8636 6.272
R2 0.9764 0.995
Boyd intercept 1.314 5.027
Figure 15. Kinetic models for adsorption of MG a. Pseudo-first order, b. Pseudo-second order, c. Intra-particle diffusion, and d. Boyd model.
3.5. Analytical Applications
To verify the possibility of analytical applications for the prepared adsorbents. For this purpose, known amounts MG spiked to different natural water samples as tap water, sea water and wastewater. The results were listed in Table 9, the recovery % ranged between 94.737% and 99.7691% with a relative standard deviation (RSD %, < 3), the obtained results indicated the prepared adsorbents were successfully, feasible and satisfactory to analyze water samples, Table 10.
Table 9. Recovery% and RSD% of MG from different water samples using SZC and SZC-AC, n = 3.
Sample Location Adsorbate MG added (mg/g) R% RSD%
Tap water from the lab
SZC
2 95.1715 0.739
4 94.9285 0.553
8 94.7372 0.796
SZC-AC
5 98.7327 0.488
10 98.5447 0.685
15 98.2221 0.906
Sea water Mukalla city
SZC
2 97.2616 0.505
4 96.3231 0.539
8 96.2464 1.293
SZC-AC
5 99.7691 0.167
10 99.2507 0.443
15 99.190 0.436
Wastewater
Al-Khor – Mukalla city
SZC
2 96.467 0.621
4 96.547 0.610
8 96.047 0.450
SZC-AC
5 99.220 0.296
10 99.301 0.306
Table 10. Adsorption capacities of different adsorbents previously reported for the removal of MG compared with SZC and SZC-AC.
Adsorbents Adsorption capacity (mg/g) Reference
Shells seeds of Ziziphus spina christi SZC 48.780 Present study
Modified shells seeds of Ziziphus spina christi with Sulphuric acid SZC-AC 370.370 Present study
Neem sawdust 4.354 Khattri and Singh [51]
Chemically modified rice husk 17.98 Chowdhury et al. [17]
CO2-activated porous carbon CAC from cattail biomass 210.18 Yu et al. [52]
Wheat Bran 66.57 Wang et al. [20]
Cellulose modified with phthalic anhydride CPA 111.00 Akl et al. [41]
Sulphuric acid-treated sawdust PCSDC 65.8 Garg et al. [53]
Orange peal 483.63 Kumar and Porkodi [18]
NaOH- modified breadnut peel 353.00 Chieng et al. [54]
EDTAD-modified Sugarcane Bagasse 156.20 Xing and Deng [55]
phosphoric acid esterifying soybean hull 178.57 Gong et al. [56]
Modified rice straw MRC with citric acid AC 256.41 Gong et al. [40]
4. Conclusions
From this work, it is seen that SZC and SZC-AC could be a good adsorbent for removal the cationic dye from water. The pH of the adsorption system did not present significant effects on the adsorption capacity for values below the PZC and the adsorption process performed without controlling the pH of the medium. Thermodynamic parameters suggest that the adsorption is a physical process, spontaneous, and exothermic on SZC and exothermic in nature. The experimental data were well fitted to the Langmuir isotherm model at all temperature and monolayer adsorption capacity increasing after modify. The kinetics of MG adsorption was based on the assumption of the pseudo-second-order mechanism The results presented in this study indicate that Shell’s Seeds of Ziziphus spina christi presents great potential as an inexpensive and easily available alternative adsorbent for the removal of cationic dyes in wastewater treatments.
Conflicts of Interest
The authors declare that there is no conflict of interest regarding the publication of this article.
Acknowledgements
We thank Mrs. Gehan A. Balala in PCB Research Laboratory, Faculty of Science, Hadhramout University for UV–Vis and FTIR analyses.
References
[1] Vakili, M., Rafatullah, M., Ibrahim, M. H., Abdullah, A. Z., Salamatinia, B., and Gholami, Z. “Oil palm biomass as an adsorbent for heavy metals”. Reviews of Environmental Contamination and Toxicology. 232, 61, 2014. DOI 10.1007/978-3-319-06746-9_3.
[2] Connor, R., Renata, A., Ortigara, C., Koncagül, E., Uhlenbrook, S., Lamizana-Diallo, B. M. and Hendry, S. “The
united nations world water development report 2017. Wastewater: The untapped resource”. The United Nations World Water Development Report. 2017.
[3] Gupta, V. K., Mittal, A., Krishnan, L. and Gajbe, V. “Adsorption kinetics and column operations for the removal and recovery of malachite green from wastewater using bottom ash”. Separation and Purification Technology, 40: 87, 2004. DOI: 10.1016/j.seppur.2004.01.008.
[4] Gupta, V. K. and Ali, I. “Environmental Water. Advances in Treatment, Remediation and Recycling”. Elsevier, Oxford, UK. pp 209, 2013.
[5] Mittal, A., Mittal, J., Malviya, A. and Gupta, V. K. “Adsorptive removal of hazardous anionic dye “Congo red” from wastewater using waste materials and recovery by desorption”. Journal of Colloid and Interface Science, 340: 16, 2009. DOI: org/10.1016/j.jcis.2009.08.019.
[6] Raval, N. P., Shah, P. U. and Shah, N. K. “Malachite green “a cationic dye” and its removal from aqueous solution by adsorption”. Applied Water Science, 7, 3407, 2017. DOI 10.1007/s13201-016-0512-2.
[7] Ghasemi, M., Mashhadi, S., Asif, M., Tyagi, I., Agarwal, S. and Gupta, V. K. “Microwave-assisted synthesis of tetraethylenepentamine functionalized activated carbon with high adsorption capacity for Malachite green dye”. Journal of Molecular Liquids, 213, 317, 2016. DOI: 10.1016/j.molliq.2015.09.048.
[8] Paz, A., Carballo, J., Pérez, M. J. and Domínguez, J. M. “Biological treatment of model dyes and textile wastewaters”. Chemosphere, 181, 168, 2017. DOI: 10.1016/j.chemosphere.2017.04.046.
[9] Maalej-Kammoun, M., Zouari-Mechichi, H., Belbahri, L., Woodward, S. and Mechichi, T. “Malachite green decolourization and detoxification by the laccase from a newly isolated strain of Trametes sp”. International Biodeterioration & Biodegradation, 63, 600, 2009. DOI: 10.1016/j.ibiod.2009.04.003.
[11] Steter, J. R., Barros, W. R., Lanza, M. R. and Motheo, A. J. “Electrochemical and sonoelectrochemical processes applied to amaranth dye degradation”. Chemosphere, 117, 200, 2014. DOI: 10.1016/j.jhazmat.2007.06.069.
[12] Nguyen, T. A. H., Ngo, H. H., Guo, W. S., Zhang, J., Liang, S., Yue, Q. Y. and Nguyen, T. V. “Applicability of agricultural waste and by-products for adsorptive removal of heavy metals from wastewater”. Bioresource Technology, 148, 574, 2013. DOI: 10.1016/j.biortech.2013.08.124.
[13] Gao, R., Hu, Z., Chang, X., He, Q., Zhang, L., Tu, Z. and Shi, J. “Chemically modified activated carbon with 1-acylthiosemicarbazide for selective solid-phase extraction and preconcentration of trace Cu (II), Hg (II) and Pb (II) from water samples”. Journal of Hazardous Materials, 172, 324, 2009. DOI: 10.1016/j.jhazmat.2009.07.014.
[14] Hu, L., Peng, Y., Wu, F., Peng, S., Li, J. and Liu, Z. “Tubular activated carbons made from cotton stalk for dynamic adsorption of airborne toluene”. Journal of the Taiwan Institute of Chemical Engineers, 80, 399, 2017. DOI: 10.1016/j.jtice.2017.07.029.
[15] Hazzaa, R. and Hussein, M. “Adsorption of cationic dye from aqueous solution onto activated carbon prepared from olive stones”. Environmental Technology and Innovation, 4, 36-51, 2015. DOI: 10.1016/j.eti.2015.
[16] Sekar, M., Sakthi, V. and Rengaraj, S. “Kinetics and equilibrium adsorption study of lead (II) onto activated carbon prepared from coconut shell”. Journal of Colloid and Interface Science, 279, 307-313, 2004. DOI: 10.1016/j.jcis.2004.06.042. [17] Chowdhury, S., Mishra, R., Saha, P. and Kushwaha, P.
“Adsorption thermodynamics, kinetics and isosteric heat of adsorption of malachite green onto chemically modified rice husk”. Desalination, 265, 159, 2011. DOI: 10.1016/j.desal.2010.07.047.
[18] Kumar, K. V. and Porkodi, K. “Batch adsorber design for different solution volume/adsorbent mass ratios using the experimental equilibrium data with fixed solution volume/adsorbent mass ratio of malachite green onto orange peel”. Dyes and Pigments, 74, 590, 2007. DOI: 10.1016/j.dyepig.2006.03.024.
[19] Akl, M. A., Mostafa, M. M. and Bashanaini, M. S. “Enhanced Removal of Some Cationic Dyes from Environmental Samples Using Sulphuric Acid Modified Pistachio Shells Derived Activated Carbon”. Journal of Chromatography. Separation. Techniques, 7, 1, 2016. DOI: 10.4172/2157-7064.1000329. [20] Wang, X. S., Zhou, Y., Jiang, Y. and Sun, C. “The removal of
basic dyes from aqueous solutions using agricultural by-products”. Journal of Hazardous Materials, 157, 374, 2008. DOI: 10.1016/j.jhazmat.2008.01.004.
[21] Omri, A. and Benzina, M. “Characterization of activated carbon prepared from a new raw lignocellulosic material: Ziziphus spina-christi seeds”. Journal de la Société Chimique de Tunisie, 14, 175-183, 2012.
[22] Auta, M. and Hameed, B. H. “Modified mesoporous clay adsorbent for adsorption isotherm and kinetics of methylene blue”. Chemical Engineering Journal, 198, 219, 2012. DOI: 10.1016/j.cej.2012.05.075.
[23] Wang, H., Zhu, T., Fan, X. and Na, H. “Adsorption and desorption of small molecule volatile organic compounds over carbide-derived carbon”. Carbon, 67, 712-720, 2014. DOI:
10.1016/j.carbon.2013.10.063.
[24] Vijayalakshmi, P., Bala, V. S. S., Thiruvengadaravi, K. V., Panneerselvam, P., Palanichamy, M. and Sivanesan, S. “Removal of acid violet 17 from aqueous solutions by adsorption onto activated carbon prepared from pistachio nut shell”. Separation Science and Technology, 46 (1), 155-163, 2010. DOI: 10.1080/01496395.2010.484006.
[25] Aljeboree, A. M., Alshirifi, A. N. and Alkaim, A. F. “Kinetics and equilibrium study for the adsorption of textile dyes on coconut shell activated carbon”. Arabian Journal of
Chemistry, 10: S3381, 2017. DOI:
10.1016/j.arabjc.2014.01.020.
[26] Gomez-Serrano, V., Pastor-Villegas, J., Perez-Florindo, A., Duran-Valle, C. and Valenzuela-Calahorro, C. “FT-IR study of rockrose and of char and activated carbon”. Journal of Analytical and Applied Pyrolysis, 36, 71, 1996. DOl: 10.1016/0I65-2370(95)00921-3.
[27] Kumar, P. S., Palaniyappan, M., Priyadharshini, M., Vignesh, A. M., Thanjiappan, A., Sebastina, A., Fernando, P. and Srinath, R. “Adsorption of basic dye onto raw and surface‐modified
agricultural waste”. Environmental Progress & Sustainable Energy, 33 (1), 87-98, 2013. DOI 10.1002/ep.11756.
[28] Silverstein, R. M., Webster, F. X. and Kiemle, D. J. “Spectrometric identification of organic compound”. 7th Ed., John Wiley and Son. Inc., USA, 2005.
[29] Pavia, D. L., Lampman, G. M., Kriz, G. S. and Vyvyan, J. A. “Introduction to spectroscopy”. 5th Ed., Cengage Learning, Stamford, USA, 2014.
[30] American Society for Testing and Materials. “Standard Test Method for Apparent Density of Activated Carbon”. Designation, D2854-09, 2009. DOI: 10.1520/D2854-09 . [31] American Society for Testing and Materials. “Standard Test
Method for Moisture in Activated Carbon”, Designation, D2867-09, 2009. DOI: 0.1520/D2867-09.
[32] American Society for Testing and Materials. “Standard test method for total ash content of activated carbon”, Designation, D2866, 2011. DOI: 10.1520/D2866-11.
[33] Othman, A. M. “Preparation of Sulfurized Granular Activated Carbon from Beji Asphalt Using Concentrated H2SO4”. Tikrit Journal of Pure Science, 13, 75, 2008.
[34] Strelko Jr, V. and Malik, D. J. “Characterization and metal sorptive properties of oxidized active carbon”. Journal of Colloid and Interface Science, 250 (1), 213-220, 2002. DOI: 10.1006/jcis.2002.8313.
[35] Malik, D. J., Strelko, Jr. V., Streat, M. and Puziy, A. “Characterisation of novel modified active carbons and marine algal biomass for the selective adsorption of lead”. Water Research, 36, 1527, 2002. DOI: 10.1016/S0043-1354(01)00348-7.
[36] Namasivayam, C. and Kavitha, D. “Removal of Congo Red from water by adsorption onto activated carbon prepared from coir pith, an agricultural solid waste”. Dyes and Pigments, 54, 47, 2002. DOI: 10.1016/S0143-7208(02)00025-6.
[38] Bulut, Y. and Aydın, H. “A kinetics and thermodynamics study of methylene blue adsorption on wheat shells”. Desalination, 194, 259, 2006. DOI: 10.1016/j.desal.2005.10.032.
[39] Franca, A. S., Oliveira, L. S. and Ferreira, M. E. “Kinetics and equilibrium studies of methylene blue adsorption by spent coffee grounds”. Desalination, 249, 267, 2009. DOI; 10.1016/j.desal.2008.11.017.
[40] Gong, R., Jin, Y., Chen, F., Chen, J. and Liu, Z. “Enhanced malachite green removal from aqueous solution by citric acid modified rice straw”. Journal of Hazardous Materials, 137, 865, 2006. DOI: 10.1016/j.jhazmat.2006.03.010.
[41] Akl, M. A., Youssef, A. M. and Al-Awadhi, M. M. “Adsorption of acid dyes onto bentonite and surfactant-modified bentonite”. Journal of Analytical and Bioanalytical Techniques, 4, 3, 2013. DOI: 10.4172/2155-98721000174. [42] Zhou, Y., Min, Y., Qiao, H., Huang, Q., Wang, E. and Ma, T.
“Improved removal of malachite green from aqueous solution using chemically modified cellulose by anhydride”. International Journal of Biological Macromolecules, 74, 271, 2015. DOI: 10.1016/j.ijbiomac.2014.12.020.
[43] Freundlich, H. and Heller, W. “The adsorption of cis-and trans-azobenzene”. Journal of the American Chemical Society, 61, 2228, 1939. DOI: 10.1021/ja01877a071.
[44] Langmuir, I. “The adsorption of gases on plane surfaces of glass, mica and platinum”. Journal of the American Chemical Society, 40, 1361, 1918. DOI: 10.1021/ja02242a004.
[45] Gercel, O. and Gercel, H. F. “Adsorption of lead (II) ions from aqueous solutions by activated carbon prepared from biomass plant material of Euphorbia rigida”. Chemical Engineering Journal, 132, 289, 2007. DOI: 10.1016/j.cej.2007.01.010. [46] Kushwaha, A. K., Gupta, N. and Chattopadhyaya, M. C.
“Adsorption behavior of lead onto a new class of functionalized silica gel”. Arabian Journal of Chemistry, 10, S81, 2017. DOI: 10.1016/j.arabjc.2012.06.010.
[47] Ho, Y. S. and McKay, G. “Pseudo-second order model for sorption processes. Process Biochemistry”, 34, 451, 1999. DOI: 10.1016/S0032-9592(98)00112-5 .
[48] Kannan, N. and Sundaram, M. M. “Kinetics and mechanism of removal of methylene blue by adsorption on various carbons—a comparative study”. Dyes and Pigments, 51, 25, 2001. DOI: 10.1016/S0143-7208(01)00056-0 .
[49] Bhattacharyya, K. G. and Sharma, A. “Kinetics and thermodynamics of methylene blue adsorption on neem (Azadirachta indica) leaf powder”. Dyes and Pigments, 65, 51, 2005. DOI: 10.1016/j.dyepig.2004.06.016.
[50] Boyd, G. E., Adamson, W. and Myers, L. S. “The exchange adsorption of ions fraqueous solutions by organic zeolites; kinetics”. Journal of American Chemical Society, 69, 2881, 1947. DOI: 10.1021/ja01203a064.
[51] Khattri, S. D. and Singh, M. K. “Removal of malachite green from dye wastewater using neem sawdust by adsorption”. Journal of Hazardous Materials, 167, 1089, 2009. DOI: 10.1016/j.jhazmat.2009.01.101.
[52] Yu, M., Han, Y., Li, J. and Wang, L. “CO2-activated porous carbon derived from cattail biomass for removal of malachite green dye and application as supercapacitors”. Chemical Engineering Journal, 317, 493, 2017. DOI: 10.1016/j.cej.2017.02.105 .
[53] Garg, V. K., Kumar, R. and Gupta, R. “Removal of malachite green dye from aqueous solution by adsorption using agro-industry waste: a case study of Prosopis cineraria”. Dyes and Pigments, 62, 1, 2004. DOI: 10.1016/j.dyepig.2003.10.016. [54] Chieng, H. I., Lim, L. B. and Priyantha, N. “Enhancing
adsorption capacity of toxic malachite green dye through chemically modified breadnut peel: equilibrium, thermodynamics, kinetics and regeneration studies”. Environmental Technology, 36, 86, 2015. DOI: 10.1080/09593330.2014.938124.
[55] Xing, Y. and Deng, D. “Enhanced adsorption of malachite green by EDTAD-modified sugarcane bagasse”. Separation Science and Technology, 44, 2117, 2009. DOI: 10.1080/01496390902775588.