THE EFFECT OF RADOME ON
RESONANCE CHARACTERISTICS OF
TRIANGULAR PATCH ANTENNA.
M. BISWAS
Department of Electronics & Tele-Communication Engineering, Jadavpur University, Kolkata, 700032, India
A. MANDAL
Department of Electronics and Communication Engineering, Future Institute of Engineering and Management, Kolkata 700 150, India
Abstract:
A simple and accurate CAD model based on cavity model analysis is proposed to predict the effect of superstrate or radome on resonant frequencies of an equilateral triangular patch antenna. The computed values for wide range of superstrate parameters and patch sizes are compared with different theoretical and experimental values available in open literature showing close agreement. A Maxwell’s equation solver is used to generate some simulated data.
Keywords: CAD; triangle; superstrate.
1. Introduction
Recent advanced studies on microstrip antenna with triangular patch geometry reveal the versatility of the same for miniaturization of the physical dimensions with respect to other common shapes like circular or rectangular geometry and thereby reducing the volume and weight of the antenna configuration. Though the triangular patch is narrowband structure yet in some applications such as compact array with reduced coupling [2] and microstrip band pass filters [3], it may be used with greater advantages. Because of its easy conformability it can be used in curved surfaces also.
Due to some natural phenomena (rainfall, fog, snowfall etc.) an unwanted layer will be formed above the patch. This unwanted layer degrades the antenna performances manifold. Dielectric cover, termed as superstrate, protects the patch from environmental hazards and improves the antenna performances. Antenna tuning is also possible by varying the superstrate parameters (thickness and dielectric constant) without changing the antenna parameters. Another interesting feature of substrate-superstrate combined geometry is its narrower impedance bandwidth for which it will be able to extract the signal of interest in the regions where the surrounding electromagnetic spectrum is full of congestions.
Above all, the application of the dielectric cover in the form of radome contributes some significant changes in the resonant frequency [1, 7], bandwidth [1, 11] and gain [5, 11].
The equilateral triangular patch antenna (ETPA) has been investigated by many researchers [2-4, 8-10, 12-13]. In those studies, they have not employed any dielectric cover in the form of radome above the patch. The triangular patch with radome is least investigated geometry. A few researchers [1, 5, and 7] have considered the effect of radome on the performances of triangular patch. In [5], the gain of a chip resistor loaded triangular patch is enhanced using a dielectric cover. A full wave analysis and some theoretical results were presented in [7]. Neither any experimental results nor any design guidelines are available in [5, 7] to estimate the resonant frequency and input impedance with radome. Recently, [1] has reported a design guideline and experimental results including radome effect. But there is a discrepancy between measured and theoretical values and involves large mathematical steps.
In this paper a simple and accurate CAD model based on cavity model analysis is proposed to predict the effect of superstrate or radome on resonant frequencies of an ETPA. The computed resonant frequencies for wide range of superstrate parameters and patch sizes have been reported here. The computed values are compared with different theoretical and experimental values available in open literature and close agreement revealed. A Maxwell’s equation solver CFDTD [14] has been employed to validate our computed values also.
2. Theoretical Formulations
A simple and more general expression for the resonant frequencies of TMnml modes of an equilateral
triangular microstrip patch antenna using the cavity model analysis by Helszajn [13], can be given as
2 / 1 ) 2 2
( 3
2
, n nm m
re a
c nm
r f
e
(1)
where, c is the velocity of light in free space, ae is the effective side length of the ETPA in presence of a
dielectric superstrate, re is the effective relative permittivity of the substrate-superstrate combination geometry
and m, n & l are integers which are never zero simultaneously satisfying the condition
m
n
l
0
.The quantity re can be computed from [6]. They have computed the re of multilayered rectangular patch
antenna with width b and length L. This model can be extended to compute the re of a triangular patch (Fig. 1)
using an equivalence relation between a rectangular patch of width b and length L and an equilateral triangular
patch with side length a operating at same resonant frequency. To account for equal static fringing fields, equal
area has been considered as the basis of equivalence, resulting in
bL( 3/4)a2
(2)
Now we equate the zeroth order resonant frequencies of rectangular patch and triangular patch without fringing to get,
r r
r
a c
L c f
3
2 2
10
,
Hence,
L
(
3
/
4
)
a
(3)
From relation (2) and (3) we get
b
a
3
1
(4)
The relations (3) and (4) are the equivalence relation between a rectangular patch (width b and length L) and
an equilateral triangular patch (side length a)
The re for a triangular patch of side length a sandwiched between two dielectric layers (Fig.1), lower one
being substrate of thickness d1, dielectric constant r1 and upper one as a superstrate of thickness d2,dielectric
constant r2, can be calculated as [6]
d1 d2
r1 r2
a
2 4 2 4 3 4 2 1 2 4 1 4 3 2 1 4 3 2 2 2 2 4 3 4 2 2 3 2 2 2 2 1 1 1 1 }] ) ( { ) 1 ( ) ( [ }] ) ( { [ ) 1 ( v v v v v v v v v v v v v v v v v v v v r r r r r r r r re
(5)
where,1 4 1
1
ln
(
1
)
2
1
b
v
d
b
d
v
e e
v
2
1
v
1
v
3
2
v
4
(0.5 / ) 0.5 / sin(0.5 / )
) 2 cos( ln
2 2 1 1 1
1 1
1
3 t d
d t d d d t d b b t d v e e
)
2
2
(
ln
2
1 1 4 e eb
d
b
d
v
( 2)( / ) 2
/ arctan 2 1 1 2 1 d b d d d t e
}] 451 . 1 ) 2 / 94 . 0 {ln( ) 1 ( } ) ( ) 1 ( 164 . 0 882 . 0 [{
/ 1 1 2 1 1
b d d d b d
b rp rp rp rp re rp
e
2 / 1 1 2 / 1 1
)
10
1
(
1
)
10
1
(
1
2
e e re rpb
d
b
d
The quantities be and rp are determined by the iteration technique starting with an approximation rp = r1
and re= rp [6].
The actual side length a of an equilateral triangle is extended by the fringing electric field and is expressed as ae. The fringing fields are very much dependent on the relative characteristics of the substrate and superstrate
as indicated in [12]. For computing ae, MB [1] has employed a large expression but here we have employed a
very simple expression. The effective side length (ae) can be calculated from [10] as
) 25 . 2 2 . 1 ( 1 re
e a d
a
(6)
3. Results and Discussions
In this section we have reported the computed values employing present model and compared these with the different theoretical and experimental values available in open literature.
In Fig.2 we have compared our computed values with computed and measured values [1]. Here the design parameters are a = 20.3 mm, d1 = d2 =1.575 mm, r1 =2.33 and feed is located near = 9.9 mm. The measured
value for this substrate – superstrate combination is 5.473 GHz [1]. The computed value is 5.479 GHz by employing the present model and 5.485 GHz for [1]. The percentage error [{(measured-computed)/measured}
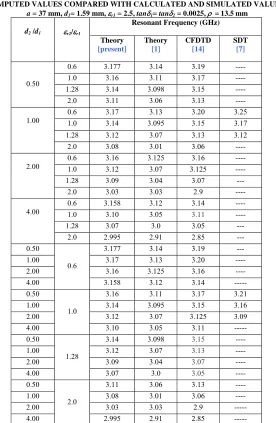
100] for present model is 0.11% and 0.22% for [1]. So the present model is more close to the experiment. The present model is further verified by employing electromagnetic software [14]. In table I, we have compared our computed values with different theoretical values [1], SDT [7] and CFDTD [14] for wide range of
d2 and r2 of superstrate. The comparative studies show closer agreement between the present theory and the
simulated values [7] and [14] compared to theory [1].
Fig. 2. Measured and computed dominant mode resonant frequency versus r2 /r1 of an ETPA with superstrate. a = 20.3 mm, d1 = d2 =1.575 mm, r1 =2.33, = 9.9 mm.
TABLE I
COMPUTED VALUES COMPARED WITH CALCULATED AND SIMULATED VALUES:
a = 37 mm, d1= 1.59 mm, r1 = 2.5, tan1= tan2 = 0.0025, =13.5mm
d2 /d1 r2/r1
Resonant Frequency (GHz)
Theory
[present]
Theory
[1]
CFDTD
[14]
SDT
[7]
0.50
0.6 3.177 3.14 3.19 ---- 1.0 3.16 3.11 3.17 ---- 1.28 3.14 3.098 3.15 ----
2.0 3.11 3.06 3.13 ----
1.00
0.6 3.17 3.13 3.20 3.25 1.0 3.14 3.095 3.15 3.17 1.28 3.12 3.07 3.13 3.12 2.0 3.08 3.01 3.06 ----
2.00
0.6 3.16 3.125 3.16 ---- 1.0 3.12 3.07 3.125 ---- 1.28 3.09 3.04 3.07 ---
2.0 3.03 3.03 2.9 ----
4.00
0.6 3.158 3.12 3.14 ---- 1.0 3.10 3.05 3.11 ---- 1.28 3.07 3.0 3.05 ---
2.0 2.995 2.91 2.85 --- 0.50
0.6
3.177 3.14 3.19 ---
1.00 3.17 3.13 3.20 ----
2.00 3.16 3.125 3.16 ----
4.00 3.158 3.12 3.14 ---
0.50
1.0
3.16 3.11 3.17 3.21
1.00 3.14 3.095 3.15 3.16
2.00 3.12 3.07 3.125 3.09
4.00 3.10 3.05 3.11 ---
0.50
1.28
3.14 3.098 3.15 ----
1.00 3.12 3.07 3.13 ----
2.00 3.09 3.04 3.07 ----
4.00 3.07 3.0 3.05 ----
0.50
2.0
3.11 3.06 3.13 ----
1.00 3.08 3.01 3.06 ----
2.00 3.03 3.03 2.9 ---
4.00 2.995 2.91 2.85 ---
0.50 0.75 1.00 1.25 1.50 1.75
5.0 5.5 6.0
f r,1
0
(GHz
)
r2/r1
The effect of superstrate parameters on re and fr,10 is visualized in Fig.3.The variation of re and fr,10 with
r2 for different values of d2 are depicted in Fig.3(a). The data points show that the re almost linearly increases
with increase of r2 and the fr,10 decreases almost linearly with increase of r2. Similarly Fig. 3(b) demonstrate the
change of re and fr,10 with d2 for different values of r2. The re increases exponentially with increase of d2 and
consequently fr,10 decreases exponentially with increase of d2. From Fig.3 it is observed that change in fr,10 and
re is more pronounced for higher values of d2 and r2.These plots have immense influence in designing the
ETPA with superstrate.
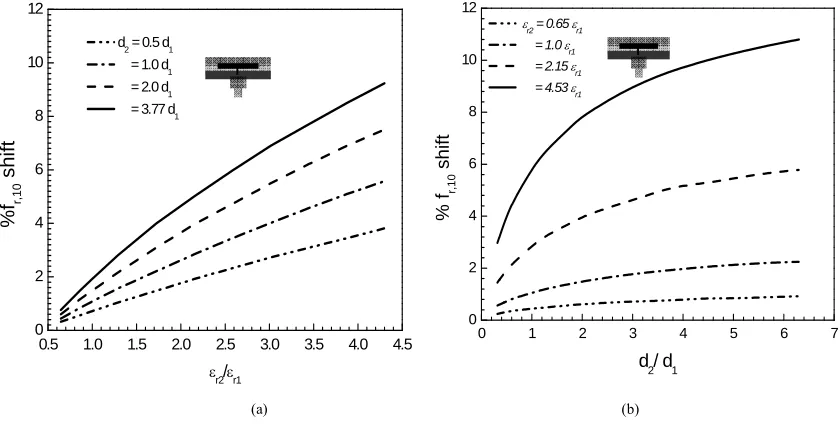
Varying d2 and r2 it is possible to tune the antenna, studied in Fig. 4. The percentage shifts in fr, 10 [{(fr, 10 without superstrate- fr, 10 with superstrate)/ fr, 10 without superstrate} 100] with the variations of d2 and r2 with respect to the patch
without superstrate are calculated and graphically presented here. The occurrence of more percentage shift in
fr,10 for a superstrate having higher values of d2 and r2 is evident from these plots.
(a) (b)
Fig. 4. Computed %fr, 10 shift versus r2 /r1 andd2/d1 of a superstrate loaded ETPA for different values of d2 and r2. fr without superstrate = 2.49 GHz. Parameters as in Fig. 3. (a) d2 variable (b) r2 variable.
(a) (b)
Fig. 3. Computed dominant mode resonant frequency and re versus r2 /r1 and d2/d1 of a superstrate loaded ETPA for different values of d2 and
r2. a = 50.0 mm, d1 = 1.59 mm, r1 = 2.32. (a) d2 variable (b) r2 variable.
0 1 2 3 4 52.0
2.1 2.2 2.3 2.4 2.5 2.6 2.7 2.8 2.9 3.0
2.0 2.1 2.2 2.3 2.4 2.5
re
r2 /r1 f r,10
(G
Hz
)
d2 = 0.5 d1
= 1.0 d1
= 2.0 d1
= 3.77 d1
2.00 2.05 2.10 2.15 2.20 2.25 2.30 2.35 2.40 2.45 2.50
0 1 2 3 4 5 6 72.0
2.1 2.2 2.3 2.4 2.5 2.6 2.7 2.8 2.9 3.0
f r,10
(G
H
z)
re
d2/d1
r2= 0.65 r1
= 1.0
r1
= 2.155 r1
= 4.526
r1
0.5 1.0 1.5 2.0 2.5 3.0 3.5 4.0 4.5
0 2 4 6 8 10 12
d
2 = 0.5 d1
= 1.0 d1
= 2.0 d1
= 3.77 d1
%f
r,
1
0
shift
r2/r1
0 1 2 3 4 5 6 7
0 2 4 6 8 10 12
r2 = 0.65 r1
= 1.0 r1 = 2.15 r1 = 4.53
r1
% f
r,1
0
sh
ift
d
2/ d1
We have already shown in Fig 4 that the fr, 10 is shifted due to the application of dielectric cover. This is
explicitly observed in return loss characteristics (Fig.5). From this plot it is observed that fr, 10 gradually shifted
to the lower values with the increase of r2. The percentage shift in fr,10 for r2 = 1.5, 2.5, 3.2 and 5.0 are 2.8%,
3.8%, 5.5% and 10.8% respectively with respect to the patch without superstrate. Better impedance matching is occurred for higher values of r2.
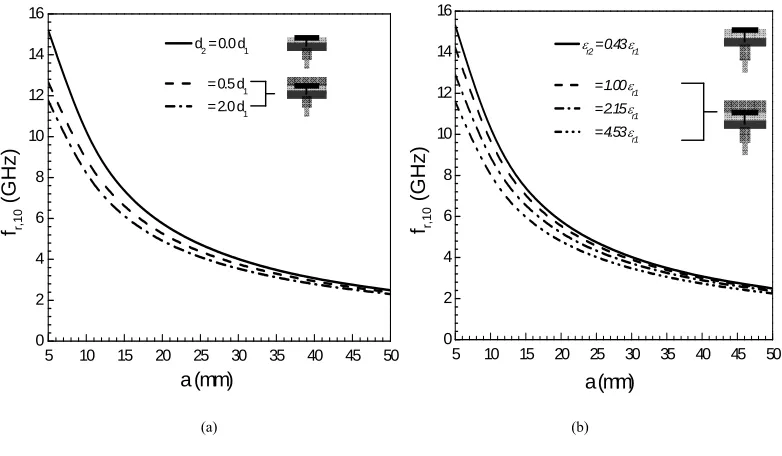
The variations of the dominant mode resonant frequencies (fr,10) of an ETPA as a function of side length (a)
with superstrate thickness (d2) are shown in Fig.6 (a). Figure 6 (b) demonstrates the variations of the fr, 10 of an
ETPA as a function of a with r2. From Fig. 6 it is evident that the higher is the value of d2 and r2, the more will
be the fr,10 shift for the particular value of a of the antenna. The fr,10 shifts due to d2 and r2 variations are more
prominent for the smaller values of a whereas for comparatively larger values of a this effects are insignificant.
Fig. 5. Simulated S11 of a dielectric loaded ETPA for different values of r2. a = 37 mm, d1 = 1.59 mm, d2 = 2.0 d1, r1 = 2.5, = 13.5 mm.
(a) (b)
Fig. 6. Computed fr, 10 versus a of an ETPA with dielectric loading for different values of d2 and r2. d1 = 1.59 mm, r1 = 2.32. (a) r2 = 4.53 r1 and d2 variable (b) d2 = 3.77 d1 and r2 variable.
2.50 2.75 3.00 3.25 3.50
-20 -16 -12 -8 -4 0
r2 = 0.4 r1
= 0.6 r1
= 1.0 r1
= 1.28 r1
= 2.0 r1 S11
(dB)
Frequency (GHz)
5 10 15 20 25 30 35 40 45 50
0 2 4 6 8 10 12 14 16
d
2 = 0.0 d1
= 0.5 d
1
= 2.0 d
1
fr,1
0
(G
Hz)
a (mm)
5 10 15 20 25 30 35 40 45 50
0 2 4 6 8 10 12 14 16
r2 = 0.43 r1
= 1.00 r1
= 2.15
r1
= 4.53 r1
fr,1
0
(GH
z)
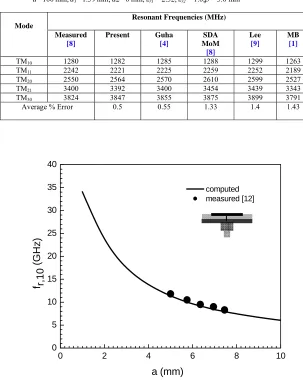
Our CAD model with superstrate is also valid for an equilateral triangular patch without superstrate. This is verified in table II for low value of r1. From this table one can infer that the present model is closer to the
experiment compared to the others. The present model without superstrate is further verified with other measured values [12] for high value of r1 (Fig. 7) and close agreement is revealed.
4. Conclusions
The effect of radome on resonant frequency is studied thoroughly. A very simple and accurate CAD model is proposed to predict the effect of superstrate on resonant frequencies of an ETPA. The computed values for wide range of superstrate parameters and patch sizes are compared with different theories and measured values available in open literature and reveals close agreement. The superiority of present model is that present model is also valid for a triangular patch without superstrate. This model is very much important to design a triangular patch with radome for practical implementation.
TABLE II
COMPARISON OF CALCULATED RESONANT FREQUENCIES OF AN EQUILATERAL TRIANGULAR PATCH ANTENNA AND MEASURED VALUES:
a=100mm,d1=1.59mm, d2=0mm,r1 = 2.32,r2 = 1.0, = 3.0 mm
Mode
Resonant Frequencies (MHz)
Measured
[8]
Present Guha
[4]
SDA MoM
[8]
Lee
[9]
MB
[1]
TM10 1280 1282 1285 1288 1299 1263
TM11 2242 2221 2225 2259 2252 2189
TM20 2550 2564 2570 2610 2599 2527
TM21 3400 3392 3400 3454 3439 3343
TM30 3824 3847 3855 3875 3899 3791
Average % Error 0.5 0.55 1.33 1.4 1.43
Fig. 7. Measured and computed dominant mode resonant frequency versus a of an ETPA without superstrate. d1 = 0.635 mm, r1 = 10.2.
0 2 4 6 8 10
0 5 10 15 20 25 30 35 40
f r,10
(GH
z
)
a (mm)
computed measured [12]
References
[1] Biswas, M.; Guha, D. (2009): Input impedance and resonance characteristic of superstrate loaded triangular microstrip patch, IET Microw. Antennas Propagat., 3, pp. 92 – 98.
[2] Sumantyo, J.T.S.; Ito, K.; Takahashi, M. (2005): Dual-band circularly polarized equilateral triangular-patch array antenna for mobile satellite communications, IEEE Trans. Antennas Propagat., 53(11), pp. 3477 – 3485.
[3] Hong J.-S.; Lancaster, M. J. (2004): Theory and experiment of dual-mode microstrip triangular patch resonators and filters, IEEE Trans. Microwave Theory Tech., 52(4), pp. 1237 – 1243.
[4] Guha, D.; Siddiqui, J.Y. (2004): Resonant frequency of equilateral triangular microstrip patch antenna with and without air gaps, IEEE Trans. Antennas Propagat., 52(8), pp. 2174-2177.
[5] Hong, C.-S. (1999): Gain – Enhanced Broadband Microstrip Antenna, Proc. Natl. Sci. Counc. ROC (A), 23(5), pp. 609- 611.
[6] Bernhard, J.T.; Tousignant, C.J. (1999): Resonant frequencies of rectangular microstrip antennas with flush and spaced dielectric superstrates, IEEE Trans. Antennas Propagat., 47(2), pp.302-307.
[7] Hassani, H. R.; Mirshekar Syahkal, D. (1992): Analysis of triangular patch antennas including radome effects, IEE Proceedings H,
139(3), pp.251-256.
[8] Chen, W.; Lee, K.F.; Dahele, J.S. (1992): Theoretical and experimental studies of the resonant frequencies of equilateral triangular microstrip antenna, IEEE Trans. Antennas Propagat., 40, pp.1253-1256.
[9] Lee, K. F.; Luk, K.M.; Dahele, J.S. (1988): Characteristics of the equilateral triangular patch antenna, IEEE Trans. Antennas Propagat., 36(11), pp.1510-1518.
[10]Karaboğa, D.; Güney, K.; Karaboğa, N.; Kaplan, A. (1997): Simple and accurate effective side length expression obtained by using a modified genetic algorithm for the resonant frequency of an equilateral triangular microstrip antenna, Int.J. Electron, 83, pp.99-108.
[11]Alexopoulos, N. G.; Jackson, D.R. (1984): Fundamental superstrate (cover) effects on printed circuit antennas, IEEE Trans.Antennas Propagat. , 32, pp.807-816.
[12]Sharma, A. K.; Bhat, B. (1982): Analysis of Triangular Microstrip Resonator, IEEE Trans. Microwave Theory Tech., 30(11), pp. 2029 – 2031.
[13]Helszajn, J.; James, D.S. (1978): Planar triangular resonators with magnetic walls, IEEE Trans. Microwave Theory Tech., MTT-26, pp.95-100.