University of New Hampshire
University of New Hampshire Scholars'
Repository
PREP Reports & Publications
Institute for the Study of Earth, Oceans, and Space
(EOS)
10-2015
Developing 2010 High-Resolution Impervious
Cover Estimates for Selected Towns in the
Piscataqua Region Estuaries Partnership: Final
Report
David Justice
University of New Hampshire - Main Campus, [email protected]
Fay A. Rubin
University of New Hampshire, Durham, [email protected]
Follow this and additional works at:
https://scholars.unh.edu/prep
This Report is brought to you for free and open access by the Institute for the Study of Earth, Oceans, and Space (EOS) at University of New Hampshire Scholars' Repository. It has been accepted for inclusion in PREP Reports & Publications by an authorized administrator of University of New Hampshire Scholars' Repository. For more information, please [email protected].
Recommended Citation
Justice, David and Rubin, Fay A., "Developing 2010 High-Resolution Impervious Cover Estimates for Selected Towns in the Piscataqua Region Estuaries Partnership: Final Report" (2015).PREP Reports & Publications. 394.
DEVELOPING 2010 HIGH-RESOLUTION IMPERVIOUS COVER ESTIMATES
FOR SELECTED TOWNS IN THE PISCATAQUA REGION ESTUARIES PARTNERSHIPA Final Report to
The Piscataqua Region Estuaries Partnership
Submitted by
David Justice and Fay Rubin Earth Systems Research Center
Institute for the Study of Earth, Oceans and Space Morse Hall
University of New Hampshire, Durham, NH 03824
October, 2015
This report was funded in part by a grant from the Piscataqua Region Estuaries Partnership as
Table of Contents
List of Tables ...2
List of Figures ...2
Acknowledgements ...2
Project Summary ...3
Methods ...3
Results ... 4
Discussion and Conclusions ... 4
References ... 15
List of Tables
Table 1. 2010 high-resolution impervious cover by town
Table 2. 2010 high-resolution impervious cover by subwatershed
Table 3. Comparison between high and medium-resolution impervious cover estimates for 2010
List of Figures
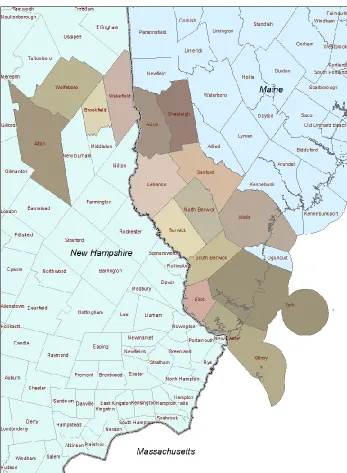
Figure 1. Project study area
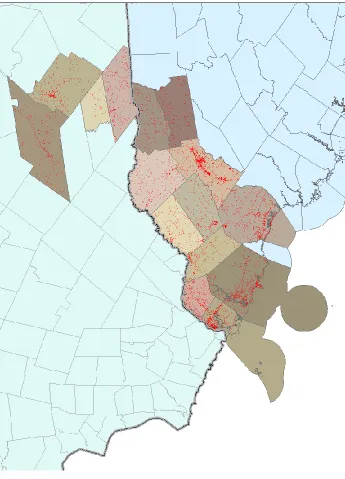
Figure 2. Overview of impervious cover mapping
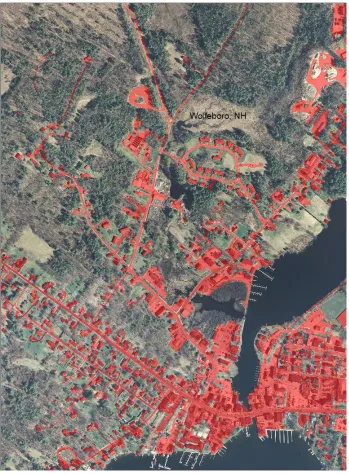
Figure 3. Large scale example of impervious cover features (in red) in the Wolfeboro, NH vicinity
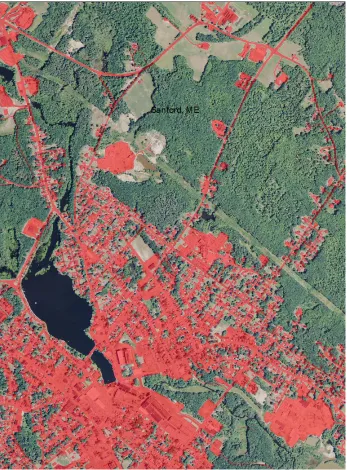
Figure 4. Large scale example of impervious cover features (in red) in the Sanford, ME vicinity
Figure 5. New development seen in 2014 NAIP orthophotography (Wolfeboro, NH)
Figure 6. New development seen in 2014 NAIP orthophotography (Alton, NH)
Acknowledgements
Project Summary
Estimates of 2010 impervious cover (New Hampshire) and 2011 impervious cover (Maine) were generated to extend the coverage of previous work in Rockingham and Strafford Counties, New
Hampshire, to include all of the Piscataqua Region Estuaries Partnership (PREP) footprint. The newly mapped area comprised the town of Alton in Belknap County, New Hampshire, the towns of
Brookfield, Wakefield, and Wolfeboro in Carroll County, New Hampshire, and the towns of Acton, Berwick, Eliot, Kittery, Lebanon, North Berwick, Sanford, Shapleigh, South Berwick, Wells, and York in York County, Maine1. With these new data, standardized, high resolution impervious cover
estimates are now available for the entire PREP watershed.
Impervious features covered 3,026 acres (2.7%) in the New Hampshire towns and 13,612 acres (4.9%) in the Maine towns, with a total of 16,637 (4.3%) acres mapped in the entire study area. As expected, the more urbanized towns of Kittery (11.3%), Sanford (7.9%), Eliot (7.0%), and York (6.2%) contained the highest percentage of impervious cover.
Methods
The impervious surface mapping was based on 2010 1-foot resolution orthophotography in New Hampshire and 2011 1-meter orthophotography in Maine. Both data sets were derived primarily by visually interpreting and manually digitizing impervious cover features from the source imagery mapped at a minimum scale of 1:1,000.
In New Hampshire, data development began by classifying the 2010 orthophotography using
eCognition image processing software in an attempt to capture the impervious cover. However, after reviewing the initial automated classification, it was determined that significant manual editing would be required to clean up the data. This was due in large part to the extensive amount of vegetation that partially obscured the underlying structures. As an alternative approach, road centerlines (NH
Department of Transportation, 2010) were used as a starting point for the impervious surface mapping. First, all roads in the study area towns were reviewed relative to the 2010 imagery and realigned as necessary. Second, the roads were buffered based on the width reported by NH DOT to generate the initial impervious surface polygons. Third, selected polygons from the automated classification were added where appropriate. Lastly, the remaining impervious surface features were manually digitized for the vast majority of the area.
In Maine, impervious surface data from the Maine GIS (megis.maine.gov) provided the starting point. The initial data set was derived from the published 2004 imperviousness data set (based on 5-meter SPOT imagery collected in the summer of 2004), and updated with the published 2003-2007 imperviousness change data set (based on 1-meter orthophotography acquired from 2001 through 2007). The data set was then manually updated using 2011 1-meter orthophotography from the National Agriculture Imagery Program (NAIP) to reflect 2011 ground conditions.
For both New Hampshire and Maine, the preliminary impervious surface features were subject to a second level of review and verification prior to being finalized.
1 The PREP footprint also includes very minor acreage within the town of Pittsfield in Merrimack County, New Hampshire.
It should be noted that these data were generated using slightly different methods from the 2010 high-resolution (HR) data generated for Rockingham and Strafford Counties in New Hampshire. While the base orthophotography is the same, the Rockingham and Strafford county data were generated using the automated classification/data clean-up approach and were reviewed and edited at a somewhat smaller scale (1:5000). Both HR approaches differ considerably from medium-resolution (MR) classifications used in past projects where 30-meter resolution Landsat Thematic Mapper (TM) and sub-pixel classification routines were used to generate estimates of impervious cover (see Justice and Rubin, 2006 and Justice and Rubin, 2003 for a complete processing description). As a result, the impervious cover percentages are significantly lower when compared to the results generated from the MR method. These differences are described in more detail below.
Results
The primary result of this project is an HR impervious cover data set for the towns of Alton, Brookfield, Wakefield, and Wolfeboro in New Hampshire, and the towns of Acton, Berwick, Eliot, Kittery, Lebanon, North Berwick, Sanford, Shapleigh, South Berwick, Wells, and York in Maine. Figure 1 shows the study area towns, while Figure 2 displays the impervious cover mapped within the study area.
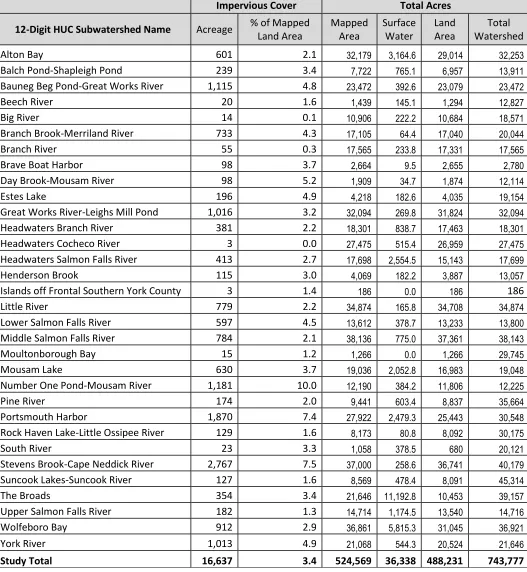
Tables 1 and 2 summarize the impervious cover by town and subwatershed. As expected, the seacoast towns of Maine along with Sanford contained the greatest amount of impervious cover. The percent impervious cover is as follows for these towns: Kittery (11.3%), Sanford (7.9%), Eliot (7.0%), and York (6.2%). The least amount was found in Brookfield, New Hampshire (0.8%) which is a very rural community. For the subwatersheds, the greatest percentages were found in the Number One Pond-Mousam River (10.0%), Stevens Brook-Cape Neddick River (7.5%), and Portsmouth Harbor (7.4%) units. The Headwaters Cocheco River contained 0% impervious cover while The Big River and Branch River subwatersheds were covered by a meager 0.1% and 0.3% percent impervious cover respectively.
Final deliverables for the project include three impervious surface shapefiles (Belknap County, NH (partial), Carroll County, NH (partial), and southern ME), with associated FGDC-compliant metadata. All NH products are available for download from NH GRANIT (www.granit.unh.edu).
Discussion and Conclusions
One of the key discoveries revealed in this project was the difference between impervious cover estimates generated by the HR and MR approaches. This is in part due to the significant difference in the resolution of the source data (1-foot vs. 30-meter, respectively), and in part due to the different processing methodologies used (screen interpretation vs. subpixel automated classification,
respectively). Table 3 shows a comparison of each method for the town level estimates and
demonstrates that the MR mapping predicts a far greater amount of impervious cover than does the HR mapping. In terms of percent coverage, the MR method estimated as much as 4.5% greater impervious surface coverage than the HR method (town of Kittery). Thus it appears that the MR approach overestimates impervious cover to a significant degree. However, it is important to recognize that the MR approach provides useful trend information that can be generated from readily available satellite imagery and in a more cost-effective manner than that of the HR method.
orthophoto data sources such as regularly acquired NAIP imagery (1 meter resolution) can be used as base data from which to delineate features. While these data are acquired during the summer months, it is expected that new development will be sufficiently apparent to allow for the impervious cover to be adequately captured. The large red arrows in Figures 5 and 6 point to examples of new
development (i.e. development since the 2010 date of this impervious mapping effort) exhibited in 2014 NAIP orthophotography for two areas in New Hampshire.
Finally, we note that attempts to automate impervious surface mapping using the eCognition
classification approach were to a significant degree constrained by the lack of high resolution LiDAR topographic data for the study area. If LiDAR data were available, important “decision rules” could be
Figure 5. New development seen in 2014 NAIP orthophotography (Wolfeboro, NH).
Table 1. 2010 high-resolution impervious cover by town.
State Town
Impervious Cover Total Acres
Acreage % of Land Area
Surface Water
Land
Area Total
Maine
Acton 743 3.1 2,146 24,262 26,408 Berwick 874 3.6 225 24,002 24,227 Eliot 881 7.0 1,041 12,609 13,650 Kittery 1,310 11.5 36,824 11,375 48,199 Lebanon 989 2.8 600 35,033 35,633 North Berwick 723 3.0 129 24,293 24,422 Sanford 2,417 7.9 621 30,584 31,205 Shapleigh 641 2.6 1,665 24,696 26,361 South Berwick 742 3.6 330 20,561 20,891 Wells 2,128 5.8 10,427 36,430 46,857 York 2,163 6.2 49,428 34,919 84,347
Total 13,612 4.9 103,436 278,764 382,200
New Hampshire
Alton 1,008 2.5 12,602 40,629 53,231 Brookfield 123 0.8 287 14,593 14,880 Wakefield 843 3.3 3,452 25,264 28,716 Wolfeboro 1,052 3.4 6,713 30,693 37,406
Total 3,026 2.7 23,054 111,179 134,233 Study Total 16,637 4.3 126,490 389,943 516,433
Table 2. 2010 high-resolution impervious cover by subwatershed.
Impervious Cover Total Acres
12-Digit HUC Subwatershed Name Acreage % of Mapped Land Area Mapped Area Surface Water Land Area Total Watershed Alton Bay 601 2.1 32,179 3,164.6 29,014 32,253
Balch Pond-Shapleigh Pond 239 3.4 7,722 765.1 6,957 13,911
Bauneg Beg Pond-Great Works River 1,115 4.8 23,472 392.6 23,079 23,472
Beech River 20 1.6 1,439 145.1 1,294 12,827
Big River 14 0.1 10,906 222.2 10,684 18,571
Branch Brook-Merriland River 733 4.3 17,105 64.4 17,040 20,044
Branch River 55 0.3 17,565 233.8 17,331 17,565
Brave Boat Harbor 98 3.7 2,664 9.5 2,655 2,780
Day Brook-Mousam River 98 5.2 1,909 34.7 1,874 12,114
Estes Lake 196 4.9 4,218 182.6 4,035 19,154
Great Works River-Leighs Mill Pond 1,016 3.2 32,094 269.8 31,824 32,094
Headwaters Branch River 381 2.2 18,301 838.7 17,463 18,301
Headwaters Cocheco River 3 0.0 27,475 515.4 26,959 27,475
Headwaters Salmon Falls River 413 2.7 17,698 2,554.5 15,143 17,699
Henderson Brook 115 3.0 4,069 182.2 3,887 13,057
Islands off Frontal Southern York County 3 1.4 186 0.0 186 186 Little River 779 2.2 34,874 165.8 34,708 34,874
Lower Salmon Falls River 597 4.5 13,612 378.7 13,233 13,800
Middle Salmon Falls River 784 2.1 38,136 775.0 37,361 38,143
Moultonborough Bay 15 1.2 1,266 0.0 1,266 29,745
Mousam Lake 630 3.7 19,036 2,052.8 16,983 19,048
Number One Pond-Mousam River 1,181 10.0 12,190 384.2 11,806 12,225
Pine River 174 2.0 9,441 603.4 8,837 35,664
Portsmouth Harbor 1,870 7.4 27,922 2,479.3 25,443 30,548
Rock Haven Lake-Little Ossipee River 129 1.6 8,173 80.8 8,092 30,175
South River 23 3.3 1,058 378.5 680 20,121
Stevens Brook-Cape Neddick River 2,767 7.5 37,000 258.6 36,741 40,179
Suncook Lakes-Suncook River 127 1.6 8,569 478.4 8,091 45,314
The Broads 354 3.4 21,646 11,192.8 10,453 39,157
Upper Salmon Falls River 182 1.3 14,714 1,174.5 13,540 14,716
Wolfeboro Bay 912 2.9 36,861 5,815.3 31,045 36,921
Table 3. Comparison between high and medium-resolution impervious cover estimates for 2010.
State Town
2010 High-Resolution Impervious Cover
2010 Medium-Resolution Impervious Cover Estimates1
Acreage % of Land Area Acreage % of Land Area
Maine
Acton 743 3.1 910 3.8
Berwick 874 3.6 1,624 6.8
Eliot 881 7.0 1,415 11.2
Kittery 1,310 11.5 1,822 16.0
Lebanon 989 2.8 1,645 4.7
North Berwick 723 3.0 1,266 5.2
Sanford 2,417 7.9 3,582 11.7
Shapleigh 641 2.6 923 3.7
South Berwick 742 3.6 1,207 5.9
Wells 2,128 5.8 3,246 8.9
York 2,163 6.2 3,461 9.9
Total 13,612 4.9 21,101 7.6
New Hampshire
Alton 1,008 2.5 1,918 4.7
Brookfield 123 0.8 268 1.8
Wakefield 843 3.3 1,879 7.4
Wolfeboro 1,052 3.4 1,871 6.1
Total 3,026 2.7 5,936 5.3
Study Total 16,637 4.3 27,037 6.9
1Impervious cover estimates for the medium-resolution study are taken from mid range (see Justice and Rubin,