INTERNATIONAL RESEARCH JOURNAL OF PHARMACY
www.irjponline.com
ISSN 2230 – 8407
Research Article
COMPARISON STUDY BETWEEN HPLC AND UHPLC METHODS FOR TESTING THE LEVEL
OF AMINO ACID
Insan Sunan Kurniawansyah
1,2*, Maria Paramita O.
1, Budi Prasaja
3 1Faculty of Pharmacy, Universitas Padjadjaran, Sumedang, Indonesia
2
PUSDI Drug Delivery and Drug Disposition, Universitas Padjadjaran, Indonesia
3PT. Novell Pharmaceutical Laboratories, Jakarta, Indonesia
*Corresponding Author Email: [email protected]
Article Received on: 11/06/18 Approved for publication: 29/06/18
DOI: 10.7897/2230-8407.096100
ABSTRACT
Fitamino product from PT. Novell Pharmaceutical is a product formulated in powder form. This product contains a variety of vitamins and amino acids that aim to meet the nutritional needs of consumers for 12 h. Amino acids contained in the product are Branched Chain Amino Acid (BCAA) consisting of isoleucine, leucine, valine and taurine. In this study, the measurement of amino acid levels was done using different instruments. The instruments used were HPLC (High Performance Liquid Chromatography) and UHPLC (Ultra High Performance Liquid Chromatography). The research was done on preparation stage of test sample and test of sample rate using HPLC and UHPLC. The difference between these two methods lied in the derivatisation process. In HPLC, derivatization process was done manually while in UHPLC derivatization, process was done automatically in UHPLC machine. The results of the test showed that the amino acid content tested by HPLC method was greater than the amino acid level tested by UHPLC method that were: taurin 102.2%; valine 102.6%; isoleucine 95.72%; and leucine 101.79% while in UHPLC method: taurine 79.164%; valine 67.763; isoleucine 67.569%; and leucine 72.107%. The results on this UHPLC method were well below the 85-115% requirement. That was because there were different treatments during the test sample preparation process but the time required for the process to use UHPLC was faster than the HPLC method.
Keywords: Amino Acid, Branched Chain Amino Acid, Fitamino, HPLC, Novell Pharmaceutical, Taurine, UHPLC.
INTRODUCTION
Nutrition is a chemical bond required by the body to perform its functions, which produce energy, build and maintain tissues, and regulate the processes of life. This proves that nutrition is a component that is needed by humans in their daily activities. Every human activity requires energy, both in small quantities and in large quantities. Therefore, PT.Novell Pharmaceutical Laboratories has the idea to design a beverage supplement that provides nutritional fulfillment for its consumers for 12 h after drinking it. This drink contains various vitamins and amino acids. This product is named Fitamino in the form of powder and has a taste of chocolate.
Fitamino is formulated in such a way as to meet the nutritional needs of consumers for 12 h. Therefore, testing of both vitamin and amino acids should be tested. This test is needed to ensure that the formulation has been designed in accordance with the products made in order to meet the nutritional needs of consumers for 12 h.
Amino acid
The structure of amino acids comprises an amino group, a carboxyl group, amino group, and an R group bound to an atom C known as a carbon α. Cluster R is a branch chain that distinguishes an amino acid with other amino acids. Amino acids in neutral conditions (pH isoelectric) are in the form of bipolar ions (zwitter ion). In bipolar amino acids, amino groups get additional protons and dissociated carboxyl groups1. Amino acids
are divided into two groups, namely essential amino acids and
non-essential amino acids. Essential amino acids are amino acids that cannot be produced in the body so they must be added in the form of food, while non-essential amino acids are the amino acids that can be produced in the body2.
Branched Chain Amino Acids (BCAA)
Branched Chain Amino Acid consists of leucine, isoleucine and valine is an amino acid that is metabolized in the muscle. In muscle, BCAA serves as an important energy substrate during exercise and stress periods, besides BCAA also acts as a precursor for the synthesis of amino acids and proteins3.
BCAA is a contributor of 35-40% essential amino acid diet in the body protein and 14-18% of the total amino acid in muscle protein in which the human muscle mass is 40% of body weight4.
Muscle proteins have a constant condition, where new proteins will continue to be produced while older proteins will be degraded. However, the new protein synthesis rate will be greater than the level of muscle protein damage. Consumption of supplements containing BCAA can maximize this condition in which BCAA can stimulate muscle protein synthesis5.
Taurine
Taurine (2-aminoethanesulfonic acid) is a sulfur-containing amino acid that plays a role in several metabolic processes such as cardiac contraction and antioxidant activity6. The presence of
1.5 which makes taurine the most acidic amino acid. Taurine does not have the carboxyl groups necessary to form peptide bonds so it does not function as a builder of protein structures. Taurine is indispensable during growth and can be found in pure milk, eggs, meat, and fish, as well as food or beverage supplement products. Taurine is formed by the body in the liver followed by the oxidation reaction of the amino acid decarboxylation7.
Taurine serves to maintain the balance of membrane cells in active tissues such as brain tissue and heart8. In addition, taurine
also plays a role in several biological processes such as development of central nervous system (CNS) and retina, membrane stabilization, reproduction and immune system9.
Taurine is an amino acid that does not belong to proteins. Taurine is most prevalent in the brain, retina, muscle tissue, and organs throughout the body10.
MATERIALS AND METHODS
Fitamino 1000 mg containing L-Valine, L-Isoleucine, L-Leucine, and Taurine; acetate buffer pH 7.0 (MERCK); NaOH 10 N (MERCK); Borat buffer pH 9.5 (MERCK); Acetic Acid 2% (MERCK); OPA solution (O-Phthaldehyde) (MERCK); Reagent OPA (O-Phthaldehyde) (MERCK); Motion Phase (Methanol: Acetate Buffer pH 7.0); Aspartate Acid (MERCK) solution (as an internal standard solution). .
Preparation of Standard Solutions
Weighed working standard L-Valin for: Standard 80%: 20 mg
Standard 100%: 25 mg Standard 120%: 30 mg
Weighed working standard L-Isoleucine for: Standard 80%: 20 mg
Standard 100%: 25 mg Standard 120%: 30 mg
Weighed working standard L-Leucine for: Standard 80%: 40 mg
Standard 100%: 50 mg Standard 120%: 60 mg
Weighed working standard L-Taurin for: 80% Standard: 80 mg
Standard 100%: 100 mg Standard 120%: 120 mg
Each standard was put into a 100 mL measuring flask and dissolved with water and marked up with water until 100 mL.
Preparation of Test Solutions
Weighed 5 sachet Sustained Release Nutrition 12 h. The powder was carefully weighed equal to 1.9 g of sample and then put into a 50 mL measuring flask. After that, 25 mL of solvent was added, then sonicated and vortex. The solution was diluted with water until the marks were then centrifuged and filtered.
A. Examination Levels using HPLC • Sample Preparation
The sample was dissolved with hot water. • Derivatization
A total of 20 µL internal standard and 100 µL borate buffer
- HPLC condition
Column: Purospher®, RP-18e, 5µm, 250mm x 4.6mm Phase of motion: Phase of motion
Detector: 338 nm Flow rate: 2.0 mL / min Input Volume: 10 mL Column Temperature: 400C
B. Examination Levels using UHPLC • Sample Preparation
The sample was dissolved with plain water. • Derivatization
Into a vial was loaded water of 10 µL, 5 µL borate buffer, 1 µL sample solution. The vial was then inserted into the tool and mixed in the injector 3 times (6 µL each) and awaited for 15 sec. Injector washed. The OPA / MPA reagent solution was inserted into the vial and mixed back into the injector 6 times (each 7 µL and awaited for 15 seconds) The injector was washed Inserting the FMOC solution into the vial and mixed in the injector 6 times (each 8 µL) and then waited for 15 sec. Injector washed and diluent inserted and mixed in injector 4 times (12 µL each) and awaited for 15 sec. Conducted a process of mocking and starting data calculation After the injector was emptied and washed with buffer loop.
RESULTS AND DISCUSSION
The results of analysis of amino acid levels using HPLC are shown in Table 1 to 8. The results of analysis of amino acid levels using UHPLC are shown in Table 9.
In this study, examination of amino acid levels was performed by using two different instruments. It aim was to analyze the effect of UHPLC usage on the effectiveness of work. The HPLC method was chosen because it has many advantages over the classical liquid chromatography method, such as being able to separate the molecules from a mixture, its execution is easy, the speed of analysis and high sensitivity, the resolution is good, can use various detectors, the columns that have been used can reused, and can avoid material damage11.
The first step was to make standard solution and test solution. Standard solution and test solution were prepared by dissolving the substance with the solvent ie water. However, for test solution, testing was done using HPLC; the solvent used was hot water while in experiments using UHPLC, the solvent used was plain water. The second stage was process of derivatization. The process of derivatization was done so that amino acids could form derivatives that absorbed UV light, visible, or fluorescence. The compound used for derivatisation in this procedure was the O-phthalaldehyde reagent. This reagent could form an iso-indole derivate with amino acids. This iso-indole derivative strongly fluoresce so it can be detected by a fluorescence detector12. The
Table 1. Result of Taurine Standard Level Examination Weight
(mg)
Conc. (ppm)
Area IS Ratio Mean Area Mean Area SD CV (%)
100 1000 801380 373115 2.148 2.148 2.142 0.01 0.49
801380 373115 2.148 801380 373115 2.148 801380 373115 2.148 801380 373115 2.148 801380 373115 2.148
100.03 1000.03 869569 409212 2.125 2.125
869569 409212 2.125
Table 2. Result of Taurine Sample Level Examination Sample Area IS Ratio Assay (%) Mean Assay
(%)
SD CV Req.
1 808340 400056 2.021 94.33 102.2 11.14 10.00 85% - 115% CV
≤ 5%
2 895654 379821 2.358 110.08
Table 3. Valine Standard Level Examination Result
Weight (mg) Conc. (ppm) Area IS Ratio Mean Area Mean Area SD CV (%)
25.02 250.2 232662 373115 0.624 0.624 0.621 0.01 0.88
232662 373115 0.624
232662 373115 0.624
232662 373115 0.624
232662 373115 0.624
232662 373115 0.624
25.01 250.01 250309 409212 0.612 0.612
250309 409212 0.612
Table 4. Examination Result of Valid Samples Sample Area IS Ratio Assay (%) Mean Assay
(%)
SD CV Req.
1 236647 400056 0.592 95.32 102.6 10.3 10.04 85% - 115% CV ≤
5%
2 236647 379821 0.582 109.89
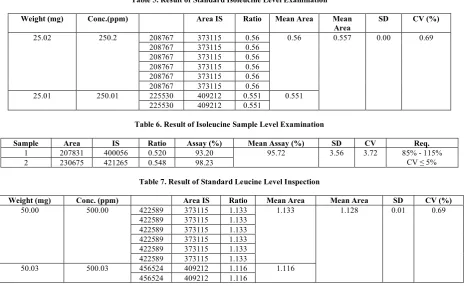
Table 5. Result of Standard Isoleucine Level Examination Weight (mg) Conc.(ppm) Area IS Ratio Mean Area Mean
Area
SD CV (%)
25.02 250.2 208767 373115 0.56 0.56 0.557 0.00 0.69
208767 373115 0.56
208767 373115 0.56
208767 373115 0.56
208767 373115 0.56
208767 373115 0.56
25.01 250.01 225530 409212 0.551 0.551
225530 409212 0.551
Table 6. Result of Isoleucine Sample Level Examination
Sample Area IS Ratio Assay (%) Mean Assay (%) SD CV Req.
1 207831 400056 0.520 93.20 95.72 3.56 3.72 85% - 115%
CV ≤ 5%
2 230675 421265 0.548 98.23
Table 7. Result of Standard Leucine Level Inspection
Weight (mg) Conc. (ppm) Area IS Ratio Mean Area Mean Area SD CV (%)
50.00 500.00 422589 373115 1.133 1.133 1.128 0.01 0.69
422589 373115 1.133
422589 373115 1.133
422589 373115 1.133
422589 373115 1.133
422589 373115 1.133
50.03 500.03 456524 409212 1.116 1.116
Table 8. Result of Leucine Sample Level Examination
Sample Area IS Ratio Assay (%) Mean Assay (%) SD CV Req.
1 424584 400056 1.061 94.06 101.79 10.93 10.74 85% - 115%
CV ≤ 5%
2 469343 379821 1.236 109.51
Table 9. Examination Result of Taurine, Valine, Isoleucine and Leucine Samples using UHPLC
Ingredients Conc. (%) Req.
Taurine 72.071 Mean 79.164 90-110%
76.399 SD 4.922
80.577 RSD 6.217 5%
84.182 82.594
Valine 67.681 Mean 67.763 85-115%
65.098 SD 2.969
72.810 RSD 4.382 5%
66.483 66.741
Isoleucine 63.176 Mean 67.569 85-115%
66.156 SD 3.597
73.039 RSD 5.323 5%
68.225 67.250
Leucine 68.061 Mean 72.107 85-115%
69.755 SD 4.167
78.822 RSD 5.772 5%
73.009 70.890
Based on test results using HPLC, obtained results were: taurine content of 102.20%; valin content of 102.60%; isoleucine levels of 95.72%; and leucine level of 101.79%. These results have been eligible at 85-115% with duration of about 30 min. Meanwhile, the test results obtained using UHPLC were taurine content of 79.64%; valine content of 67.76%; isoleucine content of 67.57%; and leucine level of 72.11%. The results were not yet eligible at 85-115% with a long working time of about 20 min. The test results using UHPLC were not yet qualified because of the difference of solvent used. In the test using HPLC, the sample was dissolved in hot water while in the test using UHPLC, the sample was dissolved with plain water. In previous experiments, the test using HPLC method also used a regular water solvent but the results obtained were small. So, there was a possibility of differences in results obtained, not due to differences of tools were used, but caused of differences of solvent.
Amino acids present in the sample were coated with carnauba wax and dehydrated palm oil. Carnauba wax has an 80-850C
melting point. This may cause the possibility of amino acids in the sample not completely dislodged from the coating hence causing a decrease in the levels obtained in the test using UHPLC. However, in terms of time utilization and effectiveness, the UHPLC method was found to be more practical and less likely method for errors because the derivatization process was done automatically with the machine.
CONCLUSION
Levels of amino acids in Fitamino based on test results obtained using HPLC were: taurine levels of 102.20%; valine content of 102.60%; isoleucine levels of 95.72%; and leucine level of 101.79%. Levels of amino acids in Fitamino based on test results obtained using UHPLC were taurine content of 79.64%; valine content of 67.76%; isoleucine content of 67.57%; and leucine level of 72.11%.
UHPLC method was found to be more practical method and very small possibility for error due to automatic derivatization process in machine.
REFERENCES
1. Winarno FG. Food Chemistry and Gizi: New Ed. Jakarta. Gramedia Pustaka Utama. 2008.
2. Akram M, Asif HM, Uzair M, Akhtar N, Madni A, Shah SMA, Hasan Z, Ullah A. Amino Acid : A review Article. Journal of Medicinal Plants Research 2011;5(17): 3997-4000.
3. Sowers, Starkie. A Primer On Branched Chain Amino Acids. Huntington College of Health Sciences. 2009.
4. Shimomura, Yoshiharu. Nutraceutical Effects if Branched-Chain Amino Acids on Skeletal Muscle. American Society of Nutrition. 2006. Available download at: http://jn.nutrition.org/
5. Wolfe, Robert R. Branched–chain amino acids and muscle protein synthesis in humans: myth or reality? USA: Journal of the International Society of Sports Nutrition. 2017. 6. Williams, Melvin. 2005. Dietary Supplements and Sports
Performance: Amino Acid. Journal of the International Society of Sports Nutrition.
7. Eilertsen KE, Larsen R, Mæhre HK, Jensen IJ, Elvevoll EO. Anticholesterolemic and Antiatherogenic Effects of Taurine Supplementation is Model Dependent. Norway: University of Tromsø. 2012.
8. Patel RP, Patel MP, Suthar AM. Spray drying technology. Indian Journal of Science and Technology 2006;2(10):44-47 9. Georgia B, Levis S, Park E. Taurine New Implications for an
old amino acid. Journal Elsevier FEMS Microbiology Letters 2003;226:195-202.
12.Wheler GHT and JT. Russel. Separation and Quantitation of o-Phtalaldehyde Derivatives of Taurine and Related Compound in a High Performance Liquid Chromatography (HPLC) System. J. Liq. Chromatog 1981;4(7):l28r-1291.
Cite this article as:
Insan Sunan Kurniawansyah et al. comparison study between HPLC and UHPLC methods for testing the level of amino acid. Int. Res. J. Pharm. 2018;9(6):113-117 http://dx.doi.org/ 10.7897/2230-8407.096100
Source of support: Nil, Conflict of interest: None Declared