R E S E A R C H
Open Access
Modeling left ventricular diastolic dysfunction:
classification and key in dicators
Chuan Luo
1, Deepa Ramachandran
1, David L Ware
2, Tony S Ma
3,4and John W Clark Jr
1** Correspondence: [email protected] 1
Dept. Electrical and Computer Engineering, Rice University, Houston, TX 77005, USA Full list of author information is available at the end of the article
Abstract
Background:Mathematical modeling can be employed to overcome the practical difficulty of isolating the mechanisms responsible for clinical heart failure in the setting of normal left ventricular ejection fraction (HFNEF). In a human cardiovascular respiratory system (H-CRS) model we introduce three cases of left ventricular diastolic dysfunction (LVDD): (1) impaired left ventricular active relaxation (IR-type); (2)
increased passive stiffness (restrictive or R-type); and (3) the combination of both (pseudo-normal or PN-type), to produce HFNEF. The effects of increasing systolic contractility are also considered. Model results showing ensuing heart failure and mechanisms involved are reported.
Methods:We employ our previously described H-CRS model with modified pulmonary compliances to better mimic normal pulmonary blood distribution. Itype is modeled by changing the activation function of the left ventricle (LV), and R-type by increasing diastolic stiffness of the LV wall and septum. A 5th-order Cash-Karp Runge-Kutta numerical integration method solves the model differential equations.
Results:IR-type and R-type decrease LV stroke volume, cardiac output, ejection fraction (EF), and mean systemic arterial pressure. Heart rate, pulmonary pressures, pulmonary volumes, and pulmonary and systemic arterial-venous O2and CO2 differences increase. IR-type decreases, but R-type increases the mitral E/A ratio. PN-type produces the well-described, pseudo-normal mitral inflow pattern. All three types of LVDD reduce right ventricular (RV) and LV EF, but the latter remains normal or near normal. Simulations show reduced EF is partly restored by an accompanying increase in systolic stiffness, a compensatory mechanism that may lead clinicians to miss the presence of HF if they only consider LVEF and other indices of LV function. Simulations using the H-CRS model indicate that changes in RV function might well be diagnostic. This study also highlights the importance of septal mechanics in LVDD.
Conclusion:The model demonstrates that abnormal LV diastolic performance alone can result in decreased LV and RV systolic performance, not previously appreciated, and contribute to the clinical syndrome of HF. Furthermore, alterations of RV diastolic performance are present and may be a hallmark of LV diastolic parameter changes that can be used for better clinical recognition of LV diastolic heart disease.
Background
Frequently, heart failure symptoms occur in the presence of a normal left ventricular ejection fraction (HFNEF), however, some do not regard “diastolic heart failure” as synonymous with HFNEF, because diastolic abnormalities alone may not fully explain the phenomenon [1,2]. The cause, proper assessment, and very name of this syndrome have been debated. This controversy requires broadened investigation to improve treat-ments for the disease. Certainly the interaction of all possible causes makes it very dif-ficult in practice to determine the extent to which any one might be responsible. Zile et al. [3] have reported that patients with clinical diastolic heart failure have demon-strable abnormalities of left ventricular (LV) active relaxation and passive stiffness. This modeling paper tries to demonstrate that: (1) the reverse is true; that by selec-tively altering the active relaxation and passive stiffness parameters of the septum and LV free wall, clinical parameters of different diastolic HF are produced by model simu-lation; (2) by combining alterations of active relaxation and passive stiffness para-meters, a phenotype is produced which parallels the pseudonormal diastolic HF; (3) LVEF is normal when increased LV systolic contractility is considered; and (4) by ana-lyzing this modeling exercise, new diagnostic clinical parameters of diastolic heart dis-ease are classified and proposed. This study aims to shed light on one of the many causes of HFNEF, that of left ventricular diastolic dysfunction (LVDD).
Mathematical models help by predicting the hemodynamic, pulmonary, and neural responses to isolated changes in each parameter under investigation. Our group has developed a detailed human cardiovascular respiratory system model (H-CRS) [4-8] that reproduces normal and abnormal hemodynamic, respiratory, and neural physiology. Although the model is comparatively complex [8,9] it provides a very comprehensive and integrated explanation of cardiovascular and respiratory events, such as thigh-cuff and carotid occlusion [6], the Valsalva maneuver [4], the pumping action of the interven-tricular septum [8], and atrioveninterven-tricular and interveninterven-tricular interactions in cardiac tam-ponade [11]. The model has been fit to pooled systemic and pulmonary arterial impedance data [12,13] and its echocardiographic flow and pressure measurements agree well with those of normal humans [7]. Comparing model predictions with echocardio-graphic findings and key indices in patients with HFNEF might help to explain which, or to what extent each of the possible abnormalities is responsible for the disease.
Methods
H-CRS Model
The instantaneous pressure (mmHg) within either left or right ventricular free wall (LVF or RVF) volume (VLVF and VRVF) (ml) is the weighted sum of pressure during diastole and systole [6]:
PLVF(VLVF,t)≡eLVF(t) PLV,ES(VLVF)
+ (1−eLVF(t)) PLV,ED(VLVF)
PRVF(VRVF,t)≡eRVF(t) PRV,ES(VRVF)
+ (1−eRVF(t)) PRV,ED(VLVF)
(1)
where
PLV,ES(VLVF)≡α(Fcon) ELV,ES(VLVF−VLVF,d)
PRV,ES(VRVF)≡α(Fcon) ERV,ES(VRVF−VRVF,d)
(2)
and
PLV,ED(VLVF)≡PLV,0(eλLV(VLVF−VLVF,0)−1)
PRV,ED(VRVF)≡PRV,0(eλRV(VRVF−VRVF,0)−1)
(3)
Since both free wall pressures (PLVF, PRVF) are transmural (differential) pressures with reference to pericardial pressure (PPERI), the absolute chamber pressures PLVand PRV(relative to atmosphere) are equivalent to the respective free wall transmural pres-sure plus PPERI.
The trans-septal pressure difference (mmHg) is:
PSPT(VLVF,VRVF,t) = PLVF(VLVF,t)−PRVF(VRVF,t) (4)
Septal volume (VSPT), or the volume that is traversed by the septum, is calculated from the difference in the two free wall pressures, and is the weighted sum of diastolic and systolic contributions.
If PSPT≥0,
VSPT,ES(PSPT)≡
1 ESPT,ES
PSPT+ VSPT,d
VSPT,ED(PSPT)≡
1
λSPT
log
PSPT
PSPT,0
+ 1
+ VSPT,0
(5)
If PSPT< 0,
VSPT,ES(PSPT)≡
1 ESPT,ES
PSPT+ VSPT,d
VSPT,ED(PSPT)≡ −
1
λSPT
log
−P
SPT
PSPT,0
+ 1
+ VSPT,0
(6)
Septal volume is then the weighted sum of septal volume in systole and diastole:
VSPT(PSPT,t)≡eSPT(t) VSPT,ES(PSPT)
+ (1−eSPT(t)) VSPT,ED(PSPT)
(7)
volumes are defined in Figure 1A, and 1C-D. Total left ventricular volume (VLV) and right ventricular volume (VRV) are defined as:
VLV= VLVF+ VSPT
VRV= VRVF−VSPT
(8)
In these equations ex(t) is the dimensionless weight or“activation function,”denoting myocardial activation as between 0 and 1, where x = LVF, RVF, or SPT. Ventricular mechanics is described by separate mechanical and temporal behavior - mechanical behavior by static free wall pressure-volume characteristics and temporal behavior by ex(t) functions. Thus, the equations for {PLV,ES, PRV,ES} and {PLV,ED, PRV,ED} describe the static ESPVR and EDPVR relationships for the ventricular free walls. Here {VLVF,d, VRVF,d, VSPT,d} and {VLVF,0, VRVF,0, VSPT,0} are the zero-pressure volumes for the systo-lic and diastosysto-lic pressure relationships, respectively, whereas the elastance terms {ELVF,
ES, ERVF,ES, ESPT,ES} characterize the slopes of linear end-systolic P-V relationships of the LVF and RVF and septum (mmHg/ml). The function a(Fcon) is a dimensionless neural control factor; {lLV,lRV,lSPT} are stiffness parameters associated with the pas-sive diastolic pressure relationships (ml-1); and {PLVF,0, PRVF,0, PSPT,0} are the nominal diastolic pressures for the LVF, RVF and septum.
We model both free walls and septum as undergoing independent activation; thus each has its own activation function ex(t). Baseline or“control”simulations are those
which model normal physiology, and for these we used the activation functions that reproduced normal ventricular pressure tracings.
The solution procedure begins with estimated values for VSPT, VLV, and VRV, and we iterate as follows:
Step 1: VLVF = VLV- VSPT
VRVF= VRV + VSPT
Step 2: Calculate PLVFand PRVF(Eqn. 1) using the free wall components of Eqns. 2-3.
Step 3: Calculate PSPTaccording to Eqn. 4.
Step 4: Repeatedly solve for VSPT (Eqn. 7) until the septal components of Eqns. 5-6 converge (about 12 iterations).
Step 5: Compute the chamber volumes VLVand VRV(Eqn. 8), which serve as state variables.
Elastance functions representing the time-varying stiffness of the storage compart-ments are evaluated using the equations given below:
ELVF(VLVF,t)≡
PLVF(VLVF,t)−PPERI
VLVF(t)−VLVF,d
PLVF(VLVF,t) = PLV−PPERI
ERVF(VRVF,t)≡
PRV(VRVF,t)−PPERI
VRVF(t)−VRVF,d
PRVF(VRVF,t) = PRV−PPERI
ESPT(VSPT,t)≡
PLVF(VLVF,t)−PRVF(VRVF,t)
VSPT(t)−VSPT,d
PLVF(VLVF,t)−PRVF(VRVF,t) = PLV−PRV
(9)
In addition to increasing ventricular contractility, the baroreflex decreases vagal and increases sympathetic efferent discharge frequency to the sinus node and the peripheral vasculature, increasing heart rate and vasomotor tone.
Modeling LVDD
LVDD refers to an abnormality in left ventricle’s ability to fill during diastole. Diastole is that portion of the cardiac cycle concerned with active relaxation of the ventricle fol-lowed by mitral valve opening, ventricular filling, late atrial contraction and mitral valve closure, which signals the end of the diastolic period. Conventional Doppler echocardiographic techniques for measuring mitral flow velocity have yielded flow pat-terns characteristic of at least two distinct types of LVDD (impaired relaxation (IR) and restrictive (R)). Our modeling approach suggests that a third type of Doppler flow pattern called the pseudo-normal (PN) pattern can be represented simply as a weighted combination of the two basic flow patterns (IR and R). Analysis of these different flow patterns have contributed to a preliminary classification of LVDD.
concerned with LV mechanics are changed to produce mitral flow patterns consistent with the three patterns observed in IR-type, R-type, and PN-type LVDD. Thus, three sets of parameter changes were used to generate three different LV models, which were subsequently inserted into the LV compartment of the H-CRS model for testing. Hemo-dynamic waveforms generated by each of these LV mechanics characterizations were subsequently compared with normal human control waveforms and those generated by the other LV models. The specific modeling mechanisms used to characterize the differ-ent LVDD mitral valve patterns are discussed below. The LVDD models are chosen such that they produce typical mitral flow patterns characteristic of the LVDD type, and such that the severity of LVDD produced increases in order IR-type®R-type®PN-type.
IR-type
The generic activation function ex(t) associated with Eqns. (1) and (7) above is
charac-terized by a sum of Gaussian functions Ae
−(t−C
B )
2
with amplitude A, width B, and
offset C. It varies between 0 and 1, increasing during systole and falling during diastole. End-systole occurs at the peak of or just after the peak of the ex(t) curve, and its declining limb drives the dynamics of LV ventricular pressure during isovolumic relaxation. Ideally this phase is nearly complete when the AV (mitral and tricuspid) valves open. Impaired relaxationof the LV is a condition that prolongs isovolumic relaxation time resulting in delayed mitral valve opening, elevated LV filling pressure, and reduced mitral flow and end-diastolic volume. To better characterize this flow pat-tern we increased parameter B in the last Gaussian term for the LVF and septal activa-tion funcactiva-tions from 40 (control) to 350 ms (Table 1). This required adjusting the last two Gaussian terms to normalize ex(t) to 1. As a result, LVF relaxation is delayed, the LV end-diastolic pressure-volume relation (EDPVR) has an increased slope and shifts upward and to the left relative to its control curve, and ex(t) has a non-zero positive offset at end-diastole. Thus, modeling IR-type requires modifying specific parameters associated with the activation functions of the LVF and septum.
R-type
The restrictive flow velocity pattern seen in LVDD reflects increased passive wall stiff-ness of the LVF and septum. In this pattern, the EDPVR has an increased slope relative to its control, end-diastolic volume is reduced and end-diastolic pressure is increased substantially which strongly reduces mitral flow. The effects of increased LV passive wall stiffness were simulated by increasing the diastolic stiffness parameter lLVfrom 0.025 to 0.05/ml and lSPTfrom 0.05 to 0.1/ml. Thus, modeling R-type LVDD modifies specific parameters associated with the passive stiffness of the LVF and septum, in
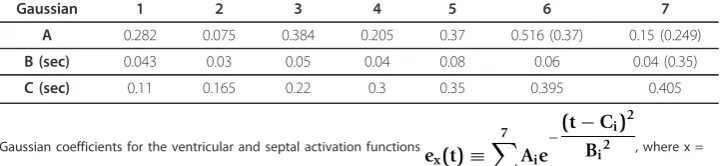
Table 1 Gaussian Coefficients for Ventricular and Septal Activation Functions
Gaussian 1 2 3 4 5 6 7
A 0.282 0.075 0.384 0.205 0.37 0.516 (0.37) 0.15 (0.249)
B (sec) 0.043 0.03 0.05 0.04 0.08 0.06 0.04 (0.35)
C (sec) 0.11 0.165 0.22 0.3 0.35 0.395 0.405
Gaussian coefficients for the ventricular and septal activation functions
ex(t)≡ 7
i=1
Aie
−(t−Ci) 2
Bi2 , where x =
{LVF, RVF, SPT}. The ex(t) coefficient values for the free walls and septum are the same in control. However, with impaired relaxation, the values in the 6th
and 7th
mimicking R-type flow pattern in LVDD. R-type LVDD was also modeled with a normal septum (RNSPT-type) for analysis of septal contribution.
PN-type
As mentioned previously, thepseudo-normalflow velocity pattern is viewed as a com-bined IR + R pattern where one may use a variety of weighting factors in forming the combination. We have chosen to represent the IR and R patterns so that they have nearly equal effect in terms of changes observed in the LV pressure-volume relation-ship, and have combined them equally to represent the PN case. Specifically, we chan-ged the last Gaussian term B to 350 ms,lLVto 0.05/ml, andlSPT to 0.1/ml. All other H-CRS model parameters remained at control values.
Systolic Contractility
Given the report of Kawaguchi et al. [1] that systolic contractility increases to maintain left ventricular stroke volume (LVSV) and cardiac output (CO) within the setting of LVDD, we repeated these simulations after first increasing the gain of the LV end-sys-tolic pressure-volume relationship (ELV,ESand ESPT,ES) by 60%. If the diastolic stiffness of the muscle fibers of the wall increase with no stimulation, then with stimulation of the very same fibers and subsequent development of normal active tension, logically there should be some increase in total developed tension (active + passive) compared with the control case. Consequently, an increase in the gain of the end-systolic pres-sure-volume relationships (ELV,ESand ESPT,ES) should be evident.
This increase in “systolic contractility” is considered intrinsically myogenic in nature (i.e., heterometric autoregulation of cardiac output on the basis of fiber length as in the Frank-Starling mechanism) and is not due to reflex sympathetic augmentation in myocardial contractility. This later form of contractility control is present in the H-CRS model, but it is a separate mechanism that affects the ESPVR via the function a (Fcon) in Eqn. 2 above.
For all cases, we further examined how each condition affects the systemic, pulmon-ary, and cerebral circulations. Unless otherwise specified, the pleural pressure was held at -5 mmHg in all simulations to eliminate respiratory variations in inlet valve flows and thus better focus on hemodynamic events.
Computational Aspects
The model consists of 93 nonlinear ordinary differential equations plus 6 embedded diffusion equations that describe the distributed gas exchange compartments of the lung, tissue, and brain. A 5th-order Cash-Karp Runge-Kutta [16] numerical integration method solves the differential equations on an IBM compatible PC. Simulating 50 sec-onds takes about 1 hour to compute using a Pentium 4 2.4G machine with 512 MB DDR RAM.
Results
Normal Physiology
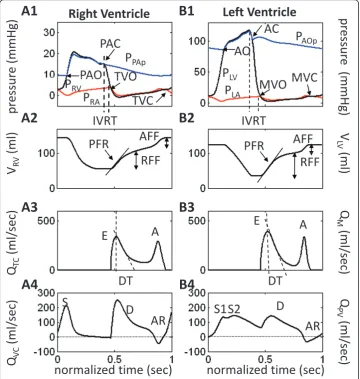
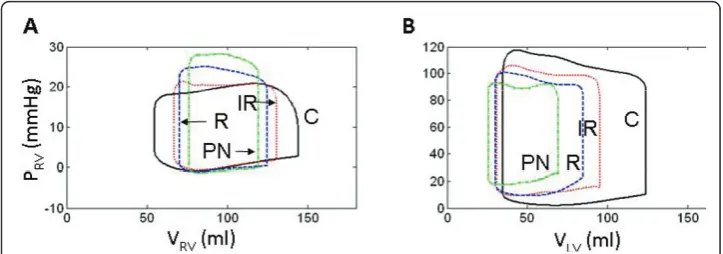
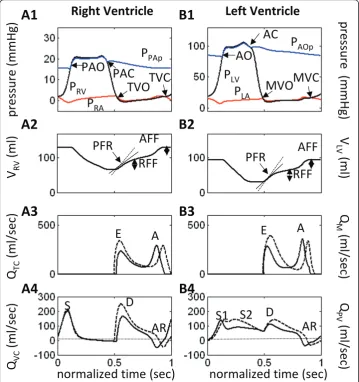
component during diastolic ventricular filling. Normally, the E/A ratio is 1 - 1.5 and the trans-mitral deceleration time (DT; Figure 2B3) during rapid filling (E wave) is 170 - 230 ms [7]. The central venous (QVC) and distal pulmonary venous (QPV) flow waveforms are shown in Figure 2A4 and 2B4, respectively. These waveforms consist of systolic (S), diastolic (D) and atrial reversal (AR) flow components. The normal systolic pulmonary venous S wave is split into early and late components (S1 and S2; Figure 2B4). Table 2 lists the indices for both right and left ventricular performance and the mean values of systemic circulatory variables, blood gas tensions, and A-V gas differences in the brain and extra-cranial tissues. Figure 3 (solid black line labeled C for control) depicts the normal instantaneous RV and LV pressure-volume rela-tionships. The other loops and curves of the three modeled LVDD types are discussed below.
A1
B1
P
PApPAO
PAC
TVO
P
LVP
AOpAO
AC
MVC
pr
essur
e
(m
re
(mmHg)
Right
Ventricle
Left
Ventricle
A2
B2
P
RAP
RVPAO TVO
TVC
IVRT
P
LA LVMVO
MVC
IVRT
PFR
AFF
PFR
AFF
m
mHg)
pr
essu
(ml)
V
LV
(
A3
B3
RFF
RFF
A
E
A
V
RV(
(ml)
sec)
Q
M
A4
DT
B4
E
A
DT
A
S
D
Q
TC(ml/
s
(ml/
sec)
Q
)
S
D
AR
S1
D
AR
S2
Q
PV
(ml/
sec)
Q
VC(ml/
sec
normalized
time
(sec)
normalized
time
(sec)
Impaired Active Relaxation with Normal Systolic Contractility
The P-V loops (Figure 3) show a decrease in LV and RV stroke volume. Cardiac out-put and mean arterial and central venous pressures decrease (Table 2). Diastolic LV pressure exceeds control throughout diastole in the IR-type case (Figure 3B), elevating LV diastolic and left atrial (LA) pressures (compare Figure 2B1 and Figure 4B1). Pul-monary capillary pressure (PPC) increases from 8.5 to 14.0 mmHg, and pulmonary
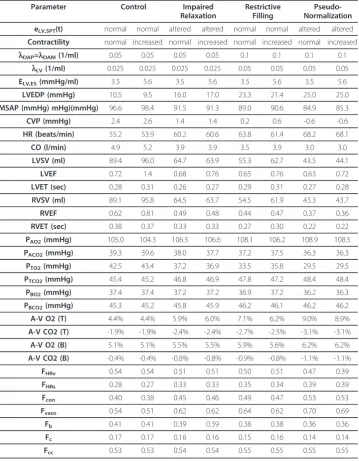
Table 2 Model Values for Key Indices and Variables in Control and LVDD Cases Parameter Control Impaired
Relaxation
Restrictive Filling
Pseudo-Normalization
eLV,SPT(t) normal normal altered altered normal normal altered altered
Contractility normal increased normal increased normal increased normal increased lDAP=lDAM(1/ml) 0.05 0.05 0.05 0.05 0.1 0.1 0.1 0.1
lLV(1/ml) 0.025 0.025 0.025 0.025 0.05 0.05 0.05 0.05
ELV,ES(mmHg/ml) 3.5 5.6 3.5 5.6 3.5 5.6 3.5 5.6
LVEDP (mmHg) 10.5 9.5 16.0 17.0 23.3 21.4 25.0 25.0
MSAP (mmHg) mHg)(mmHg) 96.6 98.4 91.5 91.3 89.0 90.6 84.9 85.3
CVP (mmHg) 2.4 2.6 1.4 1.4 0.2 0.6 -0.6 -0.6
HR (beats/min) 55.2 53.9 60.2 60.6 63.8 61.4 68.2 68.1
CO (l/min) 4.9 5.2 3.9 3.9 3.5 3.9 3.0 3.0
LVSV (ml) 89.4 96.0 64.7 63.9 55.3 62.7 43.5 44.1
LVEF 0.72 1.4 0.68 0.76 0.65 0.76 0.63 0.72
LVET (sec) 0.28 0.31 0.26 0.27 0.29 0.31 0.27 0.28
RVSV (ml) 89.1 95.8 64.5 63.7 54.5 61.9 43.3 43.7
RVEF 0.62 0.81 0.49 0.48 0.44 0.47 0.37 0.36
RVET (sec) 0.38 0.37 0.33 0.33 0.27 0.30 0.22 0.22
PAO2(mmHg) 105.0 104.3 106.5 106.6 108.1 106.2 108.9 108.5
PACO2(mmHg) 39.3 39.6 38.0 37.7 37.2 37.5 36.3 36.3
PTO2(mmHg) 42.5 43.4 37.2 36.9 33.5 35.8 29.5 29.5
PTCO2(mmHg) 45.4 45.2 46.8 46.9 47.8 47.2 48.4 48.4
PBO2(mmHg) 37.4 37.4 37.2 37.2 36.9 37.2 36.2 36.3
PBCO2(mmHg) 45.3 45.2 45.8 45.9 46.2 46.1 46.2 46.2
A-V O2 (T) 4.4% 4.4% 5.9% 6.0% 7.1% 6.2% 9.0% 8.9%
A-V CO2 (T) -1.9% -1.9% -2.4% -2.4% -2.7% -2.5% -3.1% -3.1%
A-V O2 (B) 5.1% 5.1% 5.5% 5.5% 5.9% 5.6% 6.2% 6.2%
A-V CO2 (B) -0.4% -0.4% -0.8% -0.8% -0.9% -0.8% -1.1% -1.1%
FHRv 0.54 0.54 0.51 0.51 0.50 0.51 0.47 0.39
FHRs 0.28 0.27 0.33 0.33 0.35 0.34 0.39 0.39
Fcon 0.40 0.38 0.45 0.46 0.49 0.47 0.53 0.53
Fvaso 0.54 0.51 0.62 0.62 0.64 0.62 0.70 0.69
Fb 0.41 0.41 0.39 0.39 0.38 0.38 0.36 0.36
Fc 0.17 0.17 0.16 0.16 0.15 0.16 0.14 0.14
Fcc 0.53 0.53 0.54 0.54 0.55 0.55 0.55 0.55
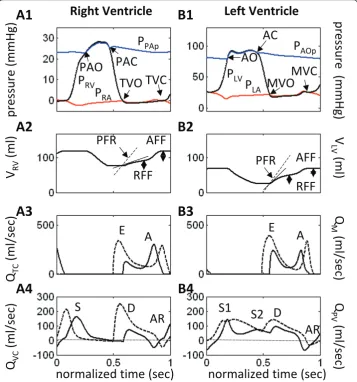
blood volume (VPC) by 12.2%, indicating pulmonary congestion (Table 3). Figure 4 reveals even greater detail. The salient features of IR-type are:
(a) Reduction in LV end-diastolic volume (EDV) and rates of ejection (Figure 4B2) as shown by the decreased PFR slope (compare with dashed line or control), with a severe reduction in the rapid filling fraction (RFF) relative to control. The atrial filling fraction (AFF) is relatively normal. The normal RV also experiences a reduction in EDV and rates of ejection and early filling (Figure 4A2).
(b) Strong decreases in the early E-wave component of both the mitral and tricuspid flow waveforms (Figure 4A3 and 4B3) reflect the difficulty in ventricular filling. The dashed line waveforms are control, shown for comparison.
(c) There is a pronounced separation of the S1 and S2 components of systolic por-tion of pulmonary venous flow waveform (QPV) (Figure 4B4), accompanied by a strong reduction in the amplitudes of the S2 component and the D wave. The atrial reversal waveform (AR) is relatively normal in IR-type LVDD. The dashed line waveforms are control, shown for comparison.
The normalized baroreceptor sensory nerve discharge frequency Fbdeclines from 0.41 to 0.39 and the normalized aortic chemoreceptor sensory discharge frequency Fc from 0.17 to 0.16 (Table 2). The increased Fcon (normalized sympathetic efferent dis-charge frequency controlling contractility) steepens the end-systolic pressure-volume relationship (ESPVR) slope of both ventricles. LV stroke volume decreases from 89.4 to 64.7 ml, and despite a decrease in the LV ejection fraction from 0.72 to 0.68, this number would not be interpreted as systolic failure.
Restrictive Filling with Normal Systolic Contractility
Figure 5 demonstrates the salient characteristics of R-type LVDD:
(a) Reduced EDV (Figure 3) and rates of ejection for both ventricles (Figure 5A2 and 5B2);
(b) Pronounced reduction in RV peak filling rate (PFR) and RFF (Figure 5A2), whereas LV PFR slightly exceeds the control value, but the RFF is reduced relative to control (Figure 5B2). AFF is nearly normal in the RV and strongly reduced in the LV;
(c) With regard to mitral inlet flow (Figure 5B3), the E wave is supra-normal and the A-wave is reduced substantially. This pattern is reversed for the tricuspid flow wave-form (Figure 5A3), where the E-wave amplitude is decreased and the A-wave enhanced slightly relative to control (shown by dashed lines);
(d) There is temporal separation of S1 and S2 components of systolic portion of QPV and the amplitude of the S2 component is strongly reduced (Figure 5B4). The diastolic peak of the D waveform is nearly normal, but following the peak it declines faster than the control waveform. The peak of the pulmonary vein AR reversal flow (Figure 5B4) is much enhanced in R-type LVDD. In the central venous flow waveform (QVC; Figure 5A4), the D waveform is strongly reduced and shortened relative to control, the S waveform is only slightly reduced, and the AR reversal flow peak is at control levels.
In the P-V loops of Figure 3, the LV end-diastolic pressure for R-type LVDD is seen to rise relative to control, whereas for the RV they decline slightly relative to control. In contrast, LV systolic pressure declines, but RV systolic pressure is elevated relative to control.
ϭ
ϭ
Ϯ
Ϯ
ϯ
ϯ
ϰ
ϰ
W
ZW
ZsW
WƉWK W
dsK
ds
W
>
W
>sW
KƉK
DsK
Ds
W&Z
Z&&
&&
W&Z
Z&&
&&
^
Z
^ϭ
Z
^Ϯ
ƉƌĞƐƐƵƌĞ;
ŵŵ,ŐͿ
ƉƌĞƐƐƵƌĞ;
ŵŵ,
ŐͿ
s
Zs;ŵů
Ϳ
>ss
;ŵů
Ϳ
Y
d;ŵů
ͬƐĞĐͿ
Y
D
;ŵůͬƐ
Ğ
ĐͿ
Y
Ws
;ŵůͬƐ
Ğ
ĐͿ
Y
s;ŵů
ͬƐĞĐͿ
ZŝŐŚƚsĞŶƚƌŝĐůĞ
>ĞĨƚsĞŶƚƌŝĐůĞ
Table 3 Model Values for Key Pulmonary Indices Parameter Control Impaired
Relaxation
Restrictive Filling
Pseudo-normalization lSPT(1/ml) 0.05 0.05 0.05 0.1 0.1 0.1 0.1
lLV(1/ml) 0.025 0.025 0.025 0.05 0.05 0.05 0.05
eLV(and SPT)(t) normal altered altered normal normal altered altered
Contractility normal normal increased normal increased normal increased
ELV,ES(mmHg/ml) 3.5 3.5 5.6 3.5 5.6 3.5 5.6
VPA,p(ml) 20.4 23.6 24.0 26.0 25.0 28.3 28.5
VPA,d(ml) 21.1 24.1 24.4 26.3 25.3 28.4 28.6
VPA(ml) 201.1 230.4 233.5 251.5 242.1 272.0 273.6
VPV(ml) 226.9 267.5 271.4 294.3 282.0 323.1 324.6
VPC(ml) 94.9 106.3 107.4 113.9 110.5 122.1 122.5
PPA,p(mmHg) 13.2 17.8 18.3 21.3 19.8 24.6 24.9
PPA,d(mmHg) 13.0 17.7 18.2 21.2 19.7 24.5 24.8
PPA(mmHg) 12.2 17.1 17.6 20.6 19.0 24.0 24.3
PPV(mmHg) 7.9 13.4 14.0 17.1 15.4 21.1 21.3
PPC(mmHg) 8.5 14.0 14.5 17.6 15.9 21.4 21.7
Mean values for several pressures and volumes associated with the pulmonary circulation.
ϭ
ϭ
Ϯ
Ϯ
ϯ
ϯ
ϰ
ϰ
W
ZW
ZsW
WƉWK W
dsK
ds
W
>W
>sW
KƉK
DsK
Ds
W&Z
Z&&
&&
W&Z
Z&&
&&
^
Z
^ϭ
^Ϯ
Z
ƉƌĞƐƐƵƌĞ;
ŵŵ,ŐͿ
ƉƌĞƐƐƵƌĞ;
ŵŵ,
ŐͿ
s
Zs;ŵů
Ϳ
>ss
;ŵů
Ϳ
Y
d;ŵů
ͬƐĞĐͿ
Y
D
;ŵůͬƐ
Ğ
ĐͿ
Y
Ws
;ŵůͬƐ
Ğ
ĐͿ
Y
s;ŵů
ͬƐĞĐͿ
ZŝŐŚƚsĞŶƚƌŝĐůĞ
>ĞĨƚsĞŶƚƌŝĐůĞ
ŶŽƌŵĂůŝnjĞĚƚŝŵĞ;ƐĞĐͿ
ŶŽƌŵĂůŝnjĞĚƚŝŵĞ;ƐĞĐͿ
In R-type LVDD, pulmonary pressures and volume increase (Table 3), whereas car-diac output and mean systemic arterial pressure (MSAP) fall by 29% and 7.9%, respec-tively (Table 2). Calculated LV ejection fraction drops, but only to 0.65.
Combined Restrictive Filling and Impaired Relaxation with Normal Systolic Contractility
This mechanism causes a marked decrease in right and left ventricular stroke volumes (Figure 3). The LV stroke volume, cardiac output, and mean arterial and central venous pressures decrease by 51.3%, 38.8%, 12.1%, and 125.0%, respectively (Table 2). The baroreceptor reflex responds by reducing vagal discharge frequency (FHRv) by 12.2% and increasing sympathetic frequency by 39.3% (FHRs). Heart rate increases by 23.6% (Table 2). Once again LV systolic function would not be considered depressed. Its ejection fraction decreases by 12.5%, to 0.63.
Figure 6 shows the detail involved in cardiovascular waveforms associated with PN-type LVDD. The significant features are:
(a) Reduction in EDV in both ventricles to an extent greater than IR or R-type LVDD considered alone (Figure 6A2 and 6B2). Ejection rates and PFRs are decreased substantially in both ventricles, as are RFFs. The LV AFF is strongly reduced, but the RV AFF for the right atrium (RA) is essentially normal;
(b) In the mitral flow waveform, the E and A waves have essentially the same ampli-tude, whereas the tricuspid flow has an E wave is much smaller than the A wave (Fig-ure 6A3 and 6B2);
(c) There is separation of the S1 and S2 components of systolic portion of the pul-monary venous flow waveform with strong reductions in the S2 component and the diastolic D wave. The AR reversal flow peak is enhanced (Figure 6B4). In the central venous flow waveform, the S wave is reduced in amplitude, the diastolic D wave is attenuated and shortened, and the peak of the AR reversal flow waveform is at control levels (Figure 6A4).
Septum
volume. When the mitral valve opens, the rapid filling phase begins which is marked by a small positive fluctuation in the general exponential filling curve for VSPT. The cycle of septal activation and relaxation produces biphasic motion, and as a conse-quence the septum behaves as a third pump along with the RVF and LVF, and contri-butes to ventricular performance. Septal priming before contraction initiates RV ejection (Figure 7A2), and RV outflow is maximum just as LV outflow is beginning (see downward slopes in VRVand VLVin Figure 7A2 and 7B2). This movement simul-taneously aids LV filling (Figure 7B2). The following septal contractile leftward thrust provides support to LV ejection (Figure 7B2). VRVreaches its minimum point and pul-monary arterial flow ends just before the septum reaches its maximum leftward posi-tion at the end of aortic flow (Figure 7A1-A3). In late diastole, the septum returns rightward toward its neutral position (Figure 7A3, black dashed line) as the LV fills and the mitral valve closes (Figure 7B1-B3). The tricuspid valve closes shortly there-after (Figure 7A2).
ϭ
ϭ
Ϯ
Ϯ
ϯ
ϯ
ϰ
ϰ
W
ZW
ZsW
WƉWK W
dsK ds
W
>sW
>W
KƉK
DsK
Ds
W&Z
Z&&
&&
W&Z
Z&&
&&
^
Z
^ϭ
Z
^Ϯ
ƉƌĞƐƐƵƌĞ;
ŵŵ,ŐͿ
ƉƌĞƐƐƵƌĞ;
ŵŵ,
ŐͿ
s
Zs;ŵů
Ϳ
>ss
;ŵů
Ϳ
Y
d;ŵů
ͬƐ
Ğ
ĐͿ
DY
;ŵůͬƐ
Ğ
ĐͿ
Y
Ws
;ŵůͬƐ
Ğ
ĐͿ
Y
s;ŵůͬƐ
Ğ
ĐͿ
ZŝŐŚƚsĞŶƚƌŝĐůĞ
>ĞĨƚsĞŶƚƌŝĐůĞ
ŶŽƌŵĂůŝnjĞĚƚŝŵĞ;ƐĞĐͿ
ŶŽƌŵĂůŝnjĞĚƚŝŵĞ;ƐĞĐͿ
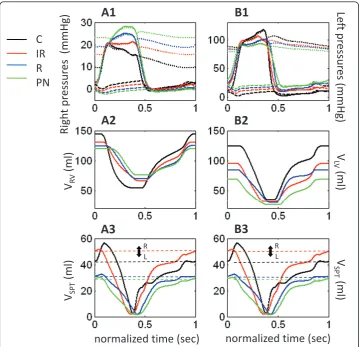
In LVDD, the steady-state neutral positions for septal volume changes (marked by dashed lines of corresponding color in Figure 7A3) differ significantly from control. These offsets in the neutral position reflect the different magnitudes of the background left-to-right pressure gradient across the septum in different LVDD states. Septal prim-ing motion is progressively diminished in the order IR®R®PN. In the case of IR-type LVDD, minimal septal priming reduces septal aid in RV ejection, causing pulmonary arterial flow to begin and end later than normal (see downward slope in Figure 7A2). As seen in Figure 7A3, the septum takes longer to reach neutral position so mitral flow lasts longer and its endpoint closer in timing to tricuspid flow (compare end of upward slope in Figure 7A2 and 7B2). The stiffened septum in R-type LVDD does not exhibit priming (Figure 7A3) so there is no elongation of RV ejection and LV filling, and RV and LV outflows are synchronized exactly (downward slopes of Figure 7A2 and 7B2). The septum does not contribute significantly to LV ejection as noted by slower septal leftward stroke and LV volume reaching minimum point before the sep-tum reaches its maximum leftward position (Figure 7B2 and 7B3). As in control, at septal neutral position QMends while QTCends shortly thereafter (Figure 7A2-B4). In PN-type LVDD, the septum has little role in determining RV and LV volumes with its
Le
ft
pr
es
(mmHg)
A1
B1
C
IR
ssur
es
(m
m
p
re
ss
u
re
s
IR
R
PN
m
Hg)
Righ
t
p
A2
B2
V
RV(ml)
V
LV
(ml)
B3
R R
A3
V
SP
T
(ml
)
V
SPT
(ml)
L L
normalized
time
(sec)
normalized
time
(sec)
)
V
minimal and slow movement between ventricles (Figure 7A3). With no septal aid in RV ejection, RV outflow starts much later than aortic flow, and ends later as well (Fig-ure 7A2 and 7B2). The septum also does not influence end-diastolic filling of the RV as in control, and transvalvular flows end at the same time (Figure 7A2 and 7B2).
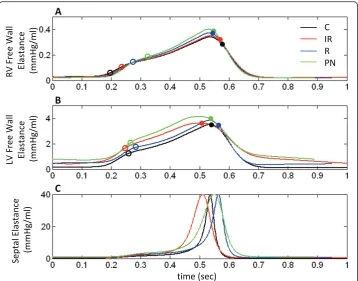
Elastance plots provide information about the timing and level of contractility of free walls and septum. Figure 8A-C depicts RVF, LVF, and septal elastance (mmHg/ml) (Eqn. 9). Open circles indicate opening of outlet valves, while solid circles indicate their closure. In the control case (black line), peak elastance occurs simultaneously for all three walls. The aortic valve closes at this peak and the septum, at its maximum leftward position (Figure 7B3) then snaps toward the right showing a sharp drop in septal elastance (Figure 8C) and the pulmonic valve remains open for this final phase of RV ejection (Figure 8A). By comparing the RV and LV ejection periods with the point of occurrence of septal contraction, one can gain a sense of the contribution the septum has to the ejection processes. Specifically, peak elastance coinciding for the LVF and septum (Figure 8B-C) at the point when the septum is leftward in position (Figure 7B3) indicates that its role in LV ejection is maximized as both contract at the same time for efficient ejection. Similarly, RV systole ends only as the septum nears full relaxation (Figure 8A and 8C) indicating septal activity is involved strongly in the RV ejection process.
Z
s
&ƌĞĞt
Ăůů
ůĂƐƚĂŶĐĞ ;ŵŵ
,
Őͬŵů
Ϳ
ƚŝŵĞ;ƐĞĐͿ
>s&ƌĞĞ
tĂůů
ůĂƐƚĂŶĐĞ ;ŵŵ
,
Őͬŵů
Ϳ
^ĞƉƚĂůůĂƐƚĂŶĐĞ
;ŵŵ
,
Őͬŵů
Ϳ
/Z Z WE
In IR-type LVDD, the modified activation function for LVF and septum is apparent in elastance curves with a slowed and elevated relaxation phase following peak ela-stance (Figure 8B-C). Incomplete relaxation maintains the walls in contracted states for a longer time, widening the peaks. The baroreceptor reflex provides a slight positive inotropic effect on RV and LV contractility and elastance (Figure 8A-B) as shown by the Fcon value increasing by 12.5% relative to control. As a result, free wall elastance values exceed control throughout the cardiac cycle. The pulmonic valve opens later than in control (Figure 8A) as seen also in Figure 7A3 due to the loss of septal prim-ing, however the closure time is near control. Thus, RV ejection time is reduced with values shown in Table 2. On the other hand LV ejection time is reduced by premature closure of the aortic valve (Figure 8B).
The LVF elastance curve in R-type LVDD is similar to that for control except for a significant diastolic offset and a higher peak elastance (Figure 8B). RVF elastance how-ever, does not exhibit a diastolic offset, but due to a baroreflex-mediated augmentation of myocardial contractility, the rates of rise and peak elastance are increased (Fcon increases by 22.5% relative to control). A similar sympathetic augmentation applies to the modified (stiffened) LVF elastance; however, the effects of augmentation (other than the increase in peak) are not as evident as in the case of RVF elastance due to masking by neural augmentation (explained below). Both outlet valves open later than in control (Figure 8A-B) resulting in prolongation of both pre-ejection periods (see ejection times in Table 2). Peak septal elastance and thus aortic valve closure occur at a delay from peak LVF elastance (Figure 8C). Unlike in control, the pulmonic valve closes at peak RVF elastance (Figure 8A), well before maximum septal elastance (Fig-ure 8C) and aortic valve clos(Fig-ure (Fig(Fig-ure 8B). Septal role is diminished for both ventri-cles: the delay in septal contraction reduces LV ejection support; in the case of the RV, both modes of septal contribution to ejection, initial septal priming and final rightward swing during septal relaxation (Figure 7A3), are lost. RV systolic operation becomes independent of the septum.
In PN-type LVDD, peak LVF elastance decreases but a compensatory increase in Fcon raises this function above control (Figure 8B) (Fconincreases by 32.5% relative to con-trol). This increase in Fcon also increases peak elastance of the RV (Figure 8A). As expected LVF elastance bears effects of impaired relaxation with early peaking, slow and incomplete relaxation, and elevated diastolic elastance exacerbated due to passive stiffness effects (Figure 8B). The septal elastance curve also shows IR effects with a wider peak and slower downward stroke, but a delayed peak resulting from septal stiff-ness (Figure 8C). Peak elastance values all occur at different times: LVF followed by RVF followed by septum (compare Figure 8A-C). While in IR-type LVDD aortic valve closure precedes pulmonic valve closure and in R-type LVDD the opposite occurs, PN-type LVDD sees a combined effect and outlet valves close at approximately the same time (Figure 8A-B). RV ejection time is severely reduced in comparison to control (see Table 2), due to both pulmonic valve opening delay and early closure (Figure 8A).
in control for all LVDD types (Figure 9A1). In IR-type LVDD, LVF elastance peak is wider, has slowed relaxation, and is elevated throughout, except at peak elastance where it matches control and falls below briefly during the downward phase at the start of isovolumic relaxation (red line in Figure 9A2). In R-type LVDD, LVF elastance is elevated above control during diastole, the rise to peak elastance is slower than con-trol, and the peak value matches control (blue line in Figure 9A2). LVF elastance with PN-type LVDD is similar to IR-type, except diastolic elastance is higher and the upstroke slower (green line in Figure 9A2). In all cases, peak elastance does not change (Figure 9A1-A2), unlike what is seen in Figure 8A-B, this feature attributed to neural augmentation of contractility. In addition, R-type LVF elastance is slower on the upstroke (Figure 9A2), this aspect masked when neural augmentation is included mak-ing the upstroke appear similar to control. All changes to RVF elastance seen in Figure 8A are also a result of the neural aspect and unrelated to P-V relationships.
Similarly, the reason for heart rate changes with LVDD was evaluated by fixing autonomous neural control of heart rate at mean steady-state control value. RVF and LVF elastance are plotted in Figure 9B1-B2, respectively, for several cardiac cycles. With this feedback missing, heart rate remains unchanged from control in all LVDD types, so any change in heart rate observed in LVDD is solely a result of neural com-pensation for stroke volume drop.
Summary of Pressure and Volume Changes
Figure 7 shows that morphology of the pressure and volume waveforms change drama-tically from control in the LVDD cases. The disease process is assumed localized to the LV, yet some of the more substantial effects of LVDD are seen in the altered wave-forms of the normal right heart. In control, RV pressure slopes downward during ejec-tion under normal pulmonary arterial loading condiejec-tions (Figure 7A1), due to the
Zs
&
ƌĞĞ
t
Ăůů
ůĂƐƚ
ĂŶĐĞ
;ŵŵ
,
Őͬ
ŵů
Ϳ
>s
&ƌĞ
Ğ
tĂ
ůů
ůĂƐƚ
ĂŶĐĞ
;ŵŵ
,
Őͬ
ŵů
Ϳ
ƚŝŵĞ;ƐĞĐͿ
ϭ
ϭ
Ϯ
Ϯ
/ZZ WE
proper operation of the septum which supports LV ejection during this time period. In all of the LVDD cases, the increase in pulmonary arterial afterload and diminished sep-tal contractile motion cause the RV pressure during ejection to change slope in a posi-tive direction. The effect of the LVDD-induced afterloading and decreased septal activity is also seen in the reduced ejection rates in the RV volume curves (Figure 7B1). With a loss of septal contractile motion in LVDD, the LV is not as well-sup-ported and the slope of the PLVwaveform declines during ejection (Figure 7A2). The volume curves indicate reduced ejection and filling rates and a reduction in stroke volume, hence cardiac output (Figure 7B2). Mean systemic arterial pressure (MSAP) has a tendency to drop, but baroreflex mechanisms compensate to keep systemic arter-ial load pressure relatively constant. MSAP however does decline slightly from control in each LVDD state (Figure 7B2). Diastolic LV pressure however, changes significantly from control in a positive direction. This strongly affects mitral flow, ventricular filling and ultimately stroke volume. In contrast, diastolic variation in diastolic RV pressure is relatively small and in the negative direction from control (Figure 7A1). Systolic RV pressure varies much more significantly due to increased myocardial contractility.
Summary of Transvalvular Flow Changes
In the case of the mitral valve, each LVDD state has different effects on the E and A wave components of ventricular filling. Restrictive filling (Figure 5) shortens decelera-tion time (DT) and increases the E/A ratio (> 1.5), whereas impaired relaxadecelera-tion (Figure 4) slightly prolongs DT and decreases the E/A ratio (< 1). In PN-type (Figure 6) the E and A peaks are nearly equal. The amplitude and duration of the A wave changes con-siderably relative to control, where in the restrictive case it is small and brief and in IR it has an amplitude and duration comparable to control (slightly increased amplitude; slightly decreased duration). However, in the case of the tricuspid valve, all three LVDD cases yield prolonged deceleration times and abnormal E/A ratios (< 1). The normalized diastolic filling phase is shortened and the amplitudes of the A wave increase slightly relative to control. Thus the E/A ratio of tricuspid flow is more speci-fic than mitral for LVDD, because pseudo-normalization does not occur. In general and depending on the severity of abnormality, tricuspid E-wave flows progressively decrease with LVDD type (IR® R®PN), causing a diminished rapid filling fraction and prolonged deceleration times.
Summary of Pulmonary and Central Venous Flow Changes
a broadening of the S wave with LVDD state, coupled with a strong decline in both peak amplitude and duration of the D wave.
The ratio of D/S flow volume for both the central and pulmonary venous flows can indicate change in inflow patterns. For example, lowering ratios are indicative of lesser diastolic contribution to ventricular inflow. Pulmonary venous flow volume drops from the control value of 0.74 with all LVDD cases except the restrictive case, wherein it increases (Table 4). In central venous flow volume, all LVDD cases show lowered D/S ratios compared to the control value of 1.96. Lowered D/S ratios are indicative of higher diastolic pressures, preventing complete filling of the atria. The higher pulmon-ary venous D/S ratio in restrictive LVDD is influenced by the limited ventricular pumping action during systole, thereby restricting LA inflow.
Summary of Right Heart Effects
Diastolic dysfunction of the LV has notable effects on the right heart. As described in detail above, the E/A wave ratio for tricuspid flow with LVDD is consistently below 1, unlike mitral flow, and increasing in severity in the order IR®R®PN (Figure 4, Figure 5, and Figure 6). Similarly, the D/S ratio of atrial inflow consistently drops in the same order of severity in the RA, unlike the LA with positive change in R-type LVDD (Table 4). In addition, while the LV is marked by normal EF particularly with increased systo-lic contractility, these studies indicate that with normal contractility from a control value of 0.62 (Table 2), impaired relaxation decreases RVEF to 0.49, restrictive filling decreases it to 0.44, and the combined abnormalities decrease it further to 0.37.
Septal dysfunction with LVDD has effects on the right heart. The septal role in RV ejection is lost with diminished septal priming, delaying opening of the pulmonic valve. Reduced contractility also changes the morphology of ventricular pressure waveforms, with loss of normal trends in systolic PRV and PLV.
LVDD with Normal and Abnormal Septal Stiffness
In the P-V loops of Figure 10A1 and 10B1, the curve labeled R simulates R-type LVDD with elevated levels of stiffness for both the free wall and septum (as in Figure 3). The curve labeled RNSPTrepresents a second simulation where the septal stiffness is set to normal control levels, all other conditions being the same. Focusing on the LV ejection phase of the P-V loops in Figure 10B1, the simulated progression of septal disease RNSPT® R causes the septum to support free wall pumping to a lesser degree, dimin-ishing the “ramping up”of LV pressure during the ejection phase and reducing stroke volume. Changes in septal stiffness also have a pronounced effect on the P-V loops of the RV (Figure 10A1). The ejection phase is downward in the P-V loop in control.
Table 4 D/S Ratios of Central and Pulmonary Venous Flow Volumes
D/S Ratio Control IR R PN
Right 1.96 (100%) 1.10 (-44%) 0.67 (-66%) 0.30 (-85%)
Left 0.74 (100%) 0.57 (-23%) 0.85(+15%) 0.46 (-38%)
With increased LV wall and then septal stiffness, this slope changes to upward, indica-tive of the increased afterload imposed on the ejecting RV.
Figure 10B2 shows the LV elastance curves for the two cases of RNSPT-type and R-type LVDD. Both restrictive cases exhibit a diastolic offset in elastance relative to con-trol. Peak LV elastance in RNSPT-type LVDD is at control levels, whereas it is elevated in R-type LVDD. In the case of the RV, there is no diastolic offset in elastance, the RNSPTand control elastance curves are nearly identical, and the R elastance curve is elevated by a baroreflex-mediated increase in myocardial contractility. The LV is affected in the same way.
LVDD with Increased Systolic Contractility
Recent literature [2,3,17,18] suggests that increases in systolic contractility can reduce the end-systolic volume of ventricles affected by diastolic dysfunction and so compen-sate for the decreased stroke volume caused by the smaller end-diastolic volume. Data from LVDD patients [1] indicates that chronic tissue changes that occur in response to abnormalities such as increased pressure and volume loads can affect myocardial force generation as well as passive transmission of force through the ventricular wall. In this case, we assume that changes in the EDPVR in the free wall or septal component of the model are accompanied by an increase in the corresponding ESPVR characteristic. The usual inotropic factors (a(Fcon) in Eqn. 2) are also at play in the case of barorecep-tor-mediated increases in ventricular contractility that occurs in response to changes in MSAP.
Considering only simulations of IR-type LVDD, adding increased ESPVR contractility decreases both LV end-systolic and end-diastolic volumes. The new loop produced has the same shape, but is shifted leftward toward lower volumes (compare the IR simula-tions of Figure 3B and Figure 11B1). The shift produces relatively little change in stroke volume, cardiac output, arterial pressure, or heart rate (Table 2 and Table 3).
A1
B1
P
LV
R
(mmHg)
PRV
(mmHg)
C
RNSPT C
RNSPT R
A2
VRV(ml)B2
VLV(ml)R R LVe
(mmHg
/m
l
m
Hg
/ml)
C RNSPT
C RNSPT
time(sec) time(sec)
l)
eRV
(m
m
The LV elastance curve however, has a pronounced diastolic component due to impaired relaxation and its peak is elevated with the induced increase in ESPVR con-tractility (compare Figure 8B and Figure 11B2). LV ejection fraction increases from 0.68 to 0.76. The control waveform in Figure 11B2 (labeled CS) incorporates the increase in ESPVR contractility, but all other parameters are unchanged. Its peak mag-nitude is therefore considerably larger than that of the normal control waveform. The RV ejection fraction remains approximately the same with the increase in LV systolic contractility and Fcon, although slightly elevated relative to control (0.40-0.45), remains relatively constant (0.46). The RV elastance curve is relatively unaffected by increasing ESPVR contractility (compare IR-type LVDD curves in Figure 8A and Figure 11A2) and is quite similar to normal control (C).
One obtains slightly different results by adding increased LV ESPVR contractility to simulations of R-type LVDD (compare the R P-V loops in Figure 3B and Figure 11B1; Table 2 and Table 3). Here, mean systemic arterial pressure (MSAP) increases from 89.0 to 90.6 mmHg, cardiac output from 3.5 to 3.9 L/min and LVEF from 0.65 to 0.76. The LV elastance curve in the R-type LVDD simulation has a diastolic offset (Figure 11B2) that is relatively constant and quite unlike the time-varying diastolic component of the IR LV elastance curve. Fconis slightly decreased (0.49 to 0.47) but elevated rela-tive to control CSof 0.38. The RV elastance curve in R-type LVDD shows that this increase in LV systolic contractility has virtually no effect on the RV elastance function (compare Figure 8A and Figure 11A2; Table 2).
Increasing the LV ESPVR contractility in PN-type LVDD does not change LV func-tion significantly, other than by more modestly increasing LVEF from 0.63 to 0.72, a number consistent with Kawaguchi’s report (70.3 ± 14.8%) (1). LV stroke volume in PN with systolic augmentation is essentially the same as in the original PN-type LVDD case (43.5 compared to 44.1 ml). Table 2 indicates that Fconlevels for the PN case do
A1
B1
P
LV
Hg) R (mmHg)
PRV
(mm IR CS
R
PN
CS
IR PN R
A2
VRV(ml)B2
VLV(ml)e
) PN R PN e
LV
(mmH
g
m
mHg
/ml
)
CS
R
IR PN
C IR
R
time(sec) time(sec)
g
/ml)
eRV
(m CS
not change as well. The LV elastance curve in PN has a time-varying diastolic compo-nent and an elevated systolic peak (Figure 11B2). Since baroreflex-mediated Fconlevels do not change due to systolic augmentation, the elevated peak of the LV elastance curve (Figure 11B2) is explained simply as the CScontrol systolic elastance component being moved upward by the elevated time-varying diastolic component (i.e., a move-ment upward toward increased LV elastance (time-varying stiffness)). A comparison of Figure 8A and Figure 11A2 for PN-type LVDD shows that the time course of the RV elastance curves is essentially the same with and without LV systolic augmentation. We note however, that increasing the systolic contractility of an LV afflicted with any form of LVDD does not normalize pulmonary pressures or volumes; therefore pulmon-ary congestion persists (Table 3).
Effects on Left Atrial Performance
Figure 12 shows the effect of the different types of LVDD on the instantaneous pres-sure-volume loops of the right and left atria. Figure 12A1 and B1 show the effects of the three types of LVDD on P-V characteristics of the right and left atria, respectively for the case where the LV has normal ESPVR contractility. In the LA, there is a shift upward and to the right toward higher values of pressure and volume (size) in the
simulation sequence C ® IR ® R ® PN (Figure 12B1), whereas RA pressures and
volume decrease in the same sequence (Figure 12A1). An increase in the size of the LA relative to control is a common finding in various types of LVDD. In a study on 276 patients, Park et al. [19] have shown that the severity of LVDD correlates well with left atrial dimensions. As the degree of LVDD became more severe, left atrial size and volume increased.
Figure 12A2 and 12B2 examine only the restrictive LVDD case of either normal sep-tal stiffness (RNSPT-type) or increased stiffness associated with R-type LVDD. In the LA, the P-V loop is displaced upward and to the right in the simulation sequence C® RNSPT® R in nearly equal increments in pressure and volume. However in the RA, the loops are displaced downward and to the left, but not in equal increments. With normal septal stiffness, the RA P-V loop is very similar to the control loop. However, with the increased septal stiffness inherent in R-type LVDD, the P-V loop is strongly depressed. The difference here is in septal contractile capability, which is strongly cur-tailed in R-type LVDD (Figure 7A3). Thus, septal integrity is very important to RA performance as it is to RV pumping. With increased LV systolic contractility, there is very little difference between the RA and LA P-V loops shown in Figure 12A3 and 12B3 and Figure 12A1 and B1, respectively.
Effect of Respiratory Variation
Our simulations show that the percent respiratory variation (percent deviation from
maximum flow) in control QTC is 24.2% and 5.5% in QM(Table 5 and Figure 13A1
and 13B1). In LVDD, respiratory variation in QTCbecomes much more pronounced,
with values of 36.9%, 48.1% and 70.1% for the IR, R and PN cases, respectively (Table 5 and Figure 13A2-A4). Respiratory influence on mitral flow QMis weak, but can be seen in the control case (Figure 13B1). In LVDD, there is a progressive reduction in
percent respiratory variation in QMin the direction IR ® R® PN LVDD (Table 5
and Figure 13B2-B4). Concurrently, pulmonary blood volume increases in the same
direction of IR ® R® PN LVDD (Figure 13C2-C4), acting as a buffer against left
heart respiratory variation. This increase in pulmonary blood volume is accompanied by increased afterload on the RV and hence RV pressure increases (Figure 3A). The
A1
B1
m
mHg)
P
LA
(mmHg)
C
IR R
PN
PN R
IR
RightAtrium
LeftAtrium
A2
B2
PRA
(m C
C
PRA
(mmHg)
P
LA
(mmHg
)
RNSPT
R
R
RNSPT
C
A3
B3
g)
P
LA
(mm
C IR R
PN R
IR
VRA(ml) VLA(ml)
PRA
(mmH
Hg)
PN
IR
C
buffering effect of the pulmonary blood volume seemingly decouples the respiratory variation so that it mainly affects the right heart as RV systolic pressures increase and diastolic pressures decrease, becoming even more influenced by PPLand less influenced by the septum. Moreover, the mean position of the septum is displaced rightward in IR-type, and leftward in R-type and PN-type LVDD (Figure 7A3), with attendant loss of pumping efficiency in all LVDD cases relative to control.
Discussion
Several factors can interact to cause LV diastolic dysfunction, increasing the difficulty of identifying mechanism(s) underlying any one case. It would help if one could isolate and independently change each putative cause of LV diastolic dysfunction, and then
Table 5 Percent Respiratory Variation for Various Flows and Volumes
Control IR R PN
QTC 24.2% 36.9% 48.1% 70.1%
QM 5.5% 5.3% 4.5% 3.7%
VRV 14.5% 15.2% 17.9% 18.8%
VPA,p 6.1% 7.0% 6.1% 6.4%
VPA 6.6% 6.5% 5.7% 5.9%
VPA,d 6.1% 7.0% 6.1% 6.4%
VPC 4.8% 4.0% 4.1% 3.6%
VPV 1.7% 2.6% 2.5% 2.8%
VLV 3.4% 3.1% 1.5% 2.5%
Percent respiratory variation between inspiration and expiration for various flows and volumes in the control and LVDD cases.
A1
IR
Control
A2
A3
A4
R
PN
Exp. Insp. Exp. Insp. Exp. Insp. Exp. Insp.
QTC ml/sec)
B1
(
c)
B2
B3
B4
QM
(ml/
se
c
C1
U
LM
m
l)
C2
C3
C4
time(sec) VPU (m
study the subsequent effects of each. This study and others we have published show that by changing just a few parameters of our H-CRS model, one can closely approxi-mate the myriad effects of LVDD associated with congestive heart failure. The com-plexity of the model allows for an accurate and comprehensive view of the problem. Here, LV active relaxation and passive wall stiffness are each represented by a single parameter, and changing one or both closely simulates many of the abnormalities seen in patients with LVDD. Simulating LVDD with this model is straightforward and appears to be an excellent means of addressing the controversies surrounding HFNEF causation.
Because pulmonary pressures increase and the A-V O2 difference widens as stroke volume, cardiac output, and mean arterial pressure decrease, the model confirms that LVDD is a form of heart failure, since cardiac function cannot match the metabolic requirements of the body, or can do so only at elevated LV filling pressures. The increase in pulmonary blood volume and efferent sympathetic nervous system activity are also typical of heart failure. The model reproduces these pathologic features with-out decreasing LVEF to a number that clinicians would regard as significantly depressed, and so demonstrates that LVDD alone can cause most (but perhaps not all) the major signs of HFNEF.
In the three types of LVDD we modeled, pulmonary pressures and volumes were all elevated (Table 3). They were reduced but not entirely normalized by increasing LV contractility, since persistent LA pressure elevation (Figure 12B1) would maintain high pulmonary venous, capillary, arteriolar, and pulmonary arterial pressures. Dyspnea would probably result if R-type LVDD brought the LVEDP to 23.0 mmHg, and even more likely with an LVEDP of 25.0 mmHg in PN-type LVDD (Table 2). This would be especially true if these increases were new, and not offset by the previous, gradual increase in lymphatic removal of lung edema that occurs with longstanding LVDD. Currently our H-CRS model does not contain a lung lymphatic drainage model, and cannot be used to predict how gas exchange would be affected in longstanding LVDD.
Removing neural feedback for cardiac contractility and heart rate shows that aug-mentation of these aspects in the right heart with LVDD is purely neural. In the left heart neural augmentation plays a role in increasing peak elastance, improving early systole in R-type LVDD, and increasing heart rate, leaving altered elastance curves mainly a result of LVDD.
Recent literature [1,2] states that if LV systolic contractility is increased, the reduced end-systolic volume that is obtained can partly compensate for the reduced end-diasto-lic volume produced by LVDD, although cardiac output remains decreased. It indicates that chronic tissue changes, and not just greater sympathetic traffic, increase ESPVR stiffness. This is consistent with findings that concentric LV hypertrophy increases both passive stiffness and systolic contractility [1,17]. Although LVEF is sustained (or even supernormal), diastolic LV pressures, pulmonary pressures, pulmonary blood volumes, and heart rates remain elevated. The circulation is adequate under these con-ditions, but is maintained at the expense of elevated filling pressures and pulmonary congestion, which often provokes dyspnea and reduces exercise tolerance.
relaxation combine to pseudo-normalize the E/A ratio, which occurs if left atrial and pulmonary pressures are severely elevated, and diminished blood return lowers right atrial and central venous pressure. Consequently, it may be difficult to detect or deter-mine the cause of LVDD using only LV measurements. Our model suggests that in this situation, right heart function might provide diagnostic clues. For example, the tri-cuspid flow pattern remains abnormal when mitral flow is pseudo-normalized, and the right ventricular ejection fraction is always abnormal even though LV systolic contrac-tility is increased. Perhaps the term HFNEF should only apply to the LV, since the right ventricular ejection fraction is never normal in the presence of LVDD.
Septal role in hemodynamics is limited with LVDD. The loss of septal priming motion diminishes septal aid to RV ejection delaying opening of the pulmonic valve and altering the endpoint of RV outflow as well. The stiffened septum in R-type and PN-type has a slower leftward stroke contributing less to LV ejection. Abnormal septal performance produces changes to the mechanical synchrony of ventricles during systole.
The model predicts that either active relaxation or passive stiffness, or both, will increase A-V differences across the lung, systemic, and cerebral tissues (Table 2), and that these differences correlate linearly with decreases in mean arterial pressure and cardiac output. Our simulations show that impairing either active relaxation or passive stiffness creates nearly identical decreases in cardiac output, and the changes in A-V O2 and CO2concentrations are likewise similar. Much larger A-V differences result when both active relaxation and passive stiffness are abnormal. Increasing systolic con-tractility does not reverse these changes. Cerebral autoregulation stabilizes brain perfu-sion despite widely varying cardiac outputs, and the resulting changes in O2 extraction and CO2deposition are more narrowly confined. The model predicts that when extra-cerebral O2 and CO2 differences widen by as much as 16.9 and 6 mmHg, respectively, they will increase in the brain by less than 5.1 and 3.9 mmHg, respectively.
In summary, the following occur in any form of isolated LVDD (in the absence of a compensatory increase in total body fluid volume):
1. elevated LVEDP
2. reduced stroke volume and cardiac output; increased A-V O2 and CO2
differences
3. reduced tricuspid flow E/A ratio
4. prolonged tricuspid flow deceleration time
5. wider pulmonary venous flow (PVF) S1 S2 separation with reduced S2 6. decreased central venous flow (CVF) D/S ratio
7. decreased central venous pressure 8. increased pulmonary venous pressure 9. decreased RVEF
In addition, restrictive filling can:
while impaired LV free-wall relaxation can:
1. decrease mitral flow E/A ratio 2. prolong mitral flow deceleration time 3. decrease pulmonary venous flow D/S ratio
Finally, combining impaired relaxation and restrictive filling shows:
1. a normal mitral flow E/A ratio 2. a normal deceleration time
The model shows that the opposing flow waveforms of combined impaired relaxation and restrictive filling will “compete” to shape the final mitral inflow pattern. Just how “normal”a pseudo-normalized pattern becomes will depend on the dominant mechan-ism. But again, RV function should be a less ambiguous indicator of LVDD, since both the pulmonary vein and tricuspid flow patterns remain abnormal despite a pseudo-nor-mal mitral flow pattern. A suggestive tricuspid E/A ratio combined with evidence of elevated LVEDP and pulmonary congestion could be more diagnostic of LVDD than the more traditional mitral E/A measurement.
In short, this modeling study confirms several experimental findings. Firstly, we demonstrate that LVDD causes heart failure, with commonly recognized signs of decreased cardiac output, stroke volume, and mean arterial pressure, A-V O2 difference widening, and pulmonary congestion. Secondly, we show that normal ejection fraction occurs with increased LV systolic contractility (a result of experimentally observed chronic tissue changes), producing the well-known HFNEF phenomenon. Importantly, our modeling study points out key features of LVDD not previously recognized. These include: (a) the consistent right heart signs of LVDD, e.g., decreased E/A wave ratios regardless of LVDD type (Figure 4, Figure 5, and Figure 6); (b) the pronounced effect of changes in septal motion on RV mechanics (Figure 7-Figure 8); and (c) the effects of neural augmentation of RV contractility on RV mechanics (Figure 9).
Limitations
All models have limitations and some of the more important limitations associated with the current study are listed below.
(1)LVDD alone may not produce every defining sign of HFNEF. This study has focused on abnormal diastolic properties of the left ventricle, and not evaluated how extra-cardiac pathology such as reduced arterial compliance [21,22] might contribute to the syndrome. The diastolic changes introduced to model the various types of LVDD were made to mimic acute LVDD in the human patient on a short time scale. Longer term adjustments by the body are neglected including chronic changes in blood volume and venoconstriction. The model leaves one suspecting that such factors are operative, however, at least in some cases.
effect on the cardiovascular system, and with intermediate severity compared to both effects acting together as in PN-type LVDD. With these simple assumptions, we were able to characterize the three main types of LVDD with changes in
hemo-dynamic severity in the direction C ® IR ® R ® PN. Of course, with other
weightings of IR or R disease, this progression of LVDD severity could change. Nevertheless, these simulations with simple assumptions have emulated the classi-cal cliniclassi-cal classifications of LVDD. The important contributions of this work lie however, in the mechanistic explanations of these different disease entities particu-larly in elucidating the role of septal mechanics in each case. This work would be much enhanced by the availability of patient hemodynamic data sets that would include bi-ventricular high fidelity pressure recordings and transvalvular Doppler flow velocity recordings from the tricuspid and mitral valves. Ultimately, modeling work of this type should be directed toward the hemodynamic characterization of the individual patient. The question arises that if a patient whose LVDD is the result only of increased stiffness (R), as may be the case at low heart rates [2], would that alone be sufficient to produce all the resulting signs and symptoms of heart failure? It is our hope that future versions of our H-CRS model could not only characterize the patient’s ventricular mechanics, but could also incorporate the additional extra-cardiac factors that might help answer this question.
(3) In planning for more comprehensive studies of congestive heart failure, the model will require an update on the lung lymphatic drainage model currently used. In addition, patients with congestive heart failure often exhibit Cheyne-Stokes respiration (characterized by a periodic waxing and waning of the respiratory tidal volume). This is a most interesting problem, actually a separate study in and of itself, that would have impact on gas transport, autonomic control of the cardiovas-cular system and introduction of hemodynamic variations that could have conse-quences on ventricular mechanics. Although this is a very appropriate topic for analysis by our H-CRS model, it is beyond the scope of the current manuscript and therefore we leave it to future work.
Conclusions
Pulmonary and Gas Exchange Model
Pji: pressure in region j of species i, where i: O2, CO2, or both (*), and j = alveoli (A), collapsible airways (C), rigid dead space region of airways (D), interstitial space (IS), intracellular space (IC), or atmosphere (ATM); PEL: alveolar transmural pressure; PTM: collapsible airway transmural pressure; PS: standard pressure; VA: pulmonary alveolar volume; VC: pulmonary collapsible airway volume; VCW: total gas volume in lungs; VVE: lung viscoelastic volume; VD: anatomic dead space volume; VC,max: maximum col-lapsible airway volume; V*: alveolar volume at end inspiration; QED: air flow in upper airways; QCA: airflow between collapsible airway and alveolar space; QDC: airflow between dead space and collapsible airways; RC: collapsible airways resistance; RS: small airways resistance; RSc: RSat V*; RSm: magnitude of (RS-RSc) at minimal alveolar volume; RSa: parameter characterizing curvature of RS; Cji: concentration in region j of species i, where i = O2 or CO2, and j = IS or IC; PPL: pleural pressure;tot,ji: total rate of transfer of species i in region j, where i = O2, CO2,or both (*), and j = lung (L), tissue (T), or brain (B); Tbody: body temperature; TS: standard temperature;ai: tissue disassociation constant of species i, where i = O2, CO2; Dji: diffusing capacity of species i in region j, where i = O2, CO2 and j = membrane (MEM), brain (B), or CSF; Mji: metabolic rate of species i consumption in region j, where i = O2, CO2, and j = tissue (T) or brain (B); Kmyo: myoglobin capacity of O2; K1: linear resistance of upper airways; K2: flow-dependent resistance of upper airways; K3 = magnitude of RCat VC: VC,max; Nseg: number of capillary segments;
Tissue Water Exchange and Lymphatics Model
PLYM: systemic lymphatic pressure; PIC: intracellular fluid pressure; VIS: interstitial fluid volume; VIC: intracellular fluid volume; VLYM: systemic lymphatic volume; PIS: intersti-tial fluid pressure; QLYM,d: systemic lymphatic flow (distal); QLYM,p: systemic lymphatic flow (proximal); QF,tot: total water flux across capillary; QIC: intracellular fluid flow; RIC: intracellular flow resistance; KF: filtration coefficient;
Neural Model
Fb: baroreceptor frequency; Fs: pulmonary stretch receptor frequency; Fc: chemorecep-tor frequency; Fcc: central chemoreceptor frequency; FHRs: normalized frequency of sympathetic control of HR; FHRv: normalized frequency of vagal control of HR; Fcon: normalized sympathetic efferent discharge frequency controlling contractility; Fvaso: normalized sympathetic efferent discharge frequency controlling vasomotor tone; Kf: baroreceptor neural parameter;θs: for low pass filtering of pulmonary stretch receptor frequency; Ecl: for low pass filtering of peripheral chemoreceptor signal; Ecc: for low pass filtering of central chemoreceptor signal; EHRv: for low pass filtering of vagal con-trol of HR signal; EHRs: for low pass filtering of sympathetic control of HR signal; Econ: for low pass filtering of contractility signal; Evaso: for low pass filtering of vasomotor tone signal; Kchm: chemoreceptor variable;
Cerebral Circulation and Gas Exchange Model