4D Graph-Based Segmentation
for Reproducible and Sensitive
Choroid Quantification From
Longitudinal OCT Scans
The Harvard community has made this
article openly available.
Please share
how
this access benefits you. Your story matters
Citation
Oguz, Ipek, Michael D. Abramoff, Li Zhang, Kyungmoo Lee, Ellen
Ziyi Zhang, and Milan Sonka. 2016. “4D Graph-Based Segmentation
for Reproducible and Sensitive Choroid Quantification From
Longitudinal OCT Scans.” Investigative Ophthalmology & Visual
Science 57 (9): OCT621-OCT630. doi:10.1167/iovs.15-18924. http://
dx.doi.org/10.1167/iovs.15-18924.
Published Version
doi:10.1167/iovs.15-18924
Citable link
http://nrs.harvard.edu/urn-3:HUL.InstRepos:30371062
Terms of Use
This article was downloaded from Harvard University’s DASH
repository, and is made available under the terms and conditions
applicable to Other Posted Material, as set forth at
http://
nrs.harvard.edu/urn-3:HUL.InstRepos:dash.current.terms-of-use#LAA
Special Issue
4D Graph-Based Segmentation for Reproducible and
Sensitive Choroid Quantification From Longitudinal OCT
Scans
Ipek Oguz,
1–3Michael D. Abramoff,
1,2,4Li Zhang,
2Kyungmoo Lee,
2Ellen Ziyi Zhang,
5and
Milan Sonka
1,21Department of Ophthalmology and Visual Sciences, The University of Iowa, Iowa City, Iowa, United States 2Iowa Institute for Biomedical Imaging, The University of Iowa, Iowa City, Iowa, United States
3Department of Radiology, University of Pennsylvania, Philadelphia, Pennsylvania, United States 4Veterans Affairs Medical Center, Iowa City, Iowa, United States
5Wellman Center for Photomedicine, Massachusetts General Hospital and Harvard Medical School, Boston, Massachusetts, United
States
Correspondence: Ipek Oguz, Penn Image Computing & Science Lab (PICSL), 3700 Hamilton Walk, 6th Floor, Philadelphia, PA 19104, USA; [email protected]. Submitted: December 14, 2015 Accepted: September 24, 2016 Citation: Oguz I, Abramoff MD, Zhang L, Lee K, Zhang EZ, Sonka M. 4D graph-based segmentation for reproducible and sensitive choroid quantification from longitudinal OCT scans.Invest Ophthalmol Vis Sci. 2016;57:OCT621–OCT630. DOI: 10.1167/iovs.15-18924
PURPOSE. Longitudinal imaging is becoming more commonplace for studies of disease progression, response to treatment, and healthy maturation. Accurate and reproducible quantification methods are desirable to fully mine the wealth of data in such datasets. However, most current retinal OCT segmentation methods are cross-sectional and fail to leverage the inherent context present in longitudinal sequences of images.
METHODS. We propose a novel graph-based method for segmentation of multiple three-dimensional (3D) scans over time (termed 3Dþtime or 4D). The usefulness of this approach in retinal imaging is illustrated in the segmentation of the choroidal surfaces from longitudinal optical coherence tomography (OCT) scans. A total of 3219 synthetic (3070) and patient (149) OCT images were segmented for validation of our approach.
RESULTS.The results show that the proposed 4D segmentation method is significantly more reproducible (P < 0.001) than the 3D approach and is significantly more sensitive to temporal changes (P < 0.0001) achieved by the substantial increase of measurement robustness.
CONCLUSIONS.This is the first automated 4D method for jointly quantifying choroidal thickness
in longitudinal OCT studies. Our method is robust to image noise and produces more reproducible choroidal thickness measurements than a sequence of independent 3D segmentations, without sacrificing sensitivity to temporal changes.
Keywords: image segmentation, choroid, OCT, multilayered graph search
L
ongitudinal studies of the retina and choroid using series of optical coherence tomography (OCT) images offer a uniquely powerful view into the dynamic changes of retinal and choroid anatomy over the course of a study.1–4Comparedwith the large intersubject variability in cross-sectional studies, within-subject measurements allow more precise quantification of change over time. This is of great interest both for quantifying disease progression and in studies of aging.
Currently existing image analysis methods for OCT do not fully leverage the available data in such studies. Most existing approaches are either two-dimensional (2D) or 3D4–8and treat
the OCT images from different time points completely independently. These methods rely on statistical analysis for exploring the relationship of the time points with each other. Recently, a new approach that considers the longitudinal time sequence during image analysis was proposed9; however, this
method appears to suffer from temporal over-regularization as it can only detect small temporal changes. Such over-regularization is a concern in many longitudinal analysis methods, which aim to reduce the measurement discrepancies between time points by using temporal regularization; such
over-regularization can be seen as preferring no or limited changes over time for which the allowed changes would not reflect the true changes of anatomy/pathology over time. Although temporal regularization is indeed useful to reduce measurement noise and increase reproducibility, in the extreme cases, over-regularization would result in an inability to detect actual temporal changes present in the data, which is clearly undesirable. In summary, no method currently exists for a successful 4D (3Dþtime) image quantification of longitudinal OCT scans that adequately balances the need to detect small changes over time with the need for consistent measurements between time points.
We present a novel 4D approach for simultaneous graph-based segmentation in longitudinal studies. It is capable of simultaneously segmenting multiple surfaces from all the time points associated with a subject in a globally optimal manner while satisfying the topology and smoothness constraints specified at each time point.
We illustrate this new method in application to the segmentation of the choroid. The choroid is the vascular plexus between the retina and the sclera that forms a vascular system,
iovs.arvojournals.orgjISSN: 1552-5783 OCT621
which is crucial for oxygenation and metabolic activity of the retina.10,11Choroidal thickness is an important retinal
biomark-er that is affected in many diseases of the retina, for example, in AMD,12in response to anti-VEGF therapy in diabetic macular
edema,13 and in healthy aging.14 However, because of
absorption by the RPE, the choroid is prone to low signal-to-noise ratio (SNR) in OCT scans and is therefore challenging to segment,15–18even in swept-source OCT, which is designed to
increase SNR in the deeper layers. This is especially problem-atic in longitudinal studies where small changes in the noise appearance between images from different time points may lead to highly inconsistent surface positioning between time points, reducing statistical power in studies.
Validation of the proposed algorithm is done using patient OCT scans and synthetic experiments. We show that the 4D approach successfully leverages the inherent redundancy in longitudinal image series to reduce measurement noise and leads to better automated quantification of OCT images. As discussed above, an important concern for longitudinal segmentation algorithms is the danger of over-regularization in the temporal domain; we demonstrate that our approach successfully enforces temporal coherence without overly regularizing by showing its effectiveness in detecting temporal differences.
M
ETHODSSubjects and Data Collection
Longitudinal sequences of spectral-domain (SD)-OCT images from a cohort of 15 AMD patients (age: 78.2 6 9.6 years) diagnosed with choroidal neovascularization were used for the sensitivity experiment and the synthetic experiments. Age-related macular degeneration and its complications are not the subject of this study on 4D choroidal segmentation; rather, this specific cohort was chosen because of the large number of well-characterized OCT images that are available.
The image acquisition was done while the patients underwent an initial 12-week induction phase of anti-VEGF treatment, during which injections and imaging were uniform for all patients. The induction phase was defined as the process of administration of three intravitreal injections at 4-week intervals (weeks 0, 4, and 8) supplemented by OCT imaging sessions every 2 weeks for a total of seven scans per patient, or 105 OCT volumes overall.
Image acquisition was performed using a Topcon swept-source OCT scanner (Topcon, Paramus, NJ, USA), centered on the fovea of the retina. The device acquires anisotropic 3D OCT images having 51231283885 voxels with 11.72346.88 32.6-lm3spacing and covering a volume of 63632.3 mm3.
A second set of images was obtained from a separate cohort of 22 glaucoma patients that were scanned twice within a 3-month period for a reproducibility study (average time between two scans: 44627 days), for a total of 44 3D OCT volumes. This dataset was used in the reproducibility experiment. Image acquisition was performed using a Heidel-berg Spectralis OCT scanner (HeidelHeidel-berg Spectralis; HeidelHeidel-berg Engineering, Heidelberg, Germany), centered on the fovea of the retina. The device acquires anisotropic 3D OCT images of 6137683496 voxels with 127.193311.29133.872-lm3
spacing, and covering the volume of 7.7638.6731.92 mm3.
This research followed the tenets of the Declaration of Helsinki. Written informed consent was obtained from the subjects after explanation of the nature and possible conse-quences of the study. The research was approved by the institutional human experimentation committee or institution-al review board.
Initialization
The location of Bruch’s membrane (BM) is needed as input for initializing the choroidal segmentation approach. For this purpose, the OCT volumetric images were segmented individ-ually using our previously reported Iowa Reference Algorithm that yielded 11 intraretinal surfaces.6,19–23Because the retinal
angle between the incident light and subject’s optical axis varied in OCT volumetric images, some geometric distortion occurs in the choroidal layer. An angle adjustment approach24
was applied to the original OCT volumes to overcome this. Bruch’s membrane was transformed to a relatively symmetrical surface in the OCT images, and then the BM was modeled as a convex arc on each B-scan, and the curvature of this arc was computed using the average axial length of a human eyeball. A single surface graph-search method was used to segment BM by utilizing this arc model as shape-prior information.19 The
OCT volumes were then flattened using the BM surface. The flattened scans from all time points are aligned such that the horizontal line representing the (flat) BM surface is at the same position in each volume. No within-plane alignment was necessary in the presented experiments because all scans were carefully centered on the fovea; however, other datasets with greater foveal location variability may need this as an additional preprocessing step.
The resulting flattened images and the BM surfaces were used as input to both the cross-sectional (3D) and longitudinal (4D) segmentation approaches described below.
Prior Work: 3D Graph Segmentation
The 3D segmentation of the choroid4,8 was done using the
LOGISMOS framework.25We begin by cropping the flattened
OCT image to a sufficiently large region of interest underneath the BM surface. The empirically determined size of the crop region was 489 lm (188 voxels) in the anterior–posterior direction. Twenty-one micrometers of this region was anterior to the BM surface, to allow for recovery from any errors in the BM initialization. For computational efficiency, as well as to alleviate the anisotropy of the acquisition protocol, this cropped image was down-sampled by a factor of (23431) in the inferior–superior, anterior–posterior, and nasal–temporal directions, respectively. A median filter was used in a one-voxel neighborhood to reduce noise.
A multisurface graph-cut approach was used to jointly segment the lower and the upper boundary of the choroid region. For this purpose, we constructed a graph such that each image voxel is represented by a graph node. Neighboring voxels in the anterior–posterior direction are grouped together in graph columns, connected to each other via intracolumn arcs. Neighboring voxels in the nasal–temporal and inferior– superior directions are represented by neighboring graph columns, connected to each other by intercolumn arcs, which encode hard and soft constraints for spatial smoothness. Two identical copies of this graph were created to represent the two surfaces of the choroid; these two graphs are connected to each other via intersurface arcs, which encode the minimum and maximum allowed distance between the two surfaces. An edge-sensitive image derivative filter along the posterior– anterior direction was used to determine the cost at each graph voxel. The graph thus constructed was optimized using the LOGISMOS framework25 to obtain the optimal surface
segmentations.
Proposed Method: 4D Graph Segmentation
The proposed 4D method jointly segments the upper and lower surfaces of the choroid fromNtime points, that is, 2N
surfaces are segmented simultaneously. The preprocessing of each image, including the flattening, cropping, and down-sampling, was identical to the 3D approach.
Because the graph construction for the 4D segmentation assumes spatial correspondence between the images from different time points, the images were first registered to each other. The anterior–posterior registration was provided implic-itly by the image flattening step, based on the BM surface. For in-plane registration, all images were centered on the patient’s fixation.
The graph construction for the 4D segmentation was different than the 3D approach. Each image was represented by a subgraph constructed as described in the 3D segmenta-tion, using the intracolumn, intercolumn, and intersurface arcs. These subgraphs were connected to each other using novel inter–time point arcs to encode temporal constraints between consecutive time points. In particular, for each ver-texvs;ti(x,y,z), wheresdenotes the surface ID (lower or upper choroid),tidenotes theith time point, and (x,y,z) denotes the spatial coordinates, the following infinite-weighted arcs were added: vs;tiðx;y;zÞ;vs;tiþ1ðx;yþMaxt;zÞ ; ð1Þ vs;tiðx;y;zÞ;vs;ti1ðx;yMint;zÞ : ð2Þ
Equation 1 encodes the maximum allowed vertical dis-placement constraint between two consecutive time points, whereas Equation 2 encodes the minimal allowed vertical displacement constraint. For the choroid, for all presented experiments, Mintand Maxtwere set to [2,2] node intervals for the upper choroid surface and [5,5] node intervals for the lower choroid surface. These empirically determined settings indicate that each surface can move anteriorly or posteriorly independently. The choroid region bound by these two surfaces can thus thin or thicken by up to seven node intervals. Because the graph is constructed in the down-sampled image space, this corresponds to 72.8-lm thinning or thickening between consecutive time points, which is clinically reasonable.
It is important to realize that the arcs used to enforce these temporal constraints carry infinite weight and are therefore hard constraints, that is, thresholds on what is considered a feasible solution of the graph. This is in contrast to soft constraints, represented by finite-weighted arcs, which penal-ize large displacements. Such soft temporal constraints were avoided in our approach as they introduce a segmentation bias by preferring smaller displacement, which may reduce the temporal sensitivity of the segmentation algorithm.
We note that the temporal constraint for the upper surface was chosen to be more strict because the spatial registration was based on the BM surface, which is immediately next to this upper choroid surface. The lower choroid surface, which is farther away, is assigned a more relaxed temporal regulariza-tion threshold.
GivenNlongitudinal OCT volumes fromNtime points, allN subgraphs are connected to each other using the inter–time point arcs described above, to result in a single complex graph that represents the segmentation problem for allNtime points. The segmentation is then carried out using a single graph-cut on this complex graph to achieve simultaneous segmentation of the 2Nsurfaces.
Reproducibility Experiment on Synthetic Data
To assess the reproducibility and robustness to noise of our novel 4D choroid segmentation method, we conducted a simulation study. Starting with patient OCT images, increasing
levels of random speckle noise was synthetically introduced. The choroid was segmented independently (3D) and jointly with the proposed 4D method from pairs of noisy images. We report both the surface positioning reproducibility and choroid thickness reproducibility.
Speckle Noise Simulation.The primary type of noise in OCT images, which derives from the low coherence light source, is speckle,26which is equivalent to additive Gaussian
noise in the linear scale. To simulate noisy OCT images, we first converted the real 16-bit OCT images to decibel scale, by linearly scaling the intensities such that the voxel intensity range corresponded to the dynamic range of the OCT camera. The dynamic range of our OCT camera was empirically determined to be 42 dB. Then, the image was de-logged to convert it to linear scale, according to
Ilinear¼10ðIdB=10Þ: ð3Þ
In this linear scale, additive Gaussian noise of the desired SD was introduced to the image. Finally, the images were brought back to their original scale, by first re-logging them according to
IdB¼103log10ðIlinearÞ ð4Þ and then scaling them back up to 16-bit OCT image range.
Dataset.The OCT scans from the first time point for each of the 15 AMD patients were chosen as the starting points for this experiment. For each subject, for each noise level, 10 noisy copies of the image were created by introducing randomized speckle noise. These 10 images were split into five pairs. Each such pair was segmented both independently in 3D and jointly in 4D. This process was repeated for 13 different noise levels (r ¼ 1, 3,. . ., 25), where the noise level is the SD of the Gaussian additive noise in the linear scale as described above. A total of 1530313¼1950 synthetic images were thus used in this experiment. For a fair comparison, the initial BM surface was computed only once per subject, on the real image (before addition of any speckle noise); this surface was used as input to both 3D and 4D segmentation methods.
Analysis. Because the underlying retinal and choroidal anatomy is the same for a given pair, these pairs can be considered as a test–retest setup; therefore, the segmentation results should be ideally identical. Thus, any discrepancies are purely due to noise and are reported as reproducibility error. In particular, we report the reproducibility error associated with the surface positioning of the lower choroid boundary and choroid thickness. Paired t-tests between 3D and 4D segmen-tation reproducibility errors are used to assess statistical significance. We also present scatter plots of test–retest thickness measurements and report the correlation between these values at each noise level for 3D and 4D.
Complete segmentation failures were excluded from analysis. We empirically determined that an average reproduc-ibility error of>100lm indicated such cases.
Temporal Sensitivity Experiment on Synthetic Data
To assess the sensitivity of our novel 4D choroid segmentation method to detect temporal changes, we conducted a synthetic simulation study. Starting with patient OCT images, random amounts of deformation in the anterior–posterior direction were added to the choroid and surrounding regions to simulate thinning and thickening, which may happen in real data from reasons such as disease progression, drug effects, or aging. The choroid was segmented independently (3D) and jointly (4D) from the resulting images. Because the artificially introduced
deformation amount is known, we use this dataset to quantify the sensitivity of each algorithm.
B-Spline Deformation.Given a real OCT image, a series of eight synthetically deformed images was created for each trial, representing a sequence of eight time points. At each time pointti(i¼0. . .8, witht0 designating the real OCT image), a
target thinning rateaiwas generated as a random sample from a uniform distribution between [25,25]lm, with a negativea denoting a thinning choroid and a positive a denoting a thickening choroid. These bounds for ai were chosen to represent a wide range of changes that can be realistically observed in the choroid. A B-spline grid with 13 nodes in each dimension is created to represent the whole OCT image domain. This grid density was empirically chosen to give adequate resolution, such that the choroid and surrounding regions can be manipulated separately from the rest of the image domain. The B-spline deformation was set to 0 outside the choroid region of interest (ROI), which is represented by two rows of grid nodes around the choroid. The B-spline grid is illustrated in Figure 1a. Inside the choroid region, each grid node (x,y) was assigned a local thinning amountbi,(x,y), which
was randomly drawn from a uniform distribution between [0,2jaij]. Then, the vertical displacement at the grid node corresponding to the top row of the choroid ROI was set to bi,(x,y), and at the grid node corresponding to the bottom row
of the choroid ROI, it was set tobi,(x,y), for positiveai. The vertical displacement values were reversed for negativeai. We note that this corresponds to a local displacement of 2bi,(x,y).
Figure 1b shows these local displacements of the B-spline nodes. The smooth deformation field represented by the B-spline simulation ensures that the region surrounding the true choroid is stretched or compressed to accommodate the desired motion of the choroid itself.
At each time point ti, the random deformation field thus computed was applied to the image atti1. Figures 1c and 1d
show the thickening simulation for a particular B-scan from the experiment. We note that the aiare independent from each other; in practice, this means a time sequence can have alternating thinning and thickening periods, at varying rates of deformation. We chose this approach rather than consistent thinning or consistent thickening to obtain a wider range of situations that may occur in real clinical data based on disease progression and treatment schedule.
Dataset.Similar to the reproducibility experiment, the real OCT scans from the first time point for 14 AMD patients were used as the starting points t0 for the sensitivity experiment.
One subject was excluded from this study as it had a very thin choroid, which occasionally led the choroidal layer to collapse to a line locally when a random deformation was applied. This resulted in an inability to create a synthetic 4D dataset and does not indicate a choroidal thickness measurement limitation of the reported image segmentation method. For each subject, 10 trials were conducted. For each trial, eight randomly deformed images were generated as described above. These images att1,. . .,8were segmented both independently in 3D and
jointly in 4D. A total of 1431038¼1120 synthetic images were thus used in this experiment. For a fair comparison, the initial BM surface was computed only once for each deformed image and used as input to both 3D and 4D segmentation algorithms.
Analysis.The known synthetic deformation field is used to compute the ground truth for choroid thickness changedtrue(i)
between time pointstiandti1, by summing the localbi,(x,y)s. It
is important to note that, although these relative thickness changes are known between time points, the absolute choroid thickness at any given time point is unknown, because we do not have the ground truth at t0. For assessing the temporal
sensitivity of the two methods, we compute the choroid thickness at each time point using the 3D and 4D segmentation results, and we reportd3D(i)dtrue(i) andd4D(i)dtrue(i) as
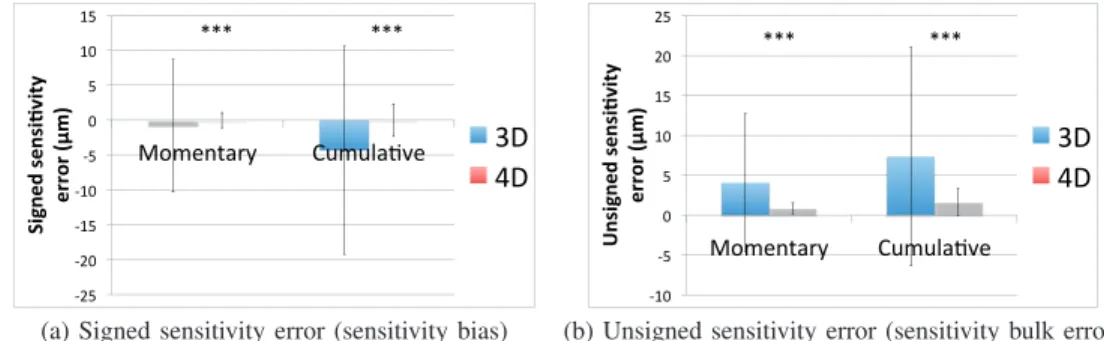
momentary sensitivity errors. Both signed and unsigned differences are reported. In this context, signed error represents a measurement bias in sensitivity, whereas unsigned error represents the bulk measurement error. In addition to these momentary thickness changes, we also consider cumu-lative thickness changes, Dtrue(i), D3D(i), and D4D(i), which
represents the total change between time points ti and t0,
computed asPit¼1dðtÞ. Paired t-tests are used to statistically compare the findings.
Glaucoma Cohort for Reproducibility
To assess the reproducibility achieved by our algorithm in a clinical dataset, we leveraged the test–retest glaucoma dataset. For each of the 22 subjects in this cohort, the two OCT volumes were segmented cross-sectionally (3D) and
longitudi-FIGURE1. B-spline deformation method for the synthetic sensitivity experiments. (a) A regular grid 13313313 B-spline node is created. The
nodes that approximately correspond to the choroid region (red circles) are deformed, whereas the other nodes remain stationary (black circles). (b) For thickening simulations (positivea), the B-spline nodes in the choroid region move away from each other vertically (shown), whereas for thinning simulations (negativea), they move toward each other. Note that the local deformation amount is randomly selected, allowing more realistic local thinning/thickening effects rather than a global shrinking of the choroid at a constant rate. (c,d) Thickening simulation example. (c) B-scan from the original image. (d) The same B-scan with a synthetically thickened choroid.Blue arrowshighlight a visibly enlarged vessel, whereas other regions of the B-scan show more modest amounts of deformation.
nally (4D). The comparison of the results from the two approaches offers additional insights regarding the effect of the temporal constraints proposed in our algorithm. Given the short time period between the two scan acquisitions and the very slowly progressing character of the glaucoma disease, no changes to the underlying choroidal anatomy are expected within 3 months for any given subject. Thus, similar to the synthetic reproducibility experiment we presented earlier, any thickness discrepancies would be purely due to noise and are reported as thickness reproducibility error. Similar to the synthetic experiment, we present scatter plots of test–retest thickness measurements and report the correlation between these values and the respective regression equations.
Age-Related Macular Degeneration Cohort for Sensitivity
Finally, to assess the performance of our algorithm in a clinical dataset with respect to sensitivity, we analyzed the longitudinal AMD data. For each of the 15 subjects in the study, the 7 OCT images were segmented cross-sectionally (3D) and longitudi-nally (4D), for a total of 105 images. The resulting choroidal thickness measurements are compared between the two methods, including the mean choroidal thickness (over time points) per patient, the SD of choroidal thickness (over time points) per patient, and the slope of the temporal change (i.e., change in thickness divided by total study time) per patient. This temporal slope represents an estimate of the true
anatomical change, whereas the SD of choroid thickness measurement between time points (for a given subject) represents a combination of measurement noise and true anatomical change. Our hypothesis was that longitudinal 4D segmentation would result in lower noise (smaller SD) but will retain its temporal sensitivity (same slope). Pairedt-tests were used for statistical comparison.
R
ESULTSReproducibility Experiment on Synthetic Data
Figure 2 presents the results of the reproducibility experiment. Given the pairs of synthetically generated noisy images, Figure 2a presents the reproducibility error in the lower choroid boundary location, whereas Figure 2b presents the reproduc-ibility error in choroid thickness measurement. The asterisk denotes highly significant statistical differences (P < 0.001) between 3D and 4D segmentation methods; 4D segmentation was significantly more reproducible than 3D segmentation at each tested noise level, in terms of both surface positioning and thickness measurement. For eight pairs of images, 3D segmentation results were excluded due to segmentation failure.
Figure 3 presents the consistency of the thickness measurements in the reproducibility experiment. For each pair of noisy images, the average choroid thickness for the first
FIGURE2. Choroid segmentation reproducibility in the presence of simulated speckle noise. (a) Lower-choroid surface position reproducibility
error (lm) per noise level (rof Gaussian kernel). Longitudinal (4D,red) segmentation resulted in significantly more reproducible surfaces (P< 0.001) than cross-sectional (3D,blue) segmentation for each tested noise level. (b) Choroid thickness reproducibility error (lm) per noise level. Four-dimensional segmentation led to significantly more reproducible thickness measurements (P<0.001) than 3D segmentation for each tested noise level. Note that theerror barsfor the 4D plots are difficult to see because of their small scale.
FIGURE3. Choroid thickness consistency in the presence of simulated speckle noise. (a) Test–retest choroid thickness measurements (lm) for
cross-sectional (3D) segmentation.y¼xline is shown for reference. (b) Test–retest choroid thickness measurements (lm) for longitudinal (4D) segmentation.y¼xline is shown for reference. (c) Correlation of test–retest choroid thickness measurements per noise level (rof Gaussian kernel). High correlation corresponds to highly consistent measurements. Four-dimensional (red) measurements were significantly more consistent than 3D (blue) measurements (P<0.002).
image is plotted against the average choroid thickness for the second image. Figure 3a presents this test–retest scatter plot for cross-sectional (3D) segmentation, whereas Figure 3b shows longitudinal (4D) segmentation results; results from all noise levels are pooled together for this figure. The dramatic improvement in measurement consistency afforded by 4D segmentation is evident from these plots. Figure 3c presents the correlation between these test–retest thickness measure-ments per noise level. The correlation measures for 4D segmentation were significantly higher (P < 0.002) than for 3D segmentation.
Temporal Sensitivity Experiment on Synthetic Data
The Table and Figure 4 summarize the results of the sensitivity experiment using the synthetic deformation fields. For both signed and unsigned error metrics, the 4D approach was significantly more sensitive to temporal change than the 3D approach (P < 0.001), both for momentary and cumulative time intervals.
Figure 5 shows the scatter plots of the automatically measured momentary choroid thickness changes against the known deformation amounts, using the 3D and 4D approach-es. The correlation between the momentary d3D and dtrue(i)
was R2¼0.299, compared with a correlation of R2¼0.970
between momentaryd4Danddtrue(i). Similarly, the correlation
between the cumulative D3D and Dtrue(i) was R2 ¼ 0.288
compared with a correlation ofR2¼0.975 between cumulative
D4DandDtrue(i).
Figure 6 presents the results qualitatively for a single trial. The first four randomly deformed images are shown in column a. The same surface is overlaid in red on these images to help assess the temporal change; it can be clearly seen that the image at t1 has a thicker choroid than the images at t2–t4,
especially on the nasal side of the image. Quantitatively, the true change in thickness wasdtrue(1)¼12lm,dtrue(2)¼1lm,
and dtrue(3)¼ 2lm. The 3D and 4D segmentations for the
lower choroid boundary are shown in column b. Although the two methods closely agree att1, the 3D segmentation results
are very poor at t2 and t3, where they capture the wrong
surface, presumably due to local noise and poorly defined boundaries. At t4, the 3D segmentation captures the lower
choroid surface on the nasal side of the image but again fails on the temporal side. The 4D segmentation leverages temporal regularization to generate reliably correct results at all four time points.
However, the temporal regularization does not prevent the 4D algorithm from capturing true temporal change present in the data. This is illustrated in Figure 6c, which shows the 4D segmentation results for the four time points overlaid on top of each other. It can be clearly seen that the lower choroid surface att1is substantially different than the later time points [d4D(1)
¼10lm], in agreement with thedtrue(1) value. In contrast, the
thre surfaces corresponding to the time pointst2–t4are nearly
identical, which agrees with the near-zerodtruevalues for these
time points. As shown in Figure 4, these anecdotal findings were also found to be statistically significant in quantitative analysis.
Glaucoma Cohort for Reproducibility
Figure 7 illustrates the results of the thickness reproducibility experiment in the glaucoma cohort. Figures 7a and 7b present the test–retest thickness measurements in the cross-sectional (3D) and longitudinal (4D) measurements, respectively. The test–retest correlation wasR2¼0.54 for the 3D approach (y¼
1.69x60.38) andR2¼0.99 for the 4D approach (y¼1.02x
1.82). Note that despite allowing quite dramatic changes of surface positioning along the temporal direction (liberal temporal context constraints Mint and Maxt), the slope and intercept of the regression line are virtually indistinguishable from 1 and 0, respectively. This further confirms both the hypothesized excellent performance of the 4D approach and also the validity of our expectation that choroidal thickness is not changing within 3 months in patients with glaucoma. Figure 7c further shows the thickness reproducibility error (i.e., the absolute difference between the test and retest thickness measurements). The mean and SD of the thickness reproducibility error was 35.6682.0lm for the 3D approach TABLE. Sensitivity Error
Method
Signed Unsigned
Momentary Cumulative Momentary Cumulative
3D (cross-sectional) 0.869.5 4.3614.9 4.068.6 7.3613.7
4D (longitudinal) 0.061.1 0.062.3 0.860.7 1.661.7
Four-dimensional segmentation was highly significantly more sensitive than 3D segmentation in all compared measurements (P<0.001) in all pairedt-tests.
FIGURE4. Sensitivity error. In the temporal sensitivity experiment where the choroid is synthetically deformed, we report the detected temporal
thickness change compared to the ground truth (the true amount of vertical deformation synthetically introduced) as the sensitivity error. Four-dimensional segmentation was highly significantly more sensitive than 3D segmentation in all compared measurements (P<0.001 in pairedt-tests).
FIGURE5. Sensitivity to temporal changes in choroidal thickness. All units are micrometers. (a) Changes in choroid thickness measurements for cross-sectional (3D) segmentation compared with the known synthetic deformation amount. The same data is presented inbafter thresholding and zooming to the [15,15]-lm range, for a fair comparison with 4D. (c) Changes in choroid thickness measurements for longitudinal (4D) segmentation compared with the known synthetic deformation amount. The Pearson correlation coefficients wereR2¼0.299 for 3D andR2¼0.970
for 4D.
FIGURE6. Choroid segmentation in a synthetically deforming time sequence. Four consecutive time points are shown in subsequent rows. (a)
Deformed OCT image at that time point. The choroid surface att4is overlaid on each image to help highlight the temporal changes. Thet1image can
be appreciated to have a thicker choroid than thet2t4images, especially on the nasal side. (b) The 3D (blue) and 4D (red) lower choroid surfaces at
each time point, overlaid with the deformed OCT image at that time point. The two methods closely agree in thet1image. Att2andt3, the 3D
segmentation fails throughout most of the B-scan (except in the center) and captures the upper boundary of the choroid rather than the lower boundary. Att4, the 3D segmentation is successful in only the temporal side of the image and locks onto the wrong surface in the nasal side.
Four-dimensional segmentation (red) leverages temporal regularization to successfully segment all four time points. (c) The 4D segmentations from each time point are overlaid on thet1OCT image (different shades of redrepresent different time points). It can be clearly seen that thet1segmentation
is substantially different than thet2t4segmentations, with more pronounced thickening in the temporal side than in the nasal side, in accordance
with the data. This illustrates that the temporal regularization is not an obstacle to sensitivity to temporal change actually present in the data.
compared with 3.762.3lm for the 4D approach. Similar to the results from the synthetic experiments, the dramatic improvement in reproducibility afforded by the longitudinal approach is clearly evident in these results.
Age-Related Macular Degeneration Cohort for Sensitivity
In the AMD dataset, the mean choroidal thickness (50.6619.3 vs. 49.2615.1lm) and temporal thinning rate (4.2863.11 vs. 7.43 6 9.04 lm/12 wk) were not significantly different between the 3D and 4D methods (P>0.34 for mean thickness, P> 0.22 for temporal slope). The SD of choroidal thickness was significantly different (P<0.001, 2.436 0.92lm in 4D vs. 7.0563.69lm in 3D). The results confirm our hypothesis
that effective longitudinal (4D) analysis reduces measurement noise without sacrificing sensitivity to temporal change.
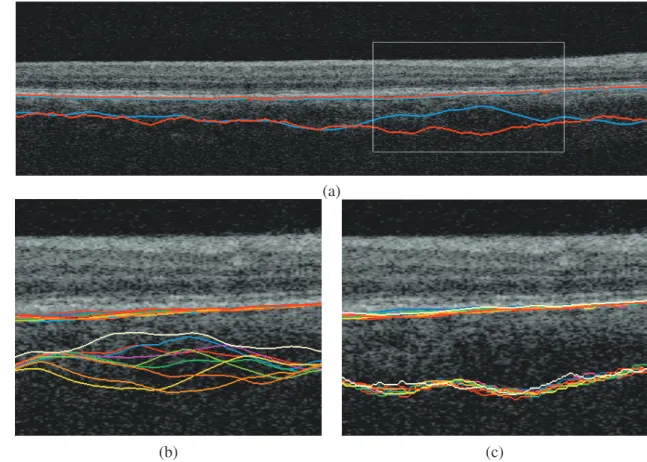
Figure 8 shows the 3D and 4D segmentation results qualitatively for a single subject. Although the 3D and 4D segmentations agree with each other in many places, image regions that present low signal or high noise lead to substantial discrepancies between the methods. In such regions, the 3D segmentation results may differ by up to 280lm locally. Given the lack of evidence of true anatomical change to the choroid in the images, these changes are attributed to measurement noise of the 3D approach. The 4D joint segmentation resolves the discrepancies of 3D segmentation and offers segmentation consistency.
Figure 9 shows the 3D and 4D thickness measurements per patient, over the course of the seven time points. The overall
FIGURE7. Choroidal thickness reproducibility in the glaucoma cohort. All units are micrometer. (a) Test–retest choroid thickness measurements
(lm) for cross-sectional (3D) segmentation. The regression line is shown inblack, and they¼xline is shown incolorfor reference. (b) Test–retest choroid thickness measurements (lm) for longitudinal (4D) segmentation. The regression line is shown inblack, and they¼xline is shown incolor
for reference. (c) Thickness reproducibility error for the two methods. Mean and SD of absolute reproducibility error are shown for each method.
FIGURE8. Choroidal segmentation consistency and accuracy. (a) Four-dimensional (red) and 3D (blue) segmentations are substantially different from each other in areas of high ambiguity (white rectangle). Note that the 3D approach erroneously cuts through choroidal vessels.bandcare zoomed in the region outlined by thewhite rectanglefor visibility. (b) The 3D segmentations at the seven time points for the same subject. (c) The 4D segmentations at the seven time points for the same subject.
patterns are similar between the two methods, for example, the average choroid thickness of each patient and the amount of choroidal thinning over the study duration. However, the temporal 4D thickness functions are appreciably smoother than their 3D counterparts. These findings are also visible in Figure 10, where the same data are presented per method rather than per patient; different colors represent individual patients. Overall thinning is noticeable for both methods; however, 3D measurements are substantially noisier than their 4D counterparts.
The run time of the algorithm was roughly linearly related to the number of time points, and the additional overhead between 4D and 3D segmentation was relatively small. In particular, the run time for the subjects in the synthetic sensitivity study was 13 minutes 36 seconds 61 minute 14 seconds for eight scans in 3D (i.e., 1 minute 42 seconds69 seconds for a single 3D scan) and 16 minutes 37 seconds61 minute 43 seconds for 4D for the joint segmentation of all eight scans, representing less than 20% in computational overhead.
D
ISCUSSIONThe presented results show that our novel 4D longitudinal segmentation algorithm is superior to its 3D counterparts. The temporal regularization afforded by this new method signifi-cantly increases the reproducibility of the results without sacrificing the sensitivity to detect temporal change; in fact, we found that the reduction in error leads to significantly higher temporal sensitivity for 4D segmentation.
In Figure 9, we note that the effect of temporal regularization is more prominent in some patients than in others; this is likely due to the amount of noise and/or the SNR in the choroid region for each particular image. If the temporal measurements obtained with 3D segmentation are reasonably consistent, there is no reason for the 4D measurements to be any different. This also highlights the fact that our 4D method is not biased toward a smaller temporal change. Because the temporal regularization is achieved with‘‘hard’’constraints on maximum allowed displacement rather than‘‘soft’’constraints that penalize larger displacements (such as the approach proposed in Ref. 9), the temporal sensitivity of the method is preserved.
Clearly, to maximize segmentation robustness of the joint longitudinal segmentation approach, availability of more than two time points would be beneficial. Nevertheless, it is noteworthy that the 4D segmentation enjoys substantial performance improvement compared with the cross-sectional 3D segmentation even with only two time points available, as demonstrated in the reproducibility experiments.
By definition, the presented algorithm cannot successfully segment sequences of images that contain larger thickness changes than what the hard constraints used in the graph construction to limit temporal change allow. We found that the value of 72.8 lm was a generous allowance to capture the choroidal changes observed in AMD. However, this parameter may need to be adjusted if the algorithm is applied to studies with dramatic choroidal changes. Additionally, for studies that involve either very long or uneven intervals between time points, it may be beneficial to make this parameter a function of the time elapsed rather than a constant number.
A possible limitation of the algorithm is that it would not be able to recover from a catastrophic failure in the initialization step. However, the BM segmentation algorithm has been previously thoroughly validated and such a major failure is therefore unlikely.
The longitudinal choroid segmentation presented here is the first application of our 4D graph-based segmentation method. Because the choroid region typically has an especially low SNR, the improvement achieved by the proposed 4D segmentation method is very pronounced. Nevertheless, we expect our approach to maintain its superior performance FIGURE9. Choroidal thickness plots per subject. For each of the 15 patients in the AMD study, the average choroid thickness (yaxis,lm) at each time point (xaxis) is shown using the 3D and 4D quantification methods. Although the overall patterns are similar between the two methods, 4D measurements are visibly less noisy than their 3D counterparts due to the effective temporal regularization.
FIGURE10. Average choroidal thickness computed in (a) 3D and (b) 4D. Colors denote individual patients. Both methods capture the choroidal thinning over the course of the study. Four-dimensional results show significantly smaller measurement variability over time.
when segmenting intraretinal layers, which is an extension that remains as future work. Additionally, the relatively flat geometry of the choroid makes it straightforward to carry out synthetic experiments that are crucial for validating the reproducibility and sensitivity of this approach.
Acknowledgments
Supported in part by National Eye Institute Awards R01EY019112 and R01EY018853, National Institute of Biomedical Imaging and Bioengineering (NIBIB) Awards R01EB004640 and P41EB015903, National Cancer Institute award R01CA163528, National Institute of Neurological Disorders and Stroke (NINDS) Award R01NS094456, and the Arnold and Mabel Beckman Initiative for Macular Research.
Disclosure:I. Oguz, None;M.D. Abramoff, IDx LLC (C, I), P;L. Zhang, None;K. Lee, None;E.Z. Zhang, None;M. Sonka, P
References
1. Kadziauskiene A, Kuoliene K, Asoklis R, Lesinskas E, Schmet-terer L. Changes in choroidal thickness after intraocular pressure reduction following trabeculectomy.Acta Ophthal-mol. 2016;94:586–591.
2. Kim JH, Lee TG, Chang YS, Kim CG, Cho SW. Short-term choroidal thickness changes in patients treated with either ranibizumab or aflibercept: a comparative study [published online ahead of print March 7, 2016].Br J Ophthalmol. doi:10. 1136/bjophthalmol-2015-308074.
3. Hirooka K, Saito W, Namba K, et al. Significant role of the choroidal outer layer during recovery from choroidal thicken-ing in Vogt-Koyanagi-Harada disease patients treated with systemic corticosteroids.BMC Ophthalmol. 2015;15:181. 4. Zhang L, Lee K, Niemeijer M, Mullins RF, Sonka M, Abramoff
MD. Automated segmentation of the choroid from clinical SD-OCT.Invest Ophthalmol Vis Sci. 2012;53:7510–7519. 5. Lang A, Carass A, Sotirchos E, Calabresi P, Prince JL.
Segmentation of retinal OCT images using a random forest classifier.Proc SPIE. 2013;8869:pii1667494.
6. Garvin MK, Abramoff MD, Wu X, Russell SR, Burns TL, Sonka M. Automated 3-D intraretinal layer segmentation of macular spectral-domain optical coherence tomography images.IEEE Trans Med Imag. 2009;28:1436–1447.
7. Chiu SJ, Li XT, Nicholas P, Toth CA, Izatt JA, Farsiu S. Automatic segmentation of seven retinal layers in SDOCT images congruent with expert manual segmentation.Optics Express. 2010;18:19413–19428.
8. Zhang L, Buitendijk GHS, Lee K, et al. Validity of automated choroidal segmentation in SS-OCT and SD-OCT. Invest Ophthalmol Vis Sci. 2015;56:3202–3211.
9. Lang A, Carass A, Al-Louzi O, et al. Longitudinal graph-based segmentation of macular OCT using fundus alignment. Proc SPIE. 2015;9413:94130M.
10. Bill A, Sperber G, Ujiie K. Physiology of the choroidal vascular bed.Int Ophthalmol. 1983;6:101–107.
11. Nickla DL, Wallman J. The multifunctional choroid.Prog Retin Eye Res. 2010;29:144–168.
12. McLeod DS, Grebe R, Bhutto I, Merges C, Baba T, Lutty GA. Relationship between RPE and choriocapillaris in age-related macular degeneration. Invest Ophthalmol Vis Sci. 2009;50: 4982–4991.
13. Yiu G, Manjunath V, Chiu SJ, Farsiu S, Mahmoud TH. Effect of anti-vascular endothelial growth factor therapy on choroidal thickness in diabetic macular edema.Am J Ophthalmol. 2014; 158:745–751.e2.
14. Ramrattan RS, van der Schaft TL, Mooy CM, de Bruijn WC, Mulder PG, de Jong PT. Morphometric analysis of Bruch’s membrane, the choriocapillaris and the choroid in aging. Invest Ophthalmol Vis Sci. 1994;35:2857–2864.
15. Tian J, Marziliano P, Baskaran M, Tun TA, Aung T. Automatic segmentation of the choroid in enhanced depth imaging optical coherence tomography images. Biomed Optics Ex-press. 2013;4:397–411.
16. Beaton L, Mazzaferri J, Lalonde F, et al. Non-invasive measurement of choroidal volume change and ocular rigidity through automated segmentation of high-speed OCT imaging. Biomed Optics Express. 2015;6:1694–1706.
17. Danesh H, Kafieh R, Rabbani H, Hajizadeh F. Segmentation of choroidal boundary in enhanced depth imaging OCTs using a multiresolution texture based modeling in graph cuts.Comput Mathematic Methods Med. 2014(2014):479268.
18. Alonso-Caneiro D, Read SA, Collins MJ. Automatic segmenta-tion of choroidal thickness in optical coherence tomography. Biomed Optics Express. 2013;4:2795–2812.
19. Chen X, Niemeijer M, Zhang L, Lee K, Abramoff MD, Sonka M. Three-dimensional segmentation of fluid-associated abnormal-ities in retinal OCT: probability constrained graph-search-graph-cut.IEEE Trans Med Imag. 2012;31:1521–1531. 20. Li K, Wu X, Chen DZ, Sonka M. Optimal surface segmentation
in volumetric images–a graph-theoretic approach.IEEE Trans Pattern Anal Machine Intelligence. 2006;28:119–134. 21. Antony B, Abramoff MD, Tang L, et al. Automated 3-D method
for the correction of axial artifacts in spectral-domain optical coherence tomography images.Biomed Optics Express. 2011; 2:2403–2416.
22. Abramoff MD, Garvin MK, Sonka M. Retinal imaging and image analysis.IEEE Rev Biomed Engineer. 2010;3:169–208. 23. Quellec G, Lee K, Dolejsi M, Garvin MK, Abramoff MD, Sonka
M. Three-dimensional analysis of retinal layer texture: identi-fication of fluid-filled regions in SD-OCT of the macula.IEEE Trans Med Imag. 2010;29:1321–1330.
24. Lee K, Sonka M, Kwon YH, Garvin MK, Abramoff MD. Adjustment of the retinal angle in SD-OCT of glaucomatous eyes provides better intervisit reproducibility of peripapillary RNFL thickness. Invest Ophthalmol Vis Sci. 2013;54:4808– 4812.
25. Yin Y, Zhang X, Williams R, Wu X, Anderson DD, Sonka M. LOGISMOS–layered optimal graph image segmentation of multiple objects and surfaces: cartilage segmentation in the knee joint.IEEE Trans Med Imaging. 2010;29:2023–2037. 26. Schmitt JM, Xiang SH, Yung KM. Speckle in optical coherence