APPENDIX 4: A GUIDE TO UNDERSTANDING STATE CHILD CARE SUBSIDY
PROGRAMS THROUGH ANALYSIS OF PUBLIC AND NON-PUBLIC USE
DATASETS
Wladimir Zanoni
Robert M. Goerge
Chapin Hall Center for Children at the University of Chicago
J. Lee Kreader
Ayana Douglas-Hall
National Center for Children in Poverty, Columbia University
Child Care & Early Education
Research Connections
ACKNOWLEDGEMENTS
Study Team for
Employment and TANF Outcomes for Families Receiving Subsidies in Illinois,
Maryland, and Texas
Chapin Hall Center for Children at the University of Chicago
Lucy Mackey Bilaver
Robert Goerge
Allison Harris
Wladimir Zanoni
National Center for Children in Poverty, Columbia University
Ayana Douglas-Hall
J. Lee Kreader
Ray Marshall Center for the Study of Human Resources, University of Texas
Deanna Schexnayder
Daniel Schroeder
The Jacob France Institute, University of Baltimore
Jane Staveley
Contents
page
Section I: Introduction 4
Purpose of the guidebook 4
Policy questions 4
Evolution and structure of the guidebook 4
Accessing public and non-public use datasets 7
Section II: Selecting data 8
Study population 8
Data sources 9
Data validity 9
Section III: Analyzing public use data and presenting findings 12 1. What are the number and characteristics of families eligible for child care subsidy? 12 Using the PUMS American Community Survey data 12 2. What are the number and characteristics of families receiving child care subsidy? 24 Using the public Child Care and Development Fund administrative data (ACF-801) 25 Section IV: Analyzing non-public use data and presenting findings 31
Child care subsidy administrative data 31
Unemployment insurance administrative data 32
Temporary Assistance for Needy Families administrative data 33 Using data from linked non-public use administrative databases to understand
TANF families participating in the child care subsidy program 34 1. How many mothers in the TANF population are eligible to receive
child care subsidy? How many actually do? 35 2. What kind of child care are TANF mothers who receive child care
subsidies using? 36
3. What is the probability that eligible TANF recipients will take the
child care subsidy within 3 years (12 quarters)? 37 4. What are the characteristics of those most likely to take the child care subsidy? 37 Using data from linked non-public use administrative databases to understand
the effect of child care subsidy program participation on parental employment 39 1. What is the median duration of employment for those TANF mothers
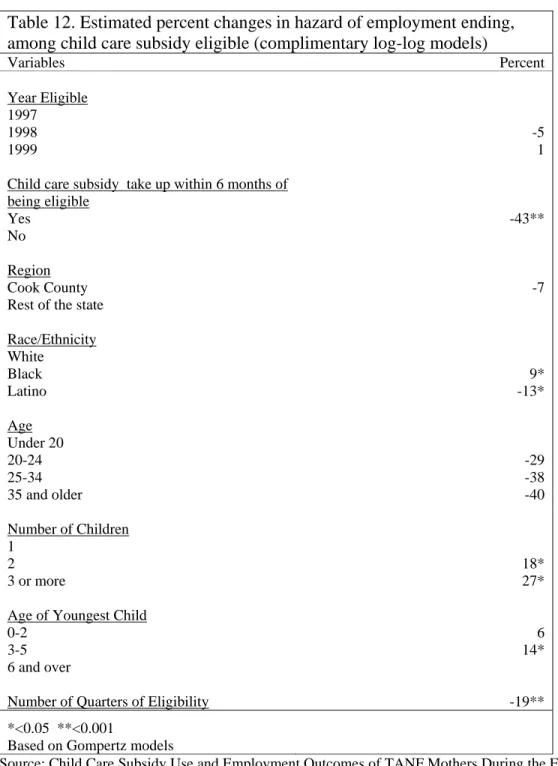
who used the subsidy within 2 quarters of eligibility? 39 2. Among TANF recipients eligible for child care subsidy, how does subsidy
take-up affect the likelihood of employment ending? 40
References 42
Appendices: 34
1 Sample STATA code 43
2 Sample SAS code 52
SECTION I: INTRODUCTION
Purpose of the Guidebook
This guide has been developed to assist researchers in using public and non-public use U.S.
Census Bureau data as well as public and non-public use state administrative data—both
separately and in combinations—to analyze state-specific child care subsidy take-up and
employment of child care subsidy recipients.
Policy Questions
Through analysis of survey data gathered by the Census Bureau and administrative data
generated by state child care subsidy and other programs, researchers can help states answer two
fundamental questions about their subsidy programs.
1.
Who does and does not take up the child care subsidy?
2.
What is the effect of child care subsidy program participation on parental employment?
This guidebook outlines example analyses that states can tailor for their use in addressing these
questions.
Evolution and structure of the guidebook
This guidebook has been developed by members of the research team for a study of
Employment
and TANF Outcomes for Families Receiving Subsidies in Illinois, Maryland, and Texas
.
1The
guide was originally planned to share methodology and examples of analyses from this
pioneering study, the first to merge Non-Public Use American Community Survey (NP ACS)
1
See the forthcoming report, “Employment and TANF Outcomes for Families Receiving Subsidies in Illinois, Maryland, and Texas” (www.researchconnections.org/location/12407).
data from the Census Bureau with non-public use administrative data for child care subsidy,
Unemployment Insurance wage records, and Temporary Assistance for Needy Families. The
American Community Survey does not ask respondents about their child care utilization patterns
or any publicly subsidized child care assistance they may have received in the past year.
Therefore, to obtain the additional attributes needed to answer the research questions of who
does and does not take up child care subsidies, and what is the effect of child care subsidy
program participation on parental employment, merging the non-public use ACS with
administrative data sources was required.
2The guidebook refers to this as the
All Child Care
Eligibles
study.
Non-public use ACS data contain uniquely identifying information such as names and addresses.
The Census Bureau’s Data Integration Division has developed a matching system whereby
records in the ACS files can be linked with individual records in state administrative data bases.
The system uses probabilistic matching to assign a Protected Identity Key (PIK) to survey and
administrative records. The algorithm for the probabilistic match uses names, addresses, and
demographic characteristics to output a set of matches, probable matches, possible matches, and
non-matches. Through the PIK process and other safeguards, the study team protected the
confidentiality of non-public use data from both the Census Bureau and the participating states.
The steps involved in requesting and receiving Census Bureau permission to use and link to the
NP ACS and in accessing the merged data in the Bureau’s Research Data Centers—while
ultimately successful—proved too involved and protracted to describe in a guidebook.
The team therefore decided to use the guidebook to share more accessible methodologies and
example analyses using the Public Use Microdata Sample of the American Community Survey
(PUMS ACS). With all the same variables as the non-public use ACS, except the identifying
information, the PUMS ACS can answer state-specific, point-in-time questions about the number
and characteristics of families
eligibl
e to receive a child care subsidy. See Section III below.
2
The team chose to use the American Community Survey rather than the Census Bureau’s Survey of Income and Program Participation (SIPP) survey—which does gather information on use of public services--because SIPP produces national level estimates for the U.S. population and the project required estimates at the state level.
Section III also explains use of publicly available Child Care and Development Fund state
sample data to answer descriptive, point-in-time questions about the number and characteristics
of eligible families actually
receiving
a child care subsidy.
Section IV offers examples of methodologies and analyses that use non-public state
administrative data (but not non-public Census data) to explore point-in-time and longitudinal
questions about subsidy use and its effects. This section draws on the experience of various
members of the research team in an earlier multi-state study,
Child Care Subsidy Use and
Employment Outcomes of TANF Mothers during the Early Years of Welfare Reform: A
Three-State Study (2004).
3This prior study relied exclusively on non-public use, linked,
individual-level, administrative data in Illinois, Maryland, and Massachusetts to follow a series of TANF
entry cohorts over time. Individuals in the TANF population were defined as eligible for a child
care subsidy if they were working, had a child under the age of 13, and had a household income
below the child care subsidy state eligibility ceiling. Child care subsidy program data were used
to identify those who received the subsidy and those who did not. Unemployment Insurance
(UI) wage record data were used to identify those who are eligible for the child care subsidy
because they had found employment and had wages below the child care subsidy state eligibility
ceiling. UI data were also used to examine individuals’ employment patterns. The guidebook
refers to this earlier report as the
TANF Child Care Eligibles
study
.
3
“Child Care Subsidy Use and Employment Outcomes of TANF Mothers during the Early Years of Welfare Reform: A Three-State Study (2004)”is available at www.researchconnections.org/location/4434
Accessing Public and Non-Public Use Datasets
A number of datasets are available to explore these general policy questions at the state level. As
noted, public use data files, with personal identifiers removed, are sufficient for point-in-time
descriptive analyses that explore the basic characteristics of a population.
•
The Public Use Microdata Sample of the American Community Survey (PUMS ACS) is
available for download from the Census Bureau website
(
http://factfinder.census.gov/home/en/acs_pums_2001.html
) in comma-delimited, PC
SAS and UNIX SAS formats.
•
Similarly, the Child Care and Development Fund state sample data (ACF-801) is widely
available via the Child Care & Early Education
Research Connections
website
(
http://www.researchconnections.org/discover/index.jsp
). Search “ACF”
>
“Datasets”
>
“Any Date” > “Go.”
Non-public use data complete with intact personal identifiers such as Social Security numbers,
names and addresses, are ordinarily essential when researchers need to merge data files at the
individual level. Understandably, confidentiality issues make this information much more
difficult to acquire.
•
The Non-Public Use American Community Survey (NP-ACS) data are available only
through arrangements with the Census Bureau and its Research Data Centers. For more
information on how to access private Census data, visit the Bureau’s Center for
Economic Studies website (
www.ces.census.gov/index.php/ces/researchprogram
).
•
Confidential state administrative micro-data are largely available only through
agreements with state officials. Formal agreements with state agencies are necessary to
ensure data security and controlled data accessibility, understanding variable
measurements, as well as the development of a process for sharing of research results
prior to public dissemination. The non-summary child care subsidy data, Unemployment
Insurance wage record data, and Temporary Assistance for Needy Families (TANF) data
cited in this guidebook were all obtained through data-sharing agreements with the
respective states.
SECTION II: SELECTING DATA
Study Population
Participation in the child care subsidy program affects the budget of an entire household and
therefore influences the labor supply decisions of all its members. Taking this into account, the
analyses in this guidebook - like those in the
All Child Care Eligibles
and
TANF Child Care
Eligibles
studies - select families within a state, not individuals, as the unit of analysis. The
TANF Child Care Eligibles
study used a narrow base population of TANF recipients. In the
All
Child Care Eligibles
study however, the population of reference is broadened and is composed
of all families living within a state’s boundaries.
Those families considered part of the child care subsidy eligible sub-population will differ from
state to state, depending on each state’s child care regulations. Based on Illinois policy, the
example analyses presented in this guidebook broadly define them as families with at least:
(1)
one child under the age of 13, in which all parents living in the
household are working (unless disabled)
and
the combined family
income falls below 50 percent of the State Median Income (SMI); or
(2)
one adolescent parent who is still enrolled in school; or
(3)
one child under 13, in which parents age 21 or older receive Temporary
Assistance to Needy Families benefits and either attend school or
participate in training or a work-related activity;
(4)
one child under 13 with at least one parent who attends college and
works 10 hours a week or more; or
(5)
one foster child under 13.
All other families, while still in the study population, are considered ineligible for participation
in the child care subsidy program, and can therefore serve as a comparison or control group. For
a more comprehensive discussion of how child care subsidy eligible families are defined using
the American Community Survey, see Section III.
Data Sources
This guidebook presents examples of analyses based on publicly available data, as well as more
in-depth example analyses based on non-public use data. The first set of example analyses
presented in Section III utilize public use American Community Survey data (PUMS ACS) and
publicly available state sample Child Care and Development Fund administrative data
(ACF-801). These are presented for researchers not wishing to undertake the lengthy process of
accessing private Census data or who have not entered into data-sharing agreements with their
states. The second set of analyses, presented in Section IV, utilize three private state
administrative databases for public benefits programs—child care subsidy, Unemployment
Insurance wage records, and Temporary Assistance for Needy Families.
Data Validity
Internal Validity
Internal validity is an estimate of how much one can make causal inferences about relationships.
An experimental design was not possible in either the
TANF Child Care Eligibles
or
All Child
Care Eligibles
studies (e.g., eligible families were not randomly assigned to receive, or not
receive the child care subsidy). The lack of random assignment can generate selection bias in the
estimators of the program effect on employment when comparing the mean outcomes between
recipients and non-recipients of state’s child care subsidy programs. Several strategies have been
suggested to deal with the selection problem in observational data through induced
randomization between the two groups by controlling for program participation (two steps
methods) and differencing out observable and unobservable factors that lead to selection
decisions (first difference estimators)
4. Quasi-experimental methods such as using individuals in
waiting lists as a control group have also been suggested. The methods suggested in the
TANF
Child Care Eligibles
and
All Child Care Eligibles
studies do not address the subject of selection
4 Heckman, J.J., R.J. LaLonde and J.A. Smith (1999), The Economics and Econometrics of Active Labor Market Programs, in O. Ashenfelter and D. Card, (eds), Handbook of Labor Economics, North Holland, Vol. 3, 1865-2086.
bias. Instead, the underlying assumption for identification of the program effects is that the
sub-population of eligible families who did not take the subsidy is statistically the same as the
subpopulation of those who did. The extent to which child care subsidy recipients differ from
eligible non-recipients, and consequently the magnitude of the bias, is an empirical matter that
requires careful exploration in future studies.
The selection of time frame and observation of variables along time is also important to the issue
of internal validity. All of the administrative datasets used in the
TANF Child Care Eligibles
and
All Child Care Eligibles
studies were configured to measure program participation in the
common time frames (quarterly, between 1997 and 1999 for
TANF Child Care Eligible
s and
quarterly, between 2000 and 2003 for
All Child Care Eligibles
). The same cannot be said for the
American Community Survey data, which use a series of monthly samples to produce estimates
for the year. In these projects, the rescaling of time intervals to fit duration variables into
quarters (because the UI wage reports are quarterly data) led to the use of “complementary log
log models” which, in duration data models, are suitable to deal with spells defined in terms of
discrete time intervals. At different moments of time some individuals will enter the child care
subsidy program, while some others will leave; individuals’ eligibility statuses will change; ages
of individuals will change; workforce attachment or education level may also change. The
selection of the time frame is guided, among other considerations, by the research question, the
data availability, and the stability of policies that are likely to affect the outcome of interest. Data
on durations (i.e., time remaining eligible without receipt of child care subsidy, time employed
for those who took the child care subsidy) were right censored if spells extend beyond the ending
point of the study, and left censored if spells had already started prior to the start of the study.
External Validity
The issue of external validity concerns the question of generalizability. To what extent can the
conclusions derived from a statistical evaluation be generalized to the larger population?
Because of its large sample size (since 2005 the American Community Survey has covered all
counties in the U.S.), the American Community Survey has produced population and housing
profiles for geographic areas with populations of 65,000 or more beginning with 2006 and, in
2008, three-year period estimates became available for areas of populations of 20,000 or more.
In 2010, five-year period estimates will be available for block groups, census tracts, small towns,
and rural areas.
5However, because the eligibility variable applied to each family in the survey
is derived from state-specific child care subsidy programming rules, results are generalizable to
the examined state only.
5 U.S. Census Bureau (2006), Design and Methodology American Community Survey, U.S. Government Printing Office, Washington, DC. http://www.census.gov/acs/www/Downloads/tp67.pdf
SECTION III: ANALYZING PUBLIC USE DATA AND PRESENTING
FINDINGS—individuals cannot be uniquely identified across data sets
1. What are the number and characteristics of families eligible for a child care
subsidy? Using the PUMS American Community Survey data
Several descriptive analyses of the child care subsidy-eligible (and non-eligible) populations are
possible with the public use files alone. As noted above, the Public Use Microdata Sample of the
American Community Survey (PUMS ACS) is available for download from the Census Bureau
website.
http://factfinder.census.gov/home/en/acs_pums_2001.html
) in comma-delimited, PC
SAS and UNIX SAS formats. Documentation available on the Census Bureau website includes
the American Community Survey Questionnaire, Subject Definitions for the variables derived
from survey items, and a Data Dictionary of codes corresponding to the variables.
Survey Questionnaire: http://www.census.gov/acs/www/Downloads/SQuest.pdf, or
http://www.census.gov/acs/www/SBasics/SQuest/SQuest1.htm
Subject Definitions http://www.census.gov/acs/www/Downloads/2002/usedata/Subject_Definitions.pdf, or
http://www.census.gov/acs/www/UseData/Def.htm
Data Dictionary: http://www.census.gov/acs/www/Downloads/DataDict.pdf, or http://factfinder.census.gov/home/en/acs_pums_2001.html
Using the PUMS American Community Survey data:
The American Community Survey collects socioeconomic and housing information on
approximately three million households nationwide, on an annual basis. It allows researchers to
examine national, state and local population trends. Of particular interest to child care subsidy
researchers, the ACS allows for the enumeration of families and individuals eligible for child
care subsidies in a given year, or over time.
66
The example analyses presented here are based on Illinois data for 2001 and 2005
.
Under
Illinois policy in those years, families with children under 13 years old could be eligible for child
care subsidies in Illinois based on their fulfillment of any one of the following categories:
78Category 1: Low-income, working parents
Category 2: Teen parents
Category 3: TANF parents
Category 4: Non-teen, Non-TANF parents, attending college and working, or in training/work
activity
Category 5: Foster children
Category 1: Low-income, working parents
Low-income, working parents with children under age 13 are the primary beneficiaries of child
care subsidies. Several elements are needed to identify this group including family size, family
income, parental employment status, parental disability and age of children.
Family / Family Size: The Illinois Department of Human Services defines family as all
individuals in a household related by blood or marriage. The American Community
Survey collects data at the household and individual levels and defines a household as a
person or group of people who occupy a housing unit as their usual place of residence. It
is important to note that multiple child care subsidy-eligible families may reside in a
single household. Therefore, researchers using the ACS must first uniquely identify each
family unit themselves, and then count the number of individuals within that unit to
determine its size.
All individuals are classified by their relationship to the householder (reference person)
9in the following 12 categories (REL)
10:
7
Source: Illinois Department of Human Services Child Care Subsidy application documentation. 8
Researchers in other states should obtain the eligibility guidelines for the years of their study from their state lead Child Care and Development Fund agencies. Contact information for these agencies is available from the National Child Care Information and Technical Assistance Center website: http://www.nccic.org/statedata/dirs/display.cfm?title=ccdf. 9 Source: American Community Survey / Puerto Rico Community Survey 2002 Subject Definitions.
(http://www.census.gov/acs/www/Downloads/2002/usedata/Subject_Definitions.pdf, or
bb Not applicable (in group quarters) 00 Reference person 01 Husband / wife 02 Son / daughter 03 Brother / sister 04 Father / mother 05 Grandchild 06 Inlaw 07 Other relative 08 Roomer / boarder 09 Housemate / roommate 10 Single partner 11 Foster child 12 Other nonrelative
Parents in primary families are simply identified as the householder and spouse (REL=00,
01). Their children are the sons or daughters of the household (REL=02).
The sub-families are identified by number, within each household (SFN=01, 02, 03, or
04).
11Individuals within these subfamilies are further classified by their relationships to
one another (SFR):
bb Not applicable (in group quarters) 01 Husband / wife no children 02 Husband / wife with children 03 Parent in parent / children subfamily 04 Child in a married-couple subfamily 05 Child in a mother-child subfamily 06 Child in a father-child subfamily
Suggested procedure to obtain family size
:
1.
Count the number of parents in the family.
For each household’s primary family, the
householder (REL=00) and his/her spouse (REL=01) should be counted as the parents
in the family. Parents in household subfamilies (SFN=01, 02, 03, or 04) are then
designated as the householder. In most cases, this is the person, or one of the people, in whose name the home is owned, being bought, or rented and who is listed on line one of the survey questionnaire. If there is no such person in the household, any adult household member 15 years old and over could be designated as the householder.”
10
Source: American Community Survey / Puerto Rico Community Survey 2006 Subject Definitions. Definition of ‘Relationship to Householder’. (www.census.gov/acs/www/Downloads/2006/usedata/Subject_Definitions.pdf)
11
While the American Community Survey identifies up to four sub-families, the maximum number found in the 2001 PUMS Illinois dataset was two.
counted separately, identified as either a married couple with children (SFR=02) or a
single parent with children (SFR=03).
2.
Count the number of children under age 13.
All children in the primary family are
simply identified through their relationship as the son or daughter of the householder
(REL=02). Children in subfamilies are explicitly identified as children of married
couples (SFR=04), children of single mothers (SFR=05), or children of single fathers
(SFR=06). This group, regardless of household family level, will be limited to those
under age 13 (AGEP<13).
3.
Count the number of children 13 through 20 years old.
Again, all children in the
primary family are simply identified through their relationship as the son or daughter
of the householder (REL=02) and children in sub-families are explicitly identified as
children of married couples (SFR=04), children of single mothers (SFR=05), or
children of single fathers (SFR=06). In the primary families, this group will be
limited to those ages 13 through 20 years old (AGEP>12 and AGEP<21). However,
in subfamilies, this group runs from ages 13 through 17 because the ACS itself
defined ‘children’ as under 18 years old.
4.
Count the number of other individuals related to the family head.
Again, other
related individuals in the family are identified through their relationship as the sibling,
parent, grandchild, in-law, or other, unspecified relative of the householder (REL=03,
04, 05, 06, or 07) respectively. In subfamilies, individuals outside of the nuclear unit
(non-parent, non-child) are not identified.
5.
Add steps 1 through 4 to obtain the family size.
Family Income: The Illinois Department of Human Services includes a number of
financial resources when defining income for all individuals in a household and deducts
any child support paid out from the income total of each individual in the household:
+ Gross wages or salary of all adult household members
+ Non-farm / Farm self employment
+ Social Security
+ Supplemental Security Income
+ Net rental income
+ Dividends, royalties, & interest
+ TANF payments
+ Retirement income
+ Pension and annuities
+ Veteran’s pensions
+ Unemployment compensation
+ Worker’s Compensation
+ Alimony
+ Child support (received)
+ Adoption assistance
+ Survivor’s benefits
+ Other income
- Child Support (paid) = Total income
Questions about income in the past 12 months are asked of every household member, age
15 years or older, in the American Community Survey. The 8 income variables below
can serve as a proxy for the income sources outlined in the Department of Human
Services child care subsidy application.
WAGP Wages or salary SEMP Self-employment SSIP Supplementary Security SSP Social Security
INTP Interest, dividends, and net rental RETP Retirement
PAP Public Assistance OIP All other income
Enter income thresholds for the appropriate year (e.g., if data represent calendar year
2001, enter the thresholds for 2001). In 2001 and 2005, Illinois limited child care
eligibility to families with incomes below 50 percent of the state median income (SMI).
1212
Note: Some states used other indicators (i.e. federal poverty threshold) in determining families’ child care subsidy eligibility. Also, limits as a percentage of these indicators may change over time.
Illinois monthly income limits by family sizes (50% of SMI)
13:
Family Size 2001 2005 2 $ 1,472 $ 1,960 3 $ 1,818 $ 2,421 4 $ 2,165 $ 2,882 5 $ 2,511 $ 3,344 6 $ 2,857 $ 3,805 7 $ 2,922 $ 3,891 8 or larger $ 2,987 $ 3,978Note, although the income totals cover the preceding 12 months, the composition of
families and other individual-level characteristics refer to the time of the survey.
Therefore, the family income excludes amounts received by individuals who were
members of the family during all or part of the past 12 months, but no longer reside with
the family at the time of the survey. Similarly, income amounts reported by individuals
who did not reside with the family during the past 12 months, but who were members of
the family at the time of enumeration are included. However, the composition of most
families remains the same in the course of 12 months.
14Also, in determining child care
subsidy eligibility, child support payments paid out by family members are usually
subtracted from all income totals. This expense is not measured by the American
Community Survey, therefore net income totals derived by the study may be inflated. As
mentioned above, the data do not permit researchers to determine the potential eligibility
of non-family heads. In that sense our measure of the number of eligible families is
underestimated. Finally, the self-employment (SEMP) and the interest, dividends, and
net rental (INTP) measures allow for negative values. Following research convention,
the distribution of income was truncated at zero, i.e. restricted to positive values.
Suggested procedure to determine family income:
6. Simply add all income sources for each family member age 15 and older, as they are
identified above. It can be assumed that the ‘other’ income (OIP) measure in the
American Community Survey captures the same, or nearly the same information as the
13
Source: Illinois Department of Human Services, Family Income Ceilings 14
Source: American Community Survey / Puerto Rico Community Survey 2006 Subject Definitions. Definition of ‘Income of Families’. (www.census.gov/acs/www/Downloads/2006/usedata/Subject_Definitions.pdf)
remaining income sources that are specified by the Illinois Department of Human
Services when determining eligibility.
157. Divide the annual family income by 12 to compute monthly family income.
8. Compare family size (Step 5) and monthly family income (Step 7) with the standard
income limits.
Parental Employment and Disability: In Illinois, all parents present in the family must be
employed for applicants to receive a child care subsidy. Exceptions are made when
parents are disabled. In the PUMS American Community Survey, questions about
employment are asked of all household members, age 15 years or older. The ACS has
developed an employment status recode (ESR) variable to clearly evaluate each
respondents’ current employment status. The ESR codes are:
1 Civilian employed, at work
2 Civilian employed, with a job but not at work 3 Unemployed
4 Armed forces, at work
5 Armed forces, with a job but not at work 6 Not in labor force
The PUMS American Community Survey also asks questions about functional disability
of all household members, age 5 years or older. Individuals are classified as disabled
(DS=1) if they reported at least one of the following conditions, depending on their age
group.
15 Other income sources included in the Illinois eligibility determination, but not specified by the American Community Survey are (1) Pension, Annuities, (2) Veteran’s pensions, (3) Unemployment Compensation, (4) Alimony, (5) Child Support, (6) Adoption assistance, (7) Survivor’s benefits
5 though 15 years 16 though 64 years 65 years or older
sensory limitations sensory limitations sensory limitations
physical limitations physical limitations physical limitations limitation in cognitive
functioning (i.e. mental disability)
limitation in cognitive functioning (i.e. mental disability)
limitation in cognitive functioning (i.e. mental disability)
self-care limitation self-care limitation self-care limitation
going-outside-home limitation going-outside-home limitation
employment limitation
Suggested procedure to determine employment eligibility with disabilities considered
(WK_ELIG=1):
1.
Determine if each parent present is employed (ESR=1, 2, 4, or 5).
2.
If a parent is not employed (ESR=3 or 6), determine if s/he is disabled (DS=1)
Suggested procedure to determine income and employment with disabilities eligibility
(EMP_ELIG=1):
1. If
(INCOME_ELIG=1)
and
(WK_ELIG=1), families are put in Category 1
Category 2: Teen parents
The Illinois Department of Human Services stipulates that parents who themselves are under the
age of 21, not working, but enrolled in either high school or a GED program, are also potentially
eligible for child care subsidies. The PUMS American Community Survey asked about current
school enrollment of all individuals age 3 and older (SCH).
b Not applicable (less than 3 years old) 1 No, has not attended in the last 3 months 2 Yes, public school or public college 3 Yes, private school or private college
Unfortunately, the American Community Survey data do not permit researchers to identify
individual enrollment in GED programs or the potential eligibility of non-family heads.
Therefore, figures on the number of potentially eligible teen parents may be underestimated.
Suggested procedure to determine teen parent eligibility (T_PARENTS=1):
1.
Determine age of parents in the family.
For each household’s primary family, the
householder (REL=0) and his/her spouse (REL=1) should be counted as the parents
in the family. Parents in household subfamilies (SFN=1, 2, 3, or 4) are then counted
separately, identified as either a married couple with children (SFR=2) or a single
parent with children (SFR=3). Regardless of household family level, teen parents are
partially identified by their age (AGEP<21).
2.
Determine parents’ employment status.
Regardless of household family level,
eligible teen parents are partially identified by their lack of employment (ESR =3 or
6)
3.
Determine parents’ school enrollment status.
Regardless of household family level,
eligible teen parents are partially identified by their school enrollment (SCH=2 or 3)
4. If (AGEP<21)
and
(ESR =3 or 6)
and
(SCH=2 or 3), families are put in Category 2.
Category 3: Parents receiving Temporary Assistance for Needy Families (TANF)
In Illinois, parents age 21 or older, who receive Temporary Assistance for Needy Families
(TANF) benefits, and either attend school or participate in a training or work-related activity, are
also eligible for the child care subsidy. Unfortunately, TANF recipients are not identified in the
American Community Survey. Without significant assumptions, researchers are unable to
determine the proportion of people who receive TANF using this data survey alone. Therefore,
the child care subsidy eligible population may be slightly underestimated. As described in
Section IV, however, data from the non-public use ACS can be merged with TANF
administrative files to best identify this category of potential subsidy recipients.
Category 4: Non-teen, Non-TANF parents, attending college and working, or in training/work
activity
The Illinois Department of Human Services stipulates that parents age 21 or older who either
attend college and work at least 10 hours a week; or participate in a training program /
work-related activity are also potentially eligible for child care subsidies. The PUMS American
Community Survey asks about current grade level of all individuals age 3 or older (SCHG).
b Not applicable (not attending school) 1 Nursery school / preschool
2 Kindergarten 3 Grade 1 to Grade 4 4 Grade 5 to Grade 8 5 Grade 9 to Grade 12 6 College undergraduate
7 Graduate or professional school
The American Community Survey also asks all individuals age 16 or older, about the number of
hours they usually worked per week during the past 12 months (WKHP=1, 2, 3, etc.).
Unfortunately, the PUMS American Community Survey data do not permit researchers to
identify individual enrollment in training programs or work-related activities. Nor, do they
identify TANF recipients (and conversely, non-recipients) or determine the potential eligibility
of non-family heads. Therefore, figures on the number of potentially eligible
non-teen/non-TANF parents may be underestimated.
Suggested procedure to determine non-teen, non-TANF parent eligibility (NO_TETA=1):
1.
Determine age of parents in the family
. For each household’s primary family, the
householder (REL=0) and his/her spouse (REL=1) should be counted as the parents
in the family. Parents in household subfamilies (SFN=1, 2, 3, or 4) are then counted
separately, identified as either a married couple with children (SFR=2) or a single
parent with children (SFR=3). Regardless of household family level, teen,
non-TANF parents are partially identified by their age (AGEP>=21).
2.
Determine parents’ current grade level.
Regardless of household family level,
non-teen, non-TANF parents are partially identified by their enrollment in college
(SCHG=6).
3.
Determine parents’ current level of employment.
Regardless of household family
level, non-teen, non-TANF parents are partially identified by their level of
employment (i.e. at least 10 hours per week (WKHP>=10)).
Suggested procedure to determine employment non-teen, non-TANF parent eligibility
(NO_TETA=1):
4.
If (AGEP>=21) and (SCHG=6) and (WKHP>=10), families are put in Category 4.
Category 5: Foster children
Finally, foster children are generally eligible to have their care paid for with a child care subsidy.
As defined in the PUMS American Community Survey, foster children are nonrelatives of the
householder, under age 18, who are placed by the local government in a household to receive
parental care.
16If a child is placed by authorities with relatives for temporary or permanent
guardianship, the child is classified in the ACS as that specific relative (See REL classification
table above). Without ACS identification of relative foster children as foster children, their
eligibility for a child care subsidy is contingent on qualification in one of the aforementioned
four categories.
16
Source: American Community Survey / Puerto Rico Community Survey 2006 Subject Definitions (http://www.census.gov/acs/www/Downloads/2006/usedata/Subject_Definitions.pdf)
Suggested procedure to determine foster child eligibility (FOSTER=1):
1.
Determine relationship to family head (parents).
Foster children in households are
always identified as part of the primary family and simply identified through their
relationship to the householder (REL=11).
2.
This group, regardless of household family level, will be limited to those foster children
under age 13 (AGEP<13).
Summary
To recap, in Illinois, families with children under 13 years old may be eligible for child care
subsidies in Illinois based on their fulfillment of any one of the outlined categories. Following
all the procedures outlined above with PUMS American Community Survey data for 2001 and
2005, we estimate the number of child care subsidy eligible families in Illinois, as shown in
Table 1, for each of the two years. Over 250,000 Illinois families were eligible for child care
subsidies in 2001, and about 320,000 in 2005. Table 2 displays the characteristics of families
eligible for a child care subsidy in 2001. Among them, 62 percent were headed by single
parents; 50 percent were families with mothers with some college education or more; and 87
percent were families with mothers employed full- or part-time.
Table 1. Number of eligible families in Illinois using the PUMS American Community Survey
(2001 and 2005)
Number of eligible families 2001 2005
Primary family 207,321 253,049
Sub-family 1 43,536 45,513
Sub-family 2 1,743 1,422
Table 2. Number and characteristics of families eligible for child care subsidy in Illinois (2001)
Number of eligible families
Primary family 207,321
Sub-family 1 43,536
Sub-family 2 1,743
Total 252,600
Parents marital status
Married 38%
Single 62%
Maternal education
Less than high school 20%
High school 30%
Some college or more 50% Maternal employment
Full-time, year-round 33% Part-time or Part-year 54%
Not employed 13%
Sample Code
Appendices 1, 2, and 3 present sample STATA, SAS, and SPSS syntax, respectively, that follow
the steps suggested above. While specific to the Illinois child care subsidy criteria, these
programs are intended to be easily adapted to the criteria of other states.
2. What are the number and characteristics of families receiving a child care
subsidy? Using the public Child Care and Development Fund administrative
data (ACF-801)
Each state’s child care subsidy system records information on monthly benefit payments, some
basic family characteristics, and the type of child care arrangements used by subsidized families.
The information in these datasets relates specifically to the information that is needed to
determine a family’s eligibility for child care assistance, and the appropriate payment to child
care providers.
As indicated above, the Child Care and Development Fund state sample data (ACF-801) are
widely available via the
Research Connections
website
(
http://www.researchconnections.org/discover/index.jsp
). Search “ACF” > “Datasets” > “Any
Date” > “Go.” State sample data can be downloaded for analysis or analyzed online.
Documentation available through
Research Connections
includes a Codebook for each year’s
data,
17with the ACF-801 form as an appendix. The ACF-801 form and instructions are also
available on the website of the Administration for Children and Families:
http://www.acf.dhhs.gov/programs/ccb/report/formhelp/acf801/overview.htm
Using the public Child Care and Development Fund administrative data (ACF-801)
There are five files per year in the ACF-801 sample dataset available on the
Research
Connections
website: (1) summary, (2) family, (3) child, (4) setting, and (5) pooling factor. A
statistically representative estimate of the number of families subsidized through the Child Care
and Development Fund (CCDF) is obtained by simply applying the state-specific percentage of
child care funds from CCDF used to subsidize families in the sample (found in the pooling factor
file) to the aggregated sample number of families subsidized each month (found in the summary
file).
18The example analyses in Table 3 are based on Illinois data for 2001. The pooling factor
of 0.58 indicates that 58 percent of the child care subsidy funding for families included in
ACF-801 reports that year came from CCDF funds, while 42 percent came from other funding sources.
17 ACF-801 state sample data are currently available on the Research Connections website for Federal Fiscal Years 2001 through 2005.
18
As explained in the codebook Child Care and Development Fund Administrative Data, Federal Fiscal Year, 2001(pages 11-12), ACF-801 reports may or may not include data on families and children whose care is funded through funding streams in addition to CCDF.
Table 3. Number of families receiving CCDF child care subsidies in Illinois, 2001
The family file provides data on family-level characteristics such as those that receive TANF as
a source of income.
19The proportion of families receiving TANF assistance can then be
multiplied by the number of families receiving child care subsidies in the state to obtain the
number of families receiving both the subsidy and TANF benefits. So for example, as noted in
Table 3, a monthly average of 51,697 families received a CCDF child care subsidy in Illinois in
2001. The family file data for the same year showed that 17.1 percent of families receiving a
child care subsidy, also received TANF (8,849). This same procedure can be applied to estimate
the magnitude of other basic characteristics of the child care utilizing population, such as the
number and percent of families also receiving food stamps, housing assistance, or in
single-parent households.
19
Note that percentages calculated directly from the family level data file are a reasonably accurate reflection of the state. Weights need not be applied. (Codebook page 17).
Total reported number of families served State-specific pooling factor Number of CCDF families served 01-OCT-2000 91,117 0.58 52,848 01-NOV-2000 91,342 0.58 52,978 01-DEC-2000 89,741 0.58 52,050 01-JAN-2001 89,356 0.58 51,827 01-FEB-2001 89,935 0.58 52,162 01-MAR-2001 89,811 0.58 52,090 01-APR-2001 90,148 0.58 52,286 01-MAY-2001 90,915 0.58 52,731 01-JUN-2001 87,702 0.58 50,867 01-JUL-2001 85,928 0.58 49,838 01-AUG-2001 86,759 0.58 50,320 01-SEP-2001 86,839 0.58 50,367
AVERAGE MONTHLY CCDF SERVED 10-2000/9-2001
Table 4. Characteristics of families receiving CCDF child care subsidies in Illinois, 2001
Characteristic Percent of 51,697 Number TANF receipt
(X1_TANF) 17.1% 8,849
food stamps receipt
(X4_FOODS) 16.2% 8,370
housing assistance receipt
(X3_HOUSI) 0.3% 146
headed by single-parent
(X5_SINGL) 97.9% 50,219
headed by employed parent
(X0_EMPLO) 93.0% 48,074
These data are also readily available through the
Research Connections
on-line Survey
Documentation and Analysis (SDA).
http://www.researchconnections.org/Discover?displayPage=analyze.jsp
Simply run through the wizard:
Step 3: Select the variables to be analyzed and run a table
SECTION IV: ANALYZING NON-PUBLIC USE DATA AND
PRESENTING FINDINGS—individuals can be uniquely identified across
data sets
Non-public use administrative databases allow researchers to examine actual beneficiaries of
child care subsidies, TANF, Unemployment Insurance, and other programs. Administrative data
can be very detailed in the enumeration of a very narrow universe of individuals (i.e., TANF
recipients in a particular area or state), and can be used to track behavior over time (i.e. families’
movement in and out of the TANF system). Unlike survey data, however, they often lack key
information on individual attributes that fall outside of the interests of a specific program. For
instance, a database of recipients administered by a state’s TANF agency will likely collect some
basic information on each individual such as family income, race, gender, and employment level,
but not on concurrent participation in the Food Stamp program, or insurance coverage.
Child Care Subsidy (CCS administrative data)
Administrative datasets are usually collected according to the source of the funding or by the
type of payment arrangement that is made. In the area of child care subsidies, these tendencies
introduce two complexities. Along with funding from the Child Care and Development Fund
(CCDF), states can use many other sources to provide child care subsidies to low-income
families. These may or may not be pooled with their CCDF funds.
20In addition, although
federal law stipulates that states must use funding from the CCDF program to provide vouchers
so that families have a choice of all legal child care arrangements in their community, states can
also provide subsidies through contracts in which the state enters into an agreement with a child
care provider for a specified number of slots. The data collected from contracted programs often
are not comparable to those for the voucher programs, and frequently are not automated.
21For
the
All Child Care Eligibles
study, the data include virtually all of the child care subsidy funding
delivered through the voucher programs in the study states of Illinois, Maryland, and Texas. The
administrative datasets used do not account for children receiving child care exclusively paid for
20
See discussion of state pooling factor in Section III.2 above. 21
Meyers, M.K. et al. The Dynamics of Child Care Subsidy Use: A Collaborative Study of Five States. (2002). National Center for Children in Poverty. Columbia University, Mailman School of Public Health. New York, NY.
through a state’s child care contracts system. The share of total subsidy assistance represented
by the contracted programs, and thus the proportion of children and families excluded, varies by
state. Approximately 20 percent of subsidy assistance in Illinois in 1997-1999 was through
contracted programs, while none in Maryland or Texas was through contracts.
Relevant variables from the private child care subsidy administrative dataset are:
VARIABLE DESCRIPTION USEFUL TO
Spell Begin Date Used to determine duration under the CCS program
Generate CCS spell variable Spell End Date Used to determine duration under
the CCS program
Generate CCS spell variable Provider Type Identifies type of child care
arrangement
Generate data on demand by CCS type
Recipient of CCS ID Identifies the parent as the recipient of CCS
Gives primary information on who the beneficiary is. Also allows to link beneficiaries with their demographic characteristics Child ID Identifies which child in a family is
related to the subsidy
Gives primary information on which children the beneficiary is related to. Also allows linking of beneficiaries with their demographic
characteristics
Unemployment Insurance (UI administrative data)
Unemployment Insurance (UI) wage records consist of total quarterly earnings reported by
employers for each employee. Any employer paying $1,500 in wages during a calendar quarter
to one or more employees is subject to a state UI tax and must report the quarterly amount paid
to each employee. The dataset contains information on each individual’s quarterly earnings, the
Social Security numbers or employer ID of both employers and their employees, and employer
addresses. In each state, there are longitudinal wage report data covering the entire state
population.
Although the Unemployment Insurance administrative data have been most often used to track
an individual’s employment status (Hotz & Scholz, 1999), the data can also be used to study
patterns of employment in a particular industry. By linking the employer ID to the North
American Industry Classification System (NAICS) industry code and employment size-class
information, the data can be used to trace employee mobility among industries, duration of stay
with a particular employer, patterns of average earnings for employees in a particular sector, and
paths between industries.
Unlike the child care subsidy systems, the coverage of Unemployment Insurance wage record
data differs very little among the states. A potential limitation of the data is that the coverage
extends only to a state’s borders, so for instance, Maryland residents who work in Virginia or the
District of Columbia appear in the respective UI wage record databases of those jurisdictions, not
Maryland. Also, major types of employment that are not covered include federal government
civilian and military personnel, U.S. Postal Service employees, railroad employees, employees of
certain philanthropic and religious organizations, and independent contractors.
Relevant variables from the UI wage reports data are:
VARIABLE DESCRIPTION USEFUL TO
Wages Quarterly data on wages received by employees. Provides the amount of quarterly earnings but no
information on the number of hours worked.
Determine quarterly employment duration: time from the first quarter of wage records to the last quarter. If linked with TANF data (or other social program) they provide information on the number of quarters with UI wage reports during determined years before TANF entry Quarter and year Data on quarters when the wages
were received
Provides time frame information to form employment spell intervals Employee ID Identifies the wage earners Link individual level records across
datasets Employer ID Identification number of the
employer
Determine changes in patterns of employment
Temporary Assistance for Needy Families (TANF administrative data)
The Temporary Assistance for Needy Families
administrative dataset provides information on
the demographic, income, and program-related characteristics of TANF program participants.
TANF records are career histories for all families that have received TANF in a specified time
frame. In some states, additional variables such as baseline income at the time of application
from various sources are also reported.
Relevant variables from the TANF data are:
VARIABLE DESCRIPTION USEFUL TO
TANF recipient ID Identifies the TANF recipient Link individual level records across datasets
Mother’s birth date Demographic characteristic Discriminate population by age cohorts
Child’s age Demographic characteristic Discriminate population of recipients by age of children Mother’s race Demographic characteristic Discriminate population by race County Demographic characteristic Discriminate among rural and urban
zones
Date of TANF entry Date when received the first benefit Produce TANF spells Date of TANF exit Date when received the last benefit Produce TANF spells
Maintaining the confidentiality of these databases is key for any project. To ensure data security,
inventory of confidential records should be taken when they are received, data tapes should be in
a locked facility, and passwords maintained. Only authorized personnel should have access to
the data and servers on which they are stored. Once the record linkage phase is complete, most
identifying information (particularly the name and Social Security number) should be removed
and placed on a separate file, accessible only to authorized personnel. When the database is
ready for public use, access to data should conform to agency guidelines governing
confidentiality and the ownership of data.
Using data from linked non-public use administrative databases to
understand TANF families participating in the child care subsidy program
Clearly, linking data records across different private databases can greatly expand the
possibilities for child care research, by drawing on the strengths of each contributing dataset.
Doing this accurately is key to the success of any project. Because a single variable is not
always available or verifiable to establish the identity of a client from the records of multiple
sources,
probabilistic record matching
can be used to increase the likelihood of identifying a
correct match. This methodology requires the use of multiple pieces of identifying information to
calculate the probability that two or more records belong to the same client (Newcombe 1988;
Winkler 1988; Jaro 1985, 1989). Once a match is determined, a unique number is assigned to
the newly merged record. The end result is a new linked file, which contains the unique number
assigned during matching, the client’s original identifying data and all of the identification
numbers assigned by administrative agencies. The
TANF Child Care Eligibles
study used the
Social Security number, date of birth, gender, race-ethnicity, and address of residence as
matching variables in this intermediate step.
22Once record matching is accomplished, a variety
of descriptive and multivariate analyses can be applied to the data to address the research
question.
After probabilistic record matching was applied to the TANF, child care subsidy, and
Unemployment Insurance wage report administrative records, the
TANF Child Care Eligibles
study calculated a number of interesting statistics on the demographic patterns of mothers who
began receiving TANF in the study states. Tables 5, 6, and 7 provide examples from Illinois
between 1997 and 1999, based on a 20 percent random sample of TANF entrants.
Table 5. Characteristics of mothers who received TANF in Illinois (1997-1999):
Characteristics Value
Total number of Mothers 12,631
Region
In Cook County 56.63%
In the rest of state 43.37%
Race/Ethnicity
White 34.96%
African American 54.71%
Hispanic 10.33%
Average age of mother at the time of TANF entry 26.6 (SD=7.4)
Average number of children under age 13 at the time of TANF entry 1.8 (SD=1.1)
Average age of youngest child at the time of TANF entry 3.1 (SD=3.4)
Source: Child Care Subsidy Use and Employment Outcomes of TANF Mothers During the Early Years of Welfare Reform: A Three-State Study (Lee, et al, 2004).
1. How many mothers in the TANF population are eligible to receive a child
care subsidy? How many actually do?
In addition, by restricting data on the TANF population in Illinois to those who were eligible
through employment, the
TANF Child Care Eligibles
study determined that 55 percent of
22
As described above in the Introduction, the All Child Care Eligibles study used probabilistic matching conducted at the Census Bureau to assign a Protected Identity Key (PIK) to linked survey and administrative records.
mothers already receiving TANF were also eligible to receive a child care subsidy between
1997-1999. Perhaps more importantly, 35 percent of those who were eligible actually
received
a
child care subsidy.
Table 6. Child care subsidy eligibility and take up among mothers who received TANF in Illinois
(1997-1999):
Number Percent
Total 12,631 100.0
Eligible for child care subsidy benefits (based on employment) 6,931 54.9 Eligible and receive child care subsidy 2,391 34.5
Source: Child Care Subsidy Use and Employment Outcomes of TANF Mothers During the Early Years of Welfare Reform: A Three-State Study (Lee, et al, 2004).
2. What kind of child care are TANF mothers who utilize child care subsidies
using?
Table 7, below, shows the type of care arranged the first time that participants took the child care
subsidy, by children’s age groups and race. This information is useful in characterizing the
observed demand for different kinds of providers. Extensions of this analysis might include
calculating the rate at which children change the types of care arrangement, or odds of selecting
one type of arrangement over another as a function of parameters that are thought to affect the
choice.
Table 7. First type of child care arrangement used after subsidy take up, among children in
TANF families, in Illinois, by age and race/ethnicity (1997-1999)
Age Center % Family % Relative % In-home % (Non-relative) Total # Under 1 year 14.41 24.46 38.56 22.57 1,582 1 to 2 years 23.87 20.68 34.65 20.80 1,567 3 years 26.21 13.17 36.42 24.19 744 4 to 5 years 21.13 16.74 33.67 28.45 1,093 6 years and older 10.13 11.52 40.80 37.56 1,728 Race / Ethnicity
White 27.12 26.51 26.51 19.87 1,973
Black 14.35 14.78 40.52 30.35 4,363
Latino 11.11 6.08 54.50 28.31 378
All 17.92 17.74 37.19 27.15 6,714
Source: Child Care Subsidy Use and Employment Outcomes of TANF Mothers During the Early Years of Welfare Reform: A Three-State Study (Lee, et al, 2004).
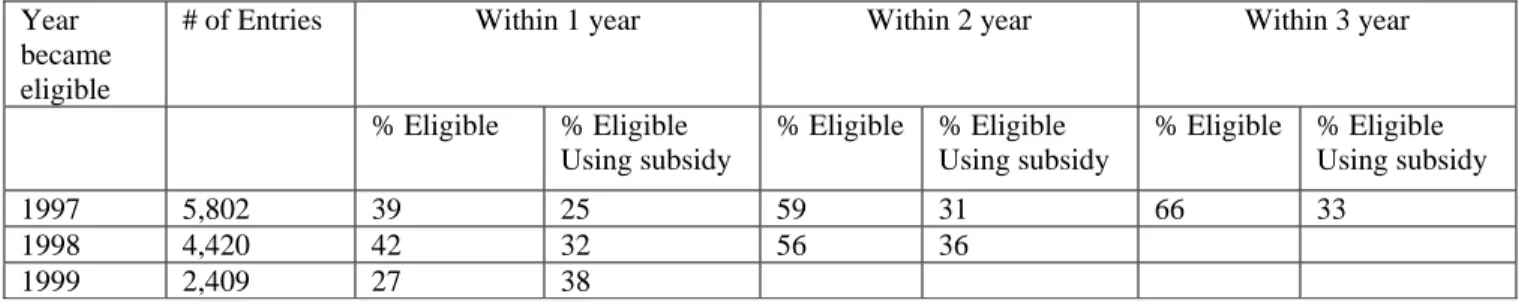
3. What is the probability that eligible TANF recipients will take the child care
subsidy within 3 years (12 quarters)?
Using non-parametric duration models to compute cumulative survival probability – the Kaplan
Meier estimator, 25 percent of Illinois’ child care subsidy eligible TANF recipients (in the first
cohort) received a child care subsidy within one year of eligibility; 31 percent received a subsidy
within two years; and 33 percent received a child care subsidy within three years. Further
analysis illustrates that 25 percent typically received the child care subsidy within 2 quarters (see
Tables 8 and 9).
Table 8. Utilization of child care subsidy among eligible individuals in Illinois, by cohort
(1997-1999)
Year became eligible
# of Entries Within 1 year Within 2 year Within 3 year
% Eligible % Eligible Using subsidy % Eligible % Eligible Using subsidy % Eligible % Eligible Using subsidy 1997 5,802 39 25 59 31 66 33 1998 4,420 42 32 56 36 1999 2,409 27 38
Source: Child Care Subsidy Use and Employment Outcomes of TANF Mothers During the Early Years of Welfare Reform: A Three-State Study (Lee, et al, 2004).
Table 9. Time (in quarters) for 25 percent of eligible TANF recipients to begin child care subsidy
utilization, 1997-1999
Year eligible Illinois Cook County Rest of State
1997 2 3 2
1998 2 2 2
1999 1 1 1.5
Average (’97-’99) 2 2 2
Source: Child Care Subsidy Use and Employment Outcomes of TANF Mothers During the Early Years of Welfare Reform: A Three-State Study (Lee, et al, 2004). The time of reference of the TANF project was 1997-1999
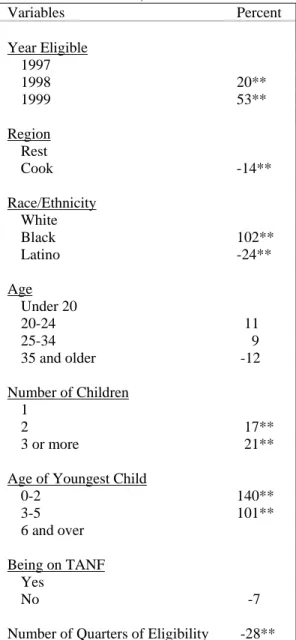
4. What are the characteristics of those most likely to take the child care
subsidy?
The research team was also interested in examining the effect of additional characteristics on the
likelihood of taking up the subsidy. In complementary log-log models, the value of these
variables can be easily interpreted as predicting child care subsidy utilization. So for instance, in
Illinois, eligible mothers in Cook County were 14% less likely to utilize a child care subsidy than
counterparts in the rest of the state; blacks were 102 percent more likely, and Latinos were 24
percent less likely to utilize the child care subsidy than whites; and mothers with at least two
children were more likely to utilize the child care subsidy than mothers with only one child (see
Table 10).
Table 10. Marginal effect of covariates on the likelihood of beginning child care subsidy
utilization, 1997-1999
Variables Percent Year Eligible 1997 1998 20** 1999 53** Region Rest Cook -14** Race/Ethnicity White Black 102** Latino -24** Age Under 20 20-24 11 25-34 9 35 and older -12 Number of Children 1 2 17** 3 or more 21**Age of Youngest Child
0-2 140** 3-5 101** 6 and over Being on TANF Yes No -7
Number of Quarters of Eligibility -28** *<0.05 **<0.001
Source: Child Care Subsidy Use and Employment Outcomes of TANF Mothers During the Early Years of Welfare Reform: A Three-State Study (Lee, et al, 2004).