D I S C U S S I O N P A P E R S E R I E S Forschungsinstitut zur Zukunft der Arbeit Institute for the Study of Labor
Child Mental Health and Educational Attainment: Multiple Observers and the Measurement Error Problem IZA DP No. 5874 July 2011 David Johnston Carol Propper Stephen Pudney Michael Shields
Child Mental Health and Educational
Attainment: Multiple Observers
and the Measurement Error Problem
David Johnston
Monash UniversityCarol Propper
Imperial College and University of Bristol
Stephen Pudney
University of EssexMichael Shields
Monash University, University of Melbourne and IZA
Discussion Paper No. 5874
July 2011
IZA P.O. Box 7240 53072 Bonn Germany Phone: +49-228-3894-0 Fax: +49-228-3894-180 E-mail: [email protected]Any opinions expressed here are those of the author(s) and not those of IZA. Research published in this series may include views on policy, but the institute itself takes no institutional policy positions.
The Institute for the Study of Labor (IZA) in Bonn is a local and virtual international research center and a place of communication between science, politics and business. IZA is an independent nonprofit organization supported by Deutsche Post Foundation. The center is associated with the University of Bonn and offers a stimulating research environment through its international network, workshops and conferences, data service, project support, research visits and doctoral program. IZA engages in (i) original and internationally competitive research in all fields of labor economics, (ii) development of policy concepts, and (iii) dissemination of research results and concepts to the interested public.
IZA Discussion Papers often represent preliminary work and are circulated to encourage discussion. Citation of such a paper should account for its provisional character. A revised version may be available directly from the author.
IZA Discussion Paper No. 5874 July 2011
ABSTRACT
Child Mental Health and Educational Attainment:
Multiple Observers and the Measurement Error Problem
*We examine the effect of survey measurement error on the empirical relationship between child mental health and personal and family characteristics, and between child mental health and educational progress. Our contribution is to use unique UK survey data that contains (potentially biased) assessments of each child’s mental state from three observers (parent, teacher and child), together with expert (quasi-)diagnoses, using an assumption of optimal diagnostic behaviour to adjust for reporting bias. We use three alternative restrictions to identify the effect of mental disorders on educational progress. Maternal education and mental health, family income, and major adverse life events, are all significant in explaining child mental health, and child mental health is found to have a large influence on educational progress. Our preferred estimate is that a 1-standard deviation reduction in ‘true’ latent child mental health leads to a 2-5 months loss in educational progress. We also find a strong tendency for observers to understate the problems of older children and adolescents compared to expert diagnosis.
JEL Classification: C30, I10, I21, J24
Keywords: child mental health, education, Strengths and Difficulties Questionnaire,
measurement error Corresponding author: Steve Pudney ISER University of Essex Wivenhoe Park Colchester, CO4 3SQ United Kingdom E-mail: [email protected] *
We are grateful to participants at the 2010 Melbourne Workshop in Mental Health and Wellbeing and the 2011 CeMMaP work-shop in Survey Measurement and Measurement Error for valuable comments. Johnston and Shields would like to thank the Australian Research Council for funding. Pudney's involvement was supported by the European Research Council (project no. 269874 [DEVHEALTH]), with additional support from the ESRC Research Centre on Micro-Social Change
1
Introduction
Childhood has become the focus of a growing body of research in economics concerned with the closely-related concepts of children’s wellbeing, mental health and non-cognitive skills. Much of this interest has been sparked by Heckman’s model of life-cycle human capital accumulation, which contends that, independently of cognitive ability, a stock of ‘non-cognitive skills’ are built up by streams of investment over the life course and determine a wide range of life outcomes (Heckman, Stixrud and Urzua, 2006). A strong motivation for this line of research comes from the belief that IQ or cognitive ability is much less malleable than socio-emotional skills, particularly after the age of 10. From a policy perspective, this would suggest that the returns to interventions targeted at non-cognitive skills are potentially much higher than those focused on cognitive outcomes alone. For example, the Perry preschool intervention program in the 1960s did not raise the IQ of participating children in a lasting way, yet they went on to have better adult outcomes than the control group in a variety of dimensions (Heckman et al., 2010). The inference that Perry succeeded because of its impact on attention skills or antisocial behaviours, rather than cognitive ability, is one that is supported by evaluations of more recent childhood interventions which tend to show much larger effects on behaviour (of both parents and children) than on cognitive achievement outcomes (Currie 2009).
Mental health conditions are much more common in childhood than most physical condi-tions and a growing body of evidence suggests that prevalence is highest among children from low-income backgrounds. While the relationship between non-cognitive skills and medical conceptions of mental health is unclear (even though in practice they are often measured using the same indicators, for example, Duncan and Magnuson, 2009), whether interpreted as lack of non-cognitive skills or the existence of a mental health problem, a central con-cern is the impact that these adverse childhood states have on the process of human capital
accumulation and the implications for the intergenerational transmission of economic ad-vantage. It has been recognised recently that mental health conditions are potentially an important channel through which parental socio-economic status influences the outcomes of the next generation. For example, Currie and Stabile (2006, 2007) and Currie et al. (2010) found significant impacts of hyperactivity on a range of later educational outcomes in US and Canadian longitudinal data and shown the persistence of these effects. Evidence from the medical literature is rather more mixed but also indicates the potential importance of mental health problems (Duncan and Magnuson, 2009; Breslau et al., 2008, 2009).
A key issue in the empirical study of the impact of child mental health on child outcomes is reliability of measurement. Two types of measure are common in the research literature. Clinical diagnoses are used extensively in psychiatric research, but they have several draw-backs: they are often only available for small, endogenously-sampled groups of children; they identify relatively extreme and rare cases (affecting somewhere in the region of 5 to 10% of children); and they are sensitive to differences in diagnostic practice, which may produce surprising differences between apparently similar groups (for example, diagnosed attention deficit and hyperactivity disorder (ADHD) rates in the US are double those in Canada). Alternative measures derive from ‘screener’ questionnaires which can be completed quickly by parents, teachers or the children themselves, in the context of large-scale sample surveys. These screeners are designed specifically to identify the symptoms of clinical disorders and are often used as a first step in diagnosing suspected cases – a high screening score being sug-gestive of a recognised disorder, while lower scores reflect the incidence of symptoms among the ‘normal’ population. These screener questionnaires are typically used in the surveys that also include measures of later outcomes and so can be used to assess the relationship between early mental health and later outcomes. Few data sources are available that give both screening and diagnostic-type information for large representative samples.
Whatever type of information is used, measurement error is an important concern. But is has received little attention in the literature on the consequences of child mental health. There is a substantial body of research suggesting that adults’ assessments of their physical health are prone to serious measurement error (for example, Butler et al. 1987; Mackenbach et al., 1996; Baker et al., 2004; Lindeboom and van Doorslaer, 2004; Etile and Milcent, 2006; Bago d’Uva et al., 2007; Jones and Wildman, 2008; and Johnston et al., 2009), and this problem is likely to be magnified in the case of child mental health. Children may manifest symptoms differently in different settings, perhaps showing deviant behaviour at school but not at home (or vice versa). They may deny or minimise socially undesirable symptoms when asked by parents or teachers. Informants may also have very different thresholds or perceptions of what constitutes abnormal behaviour in children.
The availability of multiple measures is particularly helpful in dealing with measurement error problems, but there is a strong possibility of observer-specific reporting bias. There is evidence in the psychology and medical literatures of large disagreements between informants in their assessment of children’s psychological well-being. For example, in a sample of US children aged between 5 and 10, Brown et al. (2006) found that parents failed to detect half of school-aged children considered to be seriously disturbed by their teachers. Youngstrom et al. (2003) found that prevalence rates of comorbidity in a clinical sample ranged from 5.4% to 74.1%, depending whether ratings from parent, teacher, child or some combination are used to classify the child. Goodman et al. (2000) suggest that parents are slightly better at detecting emotional disorders than teachers but that the opposite is true for conduct and hyperactivity disorders, while the self-assessments of children have less explanatory power than parents or teachers. Johnston et al. (2010) show, also using data from the Survey of Mental Health of Children and Young People in Great Britain, that estimates of the income gradient in childhood mental health are sensitive to who provides the assessment, with the
smallest gradients found when using childrens own assessment of themselves rather than those of parents and teachers.
A clear implication of this limited body of evidence is that measurement error is substan-tial and unlikely to be the simple random noise which is assumed by the classical errors-in-variables model. If no observer can be assumed to be unbiased, standard methods (such as that of Hu and Schennach, 2008) cannot be used to identify the true mental health process. In this paper we make two main contributions. First, we exploit data from a remarkable UK survey (see Section 2) that contains assessments of children’s mental health from parents, teachers and the children themselves, to demonstrate the existence of significant biases in all three observers. We do this by using additional diagnostic-style assessments from a panel of expert psychiatric assessors, under the assumption that the experts are able to make the best possible use (in a rational expectations sense) of all available information, but with random variations in the threshold of seriousness they use for generating diagnoses. This model of expert behaviour, set out in Section 3, allows us to identify (up to scale) the parameters of a model representing the distribution of ‘true’ child mental health conditional on personal and family characteristics.
Second, we estimate the effect of mental health on educational progress. This requires us to overcome a second identification problem, discussed in Section 4, arising from the difficulty in distinguishing the indirect effect of influences on mental health from their direct effect on educational attainment. We use alternative identification strategies to provide, in Section 5, parallel estimates of the impact of mental health problems on educational progress, relative to an age-specific norm. We show that if an orthodox multiple-indicator latent variable model under the assumption of the existence of an unbiased observer is used, we would reach the conclusion that mental disorders have an adverse impact roughly twice as large as is suggested by a simple regression estimate based on the observable proxy for mental
health. However, two alternative (and preferable) instrumental variable strategies which do not impose the simple assumption of an unbiased observer, give rather smaller estimates. We find in this case they are also similar to those obtained from simple proxy regressions.
2
Data, Definitions and Descriptive Statistics
The data we use come from the 2004 Survey of Mental Health of Children and Young People in Great Britain, commissioned by the Department of Health and Scottish Executive Health Department, and carried out by the Office for National Statistics. Its aim was to provide information about the prevalence of psychiatric problems among people living in Great Britain, with a particular focus on three main categories of mental disorder: conduct disorders, emotional disorders and hyperkinetic disorders. A sample of children aged between 5 and 16 years was randomly drawn using a stratified sample design (by postcode) from the Child Benefit register. At the time of sampling, Child Benefit was essentially a universal entitlement for parents of all children, so the register provides an excellent sampling frame. Information was obtained in 76% (or 7,977) of sampled cases, yielding information gathered from the child’s primary caregiver (the child’s mother in 94% of cases), from the teacher and (if aged 11-16) the young person him/herself. Among co-operating families, almost all the parents and most of the children gave full responses, while teacher postal questionnaires were obtained for 78% of the children interviewed. We focus on a sub-sample of 6,808 white children who have information supplied by their mother, and who have non-missing information for key covariates and mental health measures. The reason for this sample restriction was that ethnic minority and paternal respondent cases were too few for reliable inferences to be drawn about ethnic differences. Inclusion of these groups with associated dummy variables as covariates makes no appreciable difference to the main results.
Child mental health is first assessed in the survey with the Strengths and Difficulties Questionnaire (SDQ). The SDQ is a 25-item instrument for assessing social, emotional and behavioral functioning, and has become the most widely used research instrument related to the mental health of children. The SDQ questions cover positive and negative attributes and respondents answer each with a response “not true” (0), “somewhat true” (1), or “certainly true” (2). Appendix Table A1 gives a complete list of the SDQ questions relating to conduct disorder, hyperactivity and emotional problems. In our empirical analyses we use parent, child and teacher SDQ scores that have been constructed in the standard way by summing responses. We carry out the analysis use two alternative indicators: (i) a sum of the fifteen responses relating to conduct disorder, emotional problems and hyperactivity; and (ii) a sum of the five items for hyperactivity alone. Each is normalised to a 0-1 scale. The former measure is intended to act as a general assessment of psychological distress, while the latter focuses exclusively on the hyperactivity component of ADHD, which has been studied extensively in the research literature and found to be particularly important in some studies. Following the SDQ is the Development and Well-Being Assessment (DAWBA), a struc-tured interview administered to parents and older children. The DAWBA contains a series of sections, with each section exploring a different disorder; examples include: social phobia, post traumatic stress disorder, eating disorder, generalised anxiety, and depression. Each disorder section begins with a screening question that determines whether the child has a problem in that domain. If the child passes the screening question and the relevant SDQ score is normal, the remainder of the section is omitted but, if parent or child indicates that there is a problem or the SDQ score is high, detailed information is collected, including a description of the problem in the informant’s own words. The DAWBA parent and child interviews respectively take around 50 and 30 minutes respectively to complete (Goodman et al., 2000). A shortened version of the DAWBA was also mailed to the child’s teacher. Once all three DAWBA questionnaires were returned, a team of child and adolescent psychiatrists
reviewed both the verbatim accounts and the answers to questions about children’s symp-toms and their resultant distress and social impairment, before assigning diagnoses using ICD-10 criteria. Importantly, no respondent was automatically prioritised.
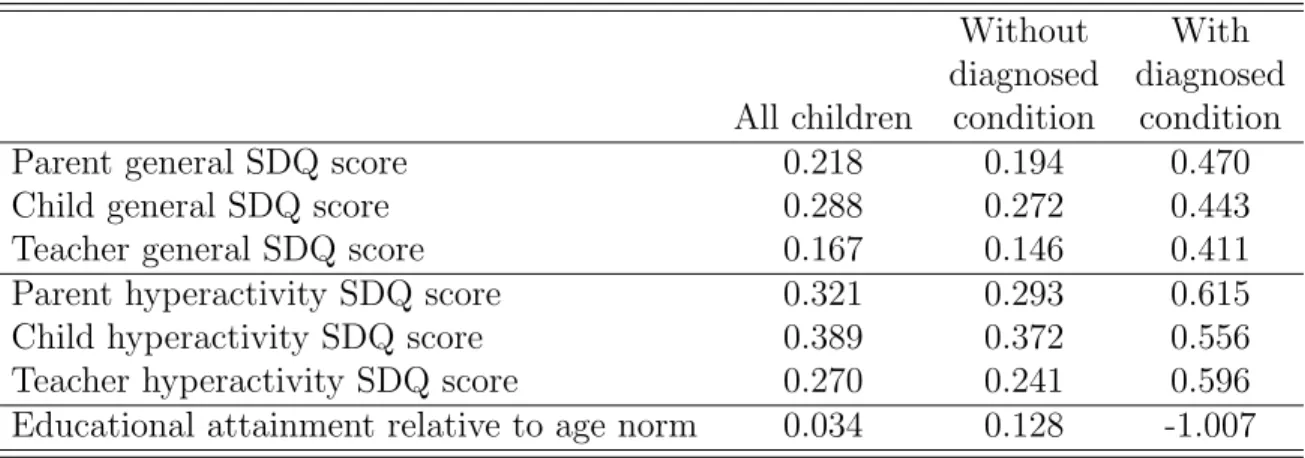
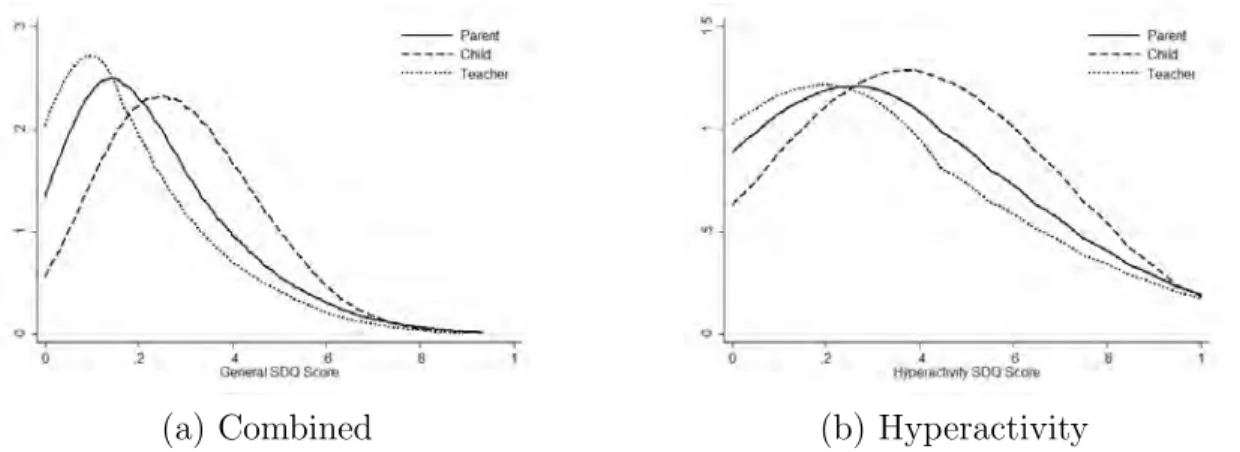
Table 1 provides the sample means for the parent, child and teacher SDQ scores for all children, for the subset of children who were diagnosed with an ICD-10 mental disorder, and for the subset of children without a diagnosed mental illness. The sample means indicate that teachers report the fewest symptoms (0.167) and that children report the most (0.288). Table 1 also shows that the SDQ scores of children with a diagnosed mental illness are 2-3 times larger than the SDQ scores of children without a mental illness. Estimated kernel densities of parent, child and teacher SDQ scores are presented in Figure 1. They are positively skewed, with most children exhibiting few symptoms and only a small minority exhibiting many.
The final key variable for our analysis is educational attainment. The survey focuses very much on measurement of mental state and a consequence of this is that educational outcomes are not documented in detail. In particular, the dataset does not contain test score informa-tion, and we use instead the one available measure: the teacher’s assessment of the child’s scholastic ability relative to other children of the same age. We construct this measure by using teacher responses to the question“In terms of overall intellectual and scholastic ability,
roughly what age level is he or she at?”, from which we subtract the child’s chronological
age. This measure of educational progress is unusual in the economics literature, but the concept of a child’s “mental age” has a long history in child educational psychology – indeed, Intelligence Quotient (IQ) tests are so named because they were originally constructed as the ratio of mental age to chronological age multiplied by 100. The concept also underlies the practice in many educational systems (but not the UK’s) of holding children back in a lower grade if he or she has made inadequate progress relative to the norm for that child’s age.
For our sample of children, the average scholastic age gap is 0.034 years, or approximately 2 weeks ahead of actual age (see Table 1). The age gap is however significantly different from zero for the groups of children with and without mental health problems. For children without a diagnosed mental disorder, the mean gap is 0.128 years, and for those with any disorder the gap is -1.007, implying an average gap between the two groups of around 15 months. Non-parametric estimates of the relationships between parent, child and teacher SDQ scores and educational attainment are shown in Figure 2, which confirms the pattern shown in Table 1, but indicates that the relationship is continuous (and approximately linear), rather than a discrete distinction between the absence or presence of a disorder.
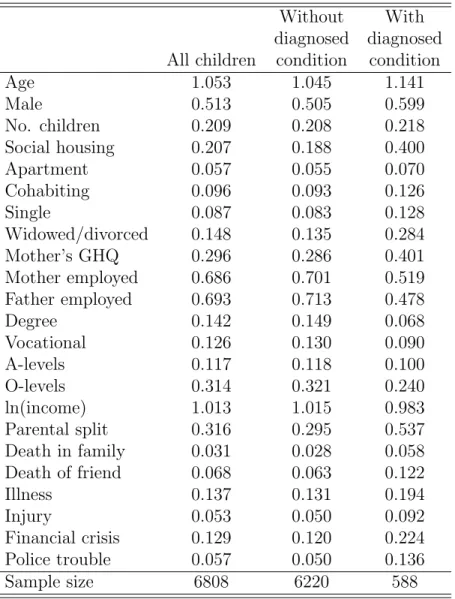
Appendix Table A2 presents sample means for the explanatory covariates used in our analysis. The continuous variables have been scaled to avoid extreme numerical values: age, number of children and log income are divided by 10; and mother’s GHQ mental health score is scaled to lie in the[0,1]interval. All other covariates are binary; consequently, the sample means indicate that children with a diagnosed disorder are more likely to: be male; live in social housing; have unmarried parents; have less educated, less employed and less healthy mothers; and have experienced serious adverse life events.
Table 1 Sample summary statistics
Without With
diagnosed diagnosed All children condition condition
Parent general SDQ score 0.218 0.194 0.470
Child general SDQ score 0.288 0.272 0.443
Teacher general SDQ score 0.167 0.146 0.411
Parent hyperactivity SDQ score 0.321 0.293 0.615
Child hyperactivity SDQ score 0.389 0.372 0.556
Teacher hyperactivity SDQ score 0.270 0.241 0.596
Educational attainment relative to age norm 0.034 0.128 -1.007 6,806 children have non-missing parent SDQ score, 2,958 have non-missing child SDQ score,
(a) Combined (b) Hyperactivity
Figure 1 Distributions of SDQ scores for different observers (kernel density estimates)
(a) Combined (b) Hyperactivity
Figure 2 The empirical education-mental health relation (kernel regression estimates)
3
Model-based measurement of mental health
Our statistical model has two components: a model of the complex measurement process for mental health and a relationship between the observed educational outcome and the child’s (latent) mental health and other relevant characteristics. The measurement model is based on three main principles. The first is that there exists a ‘true’ state of psychological disorder,
S, conceptualised as the (latent) assessment that would be made by experienced psychiatric assessors in possession of fully detailed, multi-source information on the child. This latent measure is the factor which we see as a potential influence on educational development.
anyone: not by the parent, the child him/herself, the teacher, the psychiatric assessment team, nor – least of all – by us, the statistical analysts. We assume the SDQ responses from parents, children and teachers are all potentially subject to systematic distortion, which we see as arising either because certain observers (particularly parents and children) may be reluctant to admit the existence of a problem, or may exaggerate minor problems, or because certain aspects of the problem are less visible to certain types of observer, leading to understatement.
The third underlying assumption is that psychiatric assessors make the best use they can of the information available to them, exploiting their experience of observing children’s mental health problems and the reactions of other untrained informants to those problems. We assume that, in making these assessments, the psychiatric team is aware of the possi-bility of error (and bias) in the perceptions of parents, children and teachers, and take that possibility into account. In general, fuller information leads to more precise diagnoses.
We implement these ideas through a latent variable structure with switching between observational regimes, to reflect the different information sets that may be available to psy-chiatric assessors under different circumstances. The sample consists of a set of observed children, indexed byi=1...n. Child i’s ‘true’ mental health state isSi and we observe three
SDQ scores reported by the parent, child and teacher, YiP, YiC and YiT. All are treated as
continuously-variable measures. The scores resulting from parents’, children’s and teachers’ responses to the SDQ are potentially biased readings of Si:
Yij =λjSi+Xiαj+Vij , j =P, C, T (1)
whereXi is a vector of variables, available to all observers, reflecting causal factors including
the child’s personal characteristics, family and social circumstances and the occurrence of past traumatic events. (ViP, ViC, ViT)are jointly normal conditional on Si andXi, with zero
of the observer to the child’s true state andαj captures any measurement distortions linked
to specific characteristics of the child and family circumstances. Consequently, an observer of type j gives generally unbiased reports only if λj = 1 and αj = 0. In addition, parents
and children are each asked a direct question about whether they perceive there to be a problem with respect to the specific aspect of mental health, yielding two binary indicators,
WiP, WiC.These indicators are important, since they play a role in triggering additional
questionnaire content. We assume them to be based on the same underlying opinion as revealed by the SDQ and contain no additional information, so thatSiáWij∣YiP, YiC, YiT,Xi.
The basic information which is always1 available to the psychiatric assessment process
is Bi = {YiP, YiC, YiT, WiP, WiC,Xi}. If the parent’s SDQ score exceeds a specific threshold
(YiP ≥KP) or the parent reports the child’s state to be problematic (WiP =1), then a much
more detailed set of questions is triggered, generating additional information ΩiP; similarly,
if the child perceives there to be a problem or his or her SDQ responses exceed a threshold
KC, further information ΩiC is elicited from him or her. Thus, the additional contingent
information set available to assessors is:
Ci= ⎧⎪⎪⎪⎪ ⎪⎨ ⎪⎪⎪⎪⎪ ⎩ ∅ if YiP <KP, WiP =0, YiC <KC, WiC =0 ΩiP if (YiP ≥KP or WiP =1), YiC <KC, WiC =0 ΩiC if YiP <KP, WiP =0,(YiC ≥KC orWiC =0) {ΩiP,ΩiC} if (YiP ≥KP or WiP =1),(YiC ≥KC or WiC =0) (2)
Psychiatric assessors are experienced in diagnosis in a multi-observer family setting, where the information reported to them by children and by parents and teachers may be subject to distortions and misinterpretation. We assume that they make the best use of whatever information is available, interpreting it in the light of their understanding of the mental health and reporting processes which generate that information. Their (approximately ac-curate) understanding of the relationship between the child’s true mental state and his or
her characteristics and circumstances is:
Si=Xiβ+Ui (3)
where Ui is N(0, σu2). SinceSi is unobservable, we can normaliseβ and σ2u arbitrarily to fix
the origin and scale of Si.
Given this structure, the assessor’s best unbiased predictor of Si is ˜Si =E(Si∣Bi,Ci,Xi)
which, under our assumptions, takes the form:
˜ Si= ⎧⎪⎪⎪⎪ ⎪⎪ ⎨⎪⎪⎪ ⎪⎪⎪⎩ Xiβ+ ∑ j=P,C,T bjSY.X[Yij−µYj (Xi)] if Ci= ∅ Xiβ+ ∑ j=P,C,T bjSY.CX[Yij −µjY(Xi)] +bSC.Y X[Ci−µC(Xi)] if Ci≠ ∅ (4)
where bjSY.X is the coefficient ofYij in a population regression of Si on YiP, YiC, YiT and Xi,
and bjSY.CX is the analogous coefficient from a regression that also includes the contingent information Ci. The vector bSC.Y X contains coefficients of the contingent information Ci in
the same extended regression. From (1) and (3), the conditional mean function µjY(Xi)for
observerj is Xi(λjβ+αj).
Note that the termbSC.Y X[Ci−µC(Xi)]represents the contribution of information
avail-able to the assessor but unobservavail-able for the purposes of statistical analysis and thus, from the point of view of the external observer, merely inflates the residual error in ˜Si.
The observed assessment is a binary quasi-diagnosis Di, which indicates a high predicted
level of psychiatric disorder: Di = 1(S˜i≥τ). where τ is the assessor’s decision threshold,
which may have a random element.2
2Another plausible way of modeling the assessment is to assume that the assessor constructs the
probabil-ity that the true level of disorder exceeds some critical threshold, then diagnoses a problem if that probabilprobabil-ity is large enough to cause concern. Under our assumptions, this two-stage process would lead to the same empirical model.
As an outside observer, the statistical analyst observes the diagnosis Di and the basic
information Bi. The probability of a diagnosed problem is:
P r(Di=1∣Bi,Xi) =Φ( ∑ j=P,C,T [bjSY.X στ ] Wij +Xi[ β στ] − µτ στ) (5) where Wij = Yij − (λjβ+αj). If contingent information Ci is available to the assessment
process, the probability of a diagnosed mental health problem conditional on the information available to the analyst is:
P r(Di =1∣Bi,Xi) =Φ( στ ωCi { ∑ j=P,C,T [b j SY.CX στ ] Wij+Xi[ β στ] − µτ στ}) (6) where ω2 Ci =σ 2 τ +var(∑jb j
SC.Y X[Ci−µC(Xi)]). Thus, conditional on all the observed
infor-mation in Bi, we have a probit model for the psychiatric assessment, with regime switches in
the coefficients of Wij and Xi and in the normalising variance. However, conditional onBi,
these switches are exogenous, so there is no endogenous selection problem as there would be if we conditioned onXi but not the SDQ scores Yij. Note that, if item non-response makes
one or more of the SDQ scores unavailable to us and to the assessors, the forms of (4) and (5) or (6) change to take account of the more limited information available.
3.1
Estimates of the measurement model
What can be identified from this measurement model? Equations (1) and (3) imply the following reduced form SDQ models:
Yij =Xi(λjβ+αj) + (Vij +λjUi) , j=P, C, T (7)
Thus regression analysis of the SDQ scores conditional on Xi identifies coefficient vectors
(λjβ+αj)for each observerj =P, C, T. In theCi = ∅regime, the probit model (5) identifies
bjSY.X/στ for each j =P, C, T and [β− ∑jb j
SY.X(λjβ+αj)] /στ. Consequently, β/στ can be
Estimates of the measurement model can be computed using maximum likelihood es-timation of a system comprising (5), (6) and (7), parameterised in terms of β/στ, µτ/στ,
{(bjSY.X/στ),(λjβ+αj), j=P, C, T}and{(ωC/στ),(bPSY.CX, bCSY.CX, bTSY.CX)/ωC, eachCi ∈C},
where C is the set of three possible non-empty configurations of contingent information, ΩiP,ΩiC or (ΩiP,ΩiC). To allow for item or individual non-response in the SDQ for
chil-dren or teachers, as well as the response-triggered contingent information, we consider four missing data regimes:3(i) Y
iP, YiC, YiT all observed, with coefficients θP.P CT, θC.P CT, θT .P CT;
(ii) YiP, YiC observed, with coefficients θP.P C, θC.P C; (iii)YiP, YiT observed, with coefficients
θP.P T, θT.P T; (iv) only YiP observed, with coefficient θP.P. We parameterise the scale factors
as στ/ω = expψPνiP +ψCνiC, where νij is the amount of contingent information supplied
by observer j, ranging from νij = 0 for no additional information to νij = 3 for contingent
information on all three aspects of conduct, emotional disorder and hyperactivity.
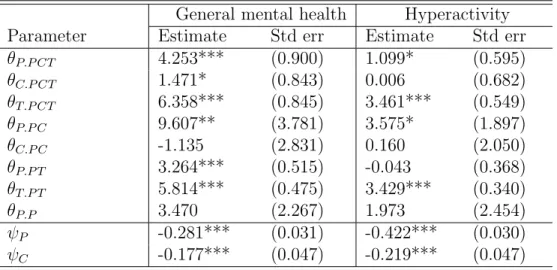
Parameter estimates of the psychiatric assessment model are given in Table 2. The θ -parameters indicate that, when available, assessors give greatest weight to teacher’s SDQ reports, slightly less to the parental report and considerably less to the child’s own self-assessment. The ψ-parameters are negative, which is consistent with the theoretical predic-tion thatστ/ω<1 and indicates that additional contingent information has value in clarifying
the circumstances which led to the problematic self-assessment.
3A few observations involved other combinations of missingness in the SDQ measures; these observations
Table 2 Estimated parameters of the psychiatric assessment process General mental health Hyperactivity
Parameter Estimate Std err Estimate Std err
θP.P CT 4.253*** (0.900) 1.099* (0.595) θC.P CT 1.471* (0.843) 0.006 (0.682) θT.P CT 6.358*** (0.845) 3.461*** (0.549) θP.P C 9.607** (3.781) 3.575* (1.897) θC.P C -1.135 (2.831) 0.160 (2.050) θP.P T 3.264*** (0.515) -0.043 (0.368) θT.P T 5.814*** (0.475) 3.429*** (0.340) θP.P 3.470 (2.267) 1.973 (2.454) ψP -0.281*** (0.031) -0.422*** (0.030) ψC -0.177*** (0.047) -0.219*** (0.047) Significance: * = 10%; ** = 5%; *** = 1%
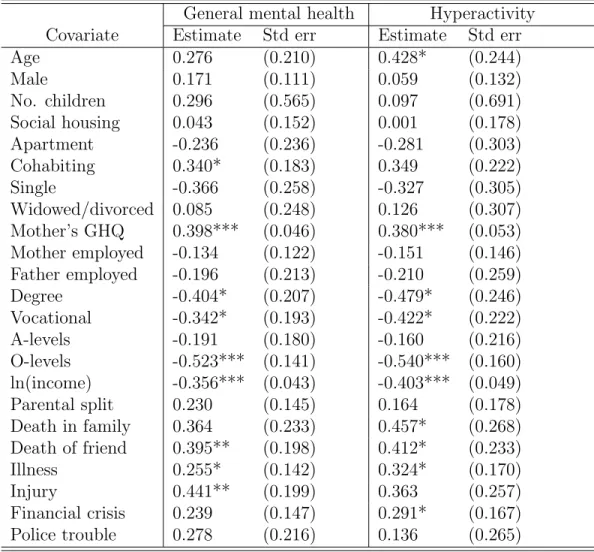
The estimates of β∗ are shown in Table 3. Recall that these are estimates of the
arbitrarily-scaled coefficient vector β/σω, so it is only the significance of each coefficient
and their relative magnitudes that are meaningful here. Maternal education of any kind has a substantial positive influence on the child’s mental health, comparable to major adverse life events including loss of a parent through death or divorce/separation and past experience of serious illness or injury. There is some evidence of inter-generational transmission of mental health problems, since the mother’s own GHQ measure of mental (ill-)health is found to have a modest but significantly negative influence on the child’s mental state. For example, if the GHQ score were to double from the mean level of 0.3 to 0.6, the predicted impact on the child’s mental disorder would be around a third as great as the impact attributable to the absence of maternal educational attainment, or to the death of a friend or serious illness or injury during childhood. Indicators of social disadvantage, do not have a large influence: housing type and tenure are statistically insignificant and, although log household income has a significant protective effect on child mental health, a very large income increase of around 170% would be required to produce an effect comparable to that of maternal education or adverse life events. We find no statistically significant evidence of an effect for the child’s age (for general mental health) and gender or for the parents’ employment or partnership
status, in contrast with the SDQ reduced form estimates presented in Appendix Table A3 (general health) and Table A4 (hyperactivity).
Table 3 Estimated coefficients (β/στ) for latent mental disorder equation
General mental health Hyperactivity
Covariate Estimate Std err Estimate Std err
Age 0.276 (0.210) 0.428* (0.244) Male 0.171 (0.111) 0.059 (0.132) No. children 0.296 (0.565) 0.097 (0.691) Social housing 0.043 (0.152) 0.001 (0.178) Apartment -0.236 (0.236) -0.281 (0.303) Cohabiting 0.340* (0.183) 0.349 (0.222) Single -0.366 (0.258) -0.327 (0.305) Widowed/divorced 0.085 (0.248) 0.126 (0.307) Mother’s GHQ 0.398*** (0.046) 0.380*** (0.053) Mother employed -0.134 (0.122) -0.151 (0.146) Father employed -0.196 (0.213) -0.210 (0.259) Degree -0.404* (0.207) -0.479* (0.246) Vocational -0.342* (0.193) -0.422* (0.222) A-levels -0.191 (0.180) -0.160 (0.216) O-levels -0.523*** (0.141) -0.540*** (0.160) ln(income) -0.356*** (0.043) -0.403*** (0.049) Parental split 0.230 (0.145) 0.164 (0.178) Death in family 0.364 (0.233) 0.457* (0.268) Death of friend 0.395** (0.198) 0.412* (0.233) Illness 0.255* (0.142) 0.324* (0.170) Injury 0.441** (0.199) 0.363 (0.257) Financial crisis 0.239 (0.147) 0.291* (0.167) Police trouble 0.278 (0.216) 0.136 (0.265) Significance: * = 10%; ** = 5%; *** = 1%
3.2
Bias in reporting error
The hypothesis of conditionally unbiased reporting by all observers is clearly rejected: A Wald test of the hypothesis of reduced form coefficients equal across observers gives a test statistic (distributed asχ2(48)underH
0) of 2,201.4 and 1,344.9 for general mental health and
hyperactivity respectively. There is also a highly significant difference between the reduced form coefficients for each pair of observers,(P, C),(P, T)and(C, T). Thus we can definitely
rule out the unbiasedness restrictions λj =1 and αj =0 for all j.
Although the distortion parameters λj,αj are not identified, it is possible to draw some
inferences about the nature of the distortions. If, for some observer j and covariate xk,
the identifiable coefficients βk∗ and [λjβk+αjk] are of opposite sign, then αjk must have the
opposite sign toβk, implying that misreporting by observerj has the effect of attenuating or
even reversing the estimated impact ofxk on mental health. We examine this by conducting
tests of the hypothesis H0jk ∶ βk∗[λjβk+αjk] = 0 against the one-sided alternative H1jk ∶
βk∗[λjβk+αjk] =<0.4
This test generates significant results only for age, whereH0 can be rejected for all three
categories of observer at reasonable significance levels (P−values of 0.047, 0.044 and 0.086, for the parent, child and teacher respectively), implying a tendency for observers to understate the problems of older children and adolescents relative to younger children, by the standards of the fully-informed expert psychiatric assessment. This is perhaps unsurprising, since the early stages of the process of child development are often the focus of special attention, while the problems of older children and adolescents are often less visible to external observers and seem also to be under-acknowledged by young people themselves.
4
Mental health and educational attainment
Using the assumption that the informed expert assessment makes efficient and unbiased (but not necessarily perfectly accurate) use of available information, we have established that there exists substantial non-classical measurement error in at least two of the three assessments provided by the parent, child and teacher. We now turn to the consequences of this biased reporting for inferences about the causal impact of child mental health on educational development.
4Note that this is a very conservative test, since sign conflicts betweenβ∗
k and αjk need not generate a corresponding sign conflict in the reduced form coefficients.
The degree of educational attainment relative to the child’s age is denotedAiand assumed
to be related to mental health Si and other covariates Xi as follows:
Ai=ρSi+Xiδ+ηi (8)
whereηi is a normally-distributed regression residual, which may be correlated with some or
all of the SDQ residualsVij. Our results are based on the model (8) with dependent variable
Ai defined as the difference between the child’s educational age and actual age. A similar
model with the dependent variable re-expressed as a proportion of actual age gave similar results but a considerably worse sample fit and those results are not presented here.
4.1
Scaling
Since the mental health variable is unobserved, its scale is arbitrary and the magnitude of
ρ cannot be interpreted without an appropriate scale normalisation. The identifiable vector
β∗ =β/στ contains the coefficients relevant to Si/στ, and the coefficient of this variable in
the education equation would be ρστ. This is not a helpful normalisation: one would like to
be able to rescale the latent variable S to have unit variance, so that its coefficient can be interpreted as the impact on educational performance of a 1-standard deviation change in the measure of mental disorder. However, var(Si/στ) is equal to β∗′V β∗+σu2/στ2, where V
is the variance matrix of Xi, rather than 1. The scale parameters σu and στ are unknown
and it is difficult to find convincing a priori information on them. We resolve this by using a range of normalisations based on alternative assumptions about the population R2 of the
relationship Si=Xiβ+Ui. Assume a particular value for R2 and multiplyβ∗ by the factor
κ=√R2/β∗′V β∗. Given an assumed R2, and estimates of β∗ and the variance matrixV,κ
is a known constant and the rescaling Si∗ =κSi/στ implies var(Si∗) ≡1. The corresponding
5
Identification of the mental health-education effect
Consider the reduced form for educational attainment, which reveals the inherent identifica-tion problem we face:
Ai=Xi(ρβ+δ) + (ηi+ρUi) (9)
Even with β known, ρ cannot be uniquely recovered from knowledge of the reduced form
coefficients(ρβ+δ). We explore three alternative identification strategies for the coefficient
ρ. The first rests on the assumption that one of the observers (parent, child or teacher) is unbiased and that his or her reporting error is uncorrelated with educational attainment: essentially the classical measurement error assumptions. The second approach is to use an exclusion restriction on the coefficient vector δ, which we implement in two distinct ways.
The third alternative is to use prior information on the residual covariances to reveal the sign and significance of ρ.
5.1
Covariance restrictions
Residual covariances provide information onρand this approach has previously been used by Kan and Pudney (2008) as a basis for identification in a study of time use involving a similar case of repeated-observation measurement error with biased observation. Our application differs from the Kan-Pudney study in that we do not impose the a priori assumption that a particular observer or mode of observation is unbiased and, consequently point-identification is not possible here.
Letcj be the residual covariance cov(Yij, Ai∣Xi)and σVjη be the covariance between the
random component of the measurement error for observer j and the random component of educational progress. Under our assumptions cj =σVjη+ρλjσ
2
u, implying:
ρ= cj−σVjη λjσu2
If we can rule out the possibility of a negative covariance between the random component of the SDQ measurement error (Vij) and the error in the education outcome (ηi), then cj/λjσu2
is an upper bound on the true mental health impact ρ. For parents and children (j =P, C), it may be reasonable to assume that there is no correlation between the observer’s error in reporting the child’s mental state and the unobserved contributors to the teacher’s report of educational attainment, so that σVjη = 0 and therefore sgn(ρ) = sgn(cj). A one-sided
test of the hypothesis H0 ∶ cj = 0 against H1 ∶ cj < 0 then establishes the sign of ρ. The
test remains valid (but loses power) if σVjη ≥ 0. We implement the test by estimating the
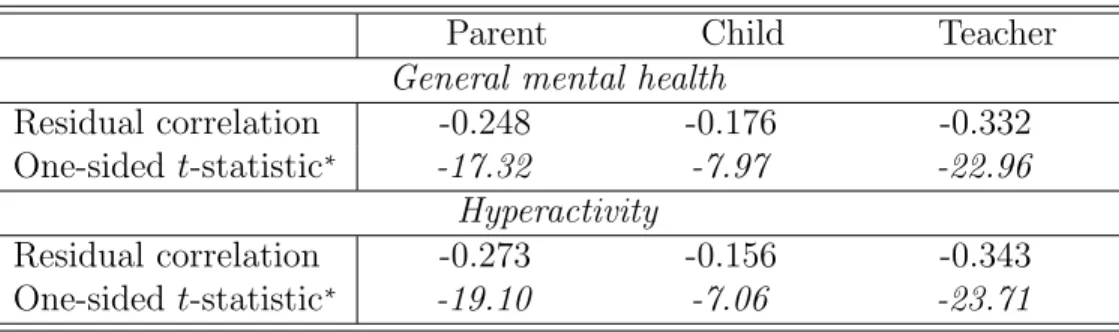
4-equation model comprising the reduced form equations (7) for parent, child and teacher observers, together with the education reduced form (9). We then use one-sided single-parameter Lagrange Multiplier tests to test separately the null hypotheses of zero error covariance between the residuals in the education equation and each of the SDQ equations. The results are given in Table 4. All correlations between the residuals from SDQ reduced forms and the education reduced form are negative and highly significant in one-sided tests (they would also be highly significant against 2-sided alternatives and if adjusted for multiple comparisons by using Bonferroni corrections). The conclusion from this pattern of residual covariances is that the impact of mental disorder on educational progress is negative.
For teachers, the assumption that σVTη ≥0 is questionable, since both SDQ and the
mea-sure of educational attainment are teacher-assessed. In this case, we might expect σVjη <0,
since a tendency to underrate a child’s educational achievement might accompany a tendency to overrate the same child’s degree of mental disorder due to confounding factors relating to the ‘quality’ of the child-teacher match. Then (10) would only imply ρ≥cj/(λTσ2u), which
does not unambiguously fix the sign of ρ. The evidence from Table 4 is consistent with this idea of correlated educational and mental health assessments from teachers, since the (nega-tive) correlation between SDQ and educational outcome is larger in magnitude for teachers than for parent or child and yields a more significant result.
Table 4 Tests of zero residual covariances between SDQ scores and school performance
Parent Child Teacher
General mental health
Residual correlation -0.248 -0.176 -0.332 One-sided t-statistic∗ -17.32 -7.97 -22.96 Hyperactivity Residual correlation -0.273 -0.156 -0.343 One-sided t-statistic∗ -19.10 -7.06 -23.71 * Computed ascorrelation×√n
5.2
Identification with an unbiased observer
The most common approach to estimation of models like (8) consists in using one of (or an average of) the SDQ scores as a proxy for the unobservedSi, but this fails to address either
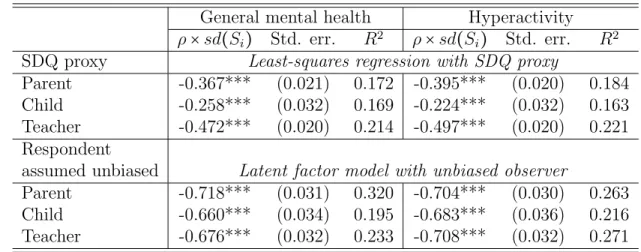
the classical measurement error problem or the additional problem of biased reporting by parents, children or teachers. The upper panel of Table 5 shows the estimates of the mental health-education impact that results from using one of the SDQ measures, scaled to have unit standard deviation, as a crude proxy for latent mental disorder; full parameter estimates are given in appendix Table A5. The estimates suggest that a 1-standard deviation increase in mental disorder has an average effect of retarding educational development by 3.1-5.7 months. Note that this is considerably smaller than the mean gap of 15 months between those with and without a diagnosed disorder (see Table 1).
A more sophisticated orthodox approach to the measurement error problem is to use a latent factor model, treating (1), (5), (6) and (8) as ‘measurement equations’ and (3) as the latent variable equation, assuming a priori that at least one of the SDQ measures is unbiased so that αj =0for some j, with the corresponding ‘loading’ λj normalised at unity
(see Bollen, 1989). Although we are reluctant to assume that parents, children and teachers are all unbiased observers, and have already rejected that hypothesis, it remains possible that one of the three types of observer is unbiased and we now explore the implications
of this for the mental health-education parameter ρ. The lower panel of Table 5 reports the estimate of the impact of mental health on educational attainment which results from estimating a conventional latent factor model under the restrictions λj = 1, αj = 0 and
Vij áUi, ηi,{Vik,allk ≠j} for a specific observer j ∈ {P, C, T}, giving three sets of estimates
as we take each observer in turn to be the one who is unbiased. Note thatρis fully identifiable in this case, so there is no normalisation problem to be dealt with, and we are also able to infer the value of R2 in the latent mental health equation. Table 5 presents the estimates
of ρ in the normalised form ρ×√β′V β+σ2
u, so that it represents the effect on the mean
educational deficit of a 1-standard deviation increase in latent mental disorder. If accepted, the results would suggest a substantial causal effect in the range 7.9-8.6 months’ educational deficit for a 1-standard deviation increase. These estimates imply an R2 of around 0.2-0.3
for the latent mental health equation which, as one would expect, exceed the R2 statistics
for the SDQ proxy regressions, which are depressed by the measurement noise they contain.
Table 5 The estimated mental health-education effect: unbiased observer
General mental health Hyperactivity
ρ×sd(Si) Std. err. R2 ρ×sd(Si) Std. err. R2
SDQ proxy Least-squares regression with SDQ proxy
Parent -0.367*** (0.021) 0.172 -0.395*** (0.020) 0.184
Child -0.258*** (0.032) 0.169 -0.224*** (0.032) 0.163
Teacher -0.472*** (0.020) 0.214 -0.497*** (0.020) 0.221
Respondent
assumed unbiased Latent factor model with unbiased observer
Parent -0.718*** (0.031) 0.320 -0.704*** (0.030) 0.263
Child -0.660*** (0.034) 0.195 -0.683*** (0.036) 0.216
Teacher -0.676*** (0.032) 0.233 -0.708*** (0.032) 0.271
Standard errors in parentheses; significance: * = 10%; ** = 5%; *** = 1%. All models include the covariates listed in Table 2
5.3
Exclusion restrictions on
δ
Now assume there is no observer known to be unbiased and consider the use of exclusion restrictions as a source of identification. Define b to be the reduced-form coefficient vector,
ρβ+δ, for educational performance. A zero restriction on thekth coefficient inδ implies that the corresponding coefficient in b is ρβk = (ρστ)(βk/στ) and, since β∗ =β/στ is identified
from the measurement model, the coefficient(ρστ)relevant to this normalisation is identified
uniquely as the ratio of thekth elements ofbandβ∗. The coefficientρστ can then be rescaled
in the formr=ρστ/κ, which is interpretable as the impact of a 1-standard deviation change in
mental health. The main problem with this approach is finding exclusion restrictions which can be strongly justified a priori – there are few factors influencing mental health which can confidently be asserted to have no direct causal influence on educational attainment. Of the covariates available for the model, our view is that only one is a plausible candidate for exclusion from δ. Some 6.8% of children in the sample have experienced the death of a
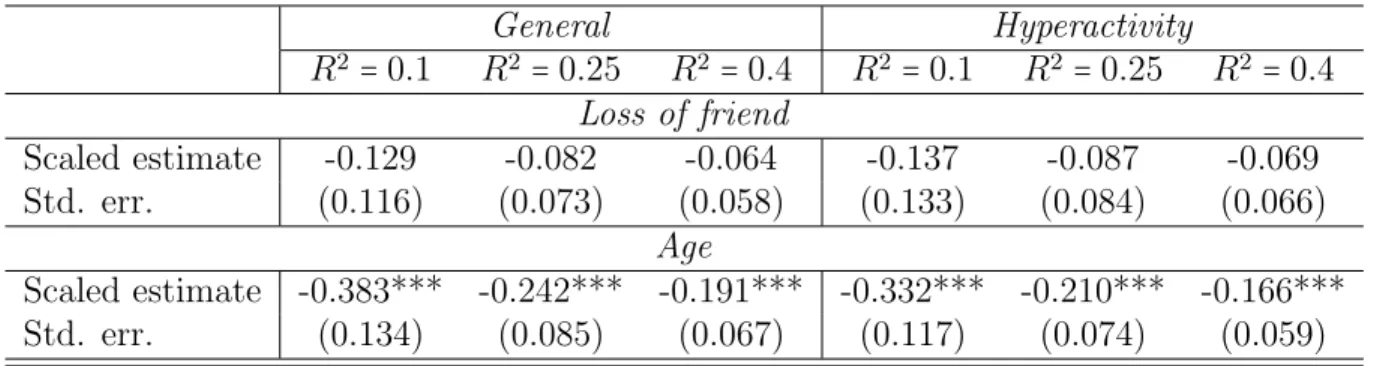
friend and reduced form estimates clearly show that these events have an impact on reported measures of the child’s mental health. Unlike the death of a parent (which may change the resources of parental time and interest invested in the child’s education), or injury or illness experienced by the child him/herself (which may interrupt schooling and study time), it seems reasonable to argue that the loss of a friend has no direct impact on the child’s education, but only an indirect one through his or her mental state. The estimates produced by imposing this exclusion are presented in Table 6, scaled to correspond to R2 levels in
the range 0.1-0.4 for the latent mental health equation. Although the standard errors are larger than we would like, so that the estimated impact is not significantly different from zero, it is still possible to reject unambiguously the hypothesis of an 8-9 month impact for a 1-standard deviation increase in mental disorder, as suggested by the conventional latent factor analysis.
Table 6 The estimated mental health-education effect: exclusion restrictions General Hyperactivity R2 =0.1 R2=0.25 R2=0.4 R2 =0.1 R2=0.25 R2 =0.4 Loss of friend Scaled estimate -0.129 -0.082 -0.064 -0.137 -0.087 -0.069 Std. err. (0.116) (0.073) (0.058) (0.133) (0.084) (0.066) Age Scaled estimate -0.383*** -0.242*** -0.191*** -0.332*** -0.210*** -0.166*** Std. err. (0.134) (0.085) (0.067) (0.117) (0.074) (0.059)
As an alternative to this direct a priori restriction, we also exploit a restriction on the effect of age which is suggested by the age-referenced nature of our educational attainment variable, Ai, derived from teachers’ responses to the following survey question:
“In terms of overall intellectual and scholastic ability, roughly what age level is he or she at?”
Let ei, ai and Zi represent respectively: the absolute level of the child’s achievement; his
or her age; and other personal characteristics, and write the age-specific achievement norm used by teachers as N(a), so that the child’s educational age reported by the teacher is
N−1(e
i). Now make the further assumptions that: (i) teachers use the population average as
their norm, so thatN(a) =E(e∣a); and (ii) achievement is generated by a normal regression structure: e∣a,Z ∼ N(θ1a+θ2Z, ωe2). Then our education variable is Ai = N−1(ei) −ai =
[ei−θ2E(Zi∣ai)]/θ1−ai and its conditional distribution is:
Ai∣ai,Zi ∼N( θ2 θ1 [ Zi−E(Zi∣ai)] , ω2 e θ2 1 ) (11)
This implies that Ai is independent of age if the covariates Zi are measured from
age-specific means, implying an exclusion restriction on the education equation. The sample is large enough to permit the removal of age-specific means to be done non-parametrically, rather than modeling the relationship between Z and age explicitly.
The lower panel of Table 6 shows the results from exploiting the age-referenced nature of the education variable in this way. It demonstrates that the classical measurement error analysis based on the assumption of an unbiased parent, child or teacher observer exaggerates the causal impact of mental health problems on the development of human capital through schooling. While the unbiased observer approach suggests that a 1-standard deviation in-crease in mental disorder causes on average an 8-9 month delay in educational development, the age restriction indicates an effect half that size or less, of around 2-5 months. Again, there is no evidence of any difference between the impact of mental disorder as measured by a general index covering hyperactivity, emotional and conduct disorders, or hyperactivity alone.
These estimates of the impact of mental health on educational progress are our preferred ones, since they do not rely on the suspect assumption that any particular type of observer is unbiased and they exploit the logical structure of our particular measure of educational at-tainment to generate an identifying restriction. It is striking that the estimated impact that results is very similar to the result obtained using SDQ variables as crude proxy variables (Table 5), while the conventional wisdom of the latent variable model with an unbiased ob-server produces considerably larger estimates. This underlines the proposition that, outside the unrealistic world of unbiased observation with classical measurement error, the conse-quences of dealing with partial and error-prone observations can have conseconse-quences that differ greatly from the simple reversal of attenuation bias.
6
Conclusions
We have focused on the role of child mental health as an influence on educational attain-ment, addressing a set of problems related to the measurement of the child’s state of mental health. These measurement difficulties generate two distinct identification problems. The
first relates to estimation of the relationship between mental health and personal and family characteristics: the strong evidence of bias in the reports given by parents, children and teachers means that the classical conditions for irrelevance of measurement error in a re-gression dependent variable are not met. We have overcome this by using a unique dataset which includes a detailed psychiatric assessment, together with a theory (essentially rational expectations) of the behaviour of these assessors, to identify a latent mental health model. However, a second identification problem arises when the educational process is introduced, since natural measures of mental health generated from this latent model are collinear with other explanatory covariates used in the education model. We use two alternative exclusion restrictions which can be argued to be valid theoretically and have sufficient empirical power to contribute useful identifying information. One is the experience of a death of a child-hood friend, which is hypothesised to influence education only indirectly through its impact on the mental health of the child. The second is an age restriction which flows from the age-referenced nature of our educational attainment measure.
We have found that mental disorders are strongly influenced by family history and back-ground, particularly by the mother’s own mental health and education, also by major adverse life events such as the death of a friend or serious illness or injury. The decision-making by expert assessors, which is the key to these conclusions, places greatest weight on the views of teachers, rather less on those of parents and little weight on the self-assessments by young people themselves. Diagnostic behaviour by psychiatric assessors reflects the configuration of information that is available to them.
The impact of mental disorder on educational attainment is significant and, using our preferred strategy based on exclusion restrictions, appears to be moderate – a loss of approx-imately 2-5 months educational progress for a 1-standard deviation increase in ‘true’ latent mental disorder. This is closer to the estimate generated by a crude proxy-variable regression which ignores the measurement error problem, than the much larger estimate produced by
a multi-indicator latent variable model based on the assumption that at least one of the non-expert observers is unbiased.
On a methodological level, this study exemplifies four important points. First, the mea-surement error in survey reports of children’s mental state is large, not uniform across types of observer (parents, children and teachers), and far from the ‘classical’ measurement error assumptions embodied in standard latent factor models. The biases that result from the sort of measurement difficulty addressed in this paper can be complex and unexpected in structure and direction. Making allowance for this non-standard form of observation error makes a substantial difference to research findings on issues like the socio-economic gradient in child mental health.
Second, like many other important research issues in the social sciences, the link between child mental health and educational attainment is beset by identification difficulties, and the preferred strategy of using controlled (or ‘natural’ quasi-) experiments is unavailable because of the nature of the phenomena of interest. Despite this, it is possible to draw some important and strong conclusions without a full solution to the identification problem.
Third, we have shown that it cannot be taken for granted that a conventional ‘solution’ to a measurement problem is necessarily better than ignoring the problem. In this case, our preferred estimate of the impact of mental disorder on educational progress (which exploits the specific structure of our measure of educational achievement) is considerably smaller than the range of estimates produced by a conventional latent variable analysis based on the assumption of an unbiased observer – and it is much closer to estimates from crude proxy variable regressions. If we are interested primarily in the mental health-education effect, the extra sophistication of the latent variable approach would be positively harmful.
Finally, we have shown the value of evidence that combines standard survey self-reported information with deeper expert assessments, bringing us closer to the ideal situation where
there exists an unbiased observer. The UK Survey of the Mental Health of Children and Young People provides a model for this sort of evidence and its potential is substantial, par-ticularly if the design could be extended to give a longitudinal picture of child development.
References
[1] Bago d’Uva, T., van Doorslaer, E., Lindeboom, M. and ODonnell, O. (2007). Does reporting heterogeneity bias the measurement of health disparities? Health Economics 17, 351-375.
[2] Baker, M., Stabile, M., Deri, C. (2004). What do self-reported objective measures of health measure? Journal of Human Resources 39, 1067-1093.
[3] Bollen, K. A. (1989), Structural equations with latent variables, New York: Wiley. [4] Breslau, J., Lane, M., Sampson, N. and Kessler, R. C. (2008) Mental disorders and
sub-sequent educational attainment in a us national sample,Journal of Psychiatric Research 42, 708-716.
[5] Breslau, J., Miller, E., Breslau, N., Bohnert, K., Lucia, V. and Schweitzer, J. (2009). The impact of early behavior disturbances on academic achievement in high school,
Pediatrics 123, 1472-1476.
[6] Brown, J. D., Wissow, LS. And Gadomski, A. (2006). Parent and teacher mental health ratings of children using primary care services: Inter-rater agreement and implications for mental health screening. Ambulatory Pediatrics 6, 347-351.
[7] Butler, J., Burkhauser, R. V., Mitchell, J. M. and Pincus, T. P. (1987). Measurement error in self-reported health variables. Review of Economics and Statistics 69, 644-650. [8] Currie, J., Stabile, M., Manivong, P., Roos, L. L. (2010). Child health and young adult
outcomes, Journal of Human Resources 45, 517-548.
[9] Currie, J. (2009). Healthy, wealthy, and wise? Socioeconmic status, poor health in childhood, and human capital development, Journal of Economic Literature 47, 87-122.
[10] Currie, J. and Stabile, M. (2006) Child mental health and human capital accumulation: the case of ADHD, Journal of Health Economics 25, 1094-1118.
[11] Currie, J. and Stabile, M. (2007) Mental health in childhood and human capital, NBER Working Paper 13217
[12] Duncan, G. and Magnuson, K. (2009) The nature and impact of early achievement skills, attention and behavior problems. Paper prepared for conference Rethinking the Role of
Neighborhoods and Families on Schools and School Outcomes for American Children,
November 19-20, 2009.
[13] Etil´e, F. and Milcent, C. (2006). Income-related reporting heterogeneity in self-assessed health: Evidence from France. Health Economics 15, 965-981.
[14] Goodman, R., Ford, T., Simmons, H., Gatward, R. and Meltzer, H. (2000). Using the Strengths and Difficulties Questionnaire (SDQ) to screen for child psychiatric disorders in a community sample. British Journal of Psychiatry 177, 534539.
[15] Heckman, J. J., Moon, S. H., Pinto, R., Savelyev, P. and Yavitz, A. (2010). Analyzing social experiments as implemented: a reexamination of the evidence from the HighScope Perry Preschool Program, Quantitative Economics 1, 1-46.
[16] Heckman, J. J., Stixrud and Urzua, S. (2006). The effects of cognitive and noncognitive abilities on labor market outcomes and social behavior, Journal of Labor Economics 24 411-82.
[17] Hu, Y. and Schennach, S. M. (2008). Instrumental Variable Treatment of Nonclassical Measurement Error Models, Econometrica 76, 195-216.
[18] Johnston, DW., Propper, C. and Shields, MA. (2009). Comparing subjective and ob-jective measures of health: Evidence from hypertension for the income/health gradient.
Journal of Health Economics 28, 540-552.
[19] Johnston, D. W., Propper, C., Pudney, S. E. and Shields, M. A. (2010). Is there an income gradient in child health? It depends whom you ask. Bonn: IZA Discussion Paper no. 4830.
[20] Jones, A. M. and Wildman, J. (2008). Health, income and relative deprivation: Evidence from the BHPS. Journal of Health Economics 27 308-324.
[21] Kan, M.-Y. and Pudney, S. E. (2008). Measurement error in stylized and diary data on time use. Sociological Methodology 38, 101-132.
[22] Lindeboom M and van Doorslaer, E. (2004). Cut point shifts and index shift in self-reported health. Journal of Health Economics 23, 1083-1099.
[23] Mackenbach, J. P., Looman, C. W. N. and van der Meer, J. B. W. (1996). Differences in the misreporting of chronic conditions, by level of education: The effect of inequalities in prevalence rates. American Journal of Public Health 86, 706-711.
[24] Youngstrom, E., Findling, R. L. and Calabrese, J. R. (2003). Who are the comorbid ado-lescents? Agreement between psychiatric diagnosis, youth, parent, and teacher report.
Appendix: Additional tables
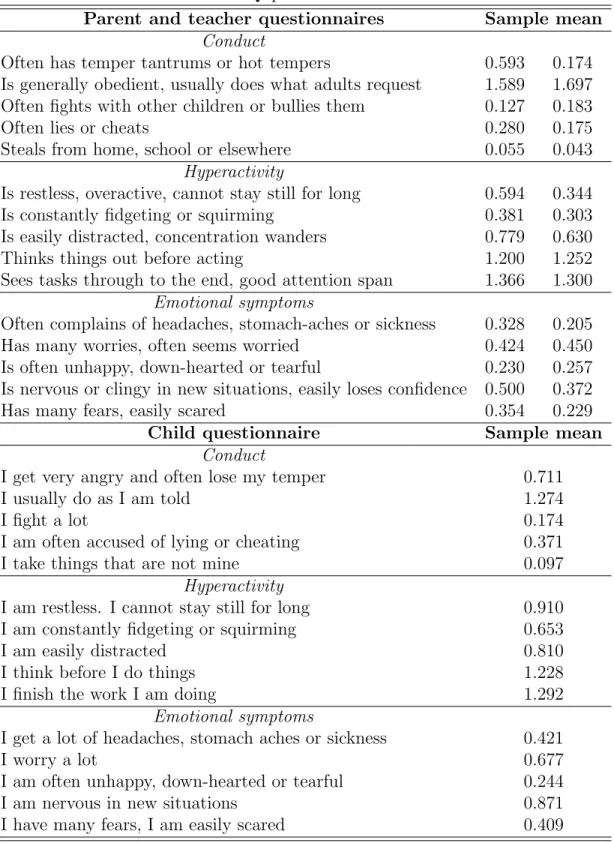
Table A1 SDQ questions
Parent and teacher questionnaires Sample mean Conduct
Often has temper tantrums or hot tempers 0.593 0.174
Is generally obedient, usually does what adults request 1.589 1.697 Often fights with other children or bullies them 0.127 0.183
Often lies or cheats 0.280 0.175
Steals from home, school or elsewhere 0.055 0.043
Hyperactivity
Is restless, overactive, cannot stay still for long 0.594 0.344
Is constantly fidgeting or squirming 0.381 0.303
Is easily distracted, concentration wanders 0.779 0.630
Thinks things out before acting 1.200 1.252
Sees tasks through to the end, good attention span 1.366 1.300 Emotional symptoms
Often complains of headaches, stomach-aches or sickness 0.328 0.205
Has many worries, often seems worried 0.424 0.450
Is often unhappy, down-hearted or tearful 0.230 0.257
Is nervous or clingy in new situations, easily loses confidence 0.500 0.372
Has many fears, easily scared 0.354 0.229
Child questionnaire Sample mean
Conduct
I get very angry and often lose my temper 0.711
I usually do as I am told 1.274
I fight a lot 0.174
I am often accused of lying or cheating 0.371
I take things that are not mine 0.097
Hyperactivity
I am restless. I cannot stay still for long 0.910
I am constantly fidgeting or squirming 0.653
I am easily distracted 0.810
I think before I do things 1.228
I finish the work I am doing 1.292
Emotional symptoms
I get a lot of headaches, stomach aches or sickness 0.421
I worry a lot 0.677
I am often unhappy, down-hearted or tearful 0.244
I am nervous in new situations 0.871
Table A2 Sample summary statistics
Without With
diagnosed diagnosed All children condition condition
Age 1.053 1.045 1.141 Male 0.513 0.505 0.599 No. children 0.209 0.208 0.218 Social housing 0.207 0.188 0.400 Apartment 0.057 0.055 0.070 Cohabiting 0.096 0.093 0.126 Single 0.087 0.083 0.128 Widowed/divorced 0.148 0.135 0.284 Mother’s GHQ 0.296 0.286 0.401 Mother employed 0.686 0.701 0.519 Father employed 0.693 0.713 0.478 Degree 0.142 0.149 0.068 Vocational 0.126 0.130 0.090 A-levels 0.117 0.118 0.100 O-levels 0.314 0.321 0.240 ln(income) 1.013 1.015 0.983 Parental split 0.316 0.295 0.537 Death in family 0.031 0.028 0.058 Death of friend 0.068 0.063 0.122 Illness 0.137 0.131 0.194 Injury 0.053 0.050 0.092 Financial crisis 0.129 0.120 0.224 Police trouble 0.057 0.050 0.136 Sample size 6808 6220 588
T able A3 Reduced for m co efficien ts for education and SDQ scores from full mo del: general index Co v ariate Education P aren t SDQ Child SDQ T eac her SDQ Age -0.038*** (0.006) -0.046*** (0.006) -0.037** (0.016) -0.034*** (0.006) Male -0.028*** (0.004) 0.039*** (0.004) 0.003 (0.005) 0.059*** (0.004) No. children -0.060*** (0.020) 0.043** (0.019) 0.058** (0.026) -0.011 (0.022) So cial housing -0.015*** (0.006) 0.022*** (0.006) 0.027*** (0.008) 0.024*** (0.006) Apartmen t 0.017* (0.009) -0.014* (0.008) -0.018 (0.012) -0.011 (0.009) Cohabiting -0.014** (0.007) 0.029*** (0.007) 0.011 (0.010) 0.024*** (0.007) Single 0.005 (0.011) -0.011 (0.010 ) -0.006 (0.015) -0.023** (0.012) Wido w ed/div orced 0.017* (0.010) -0.016* (0.009) 0.000 (0.013) -0.015 (0.011) Mother’s GHQ -0.006*** (0.002) 0.036*** (0.002) 0.020*** (0.003) 0.014*** (0.002) Mother emplo y ed 0.008* (0.005) -0.003 (0.004 ) 0.003 (0.006) -0.009* (0.005) F ather emplo y ed 0.016* (0.008) -0.006 (0.008 ) -0.001 (0.010) -0.020** (0.009) Degree 0.068*** (0.007) -0.064*** (0.007) -0.034*** (0.009) -0.047*** (0.007) V o catio nal 0.049*** (0.007) -0.046*** (0.006) -0.030*** (0.009) -0.030*** (0.007) A-lev els 0.041*** (0.007) -0.040*** (0.007) -0.029*** (0.009) -0.025*** (0.007) O-lev els 0.025*** (0.005) -0.030*** (0.005) -0.015** (0.007) -0.019*** (0.005) ln(income) 0.205*** (0.039) -0.198*** (0.036) -0.071 (0.051) -0.111*** (0.041) P aren tal split -0.016*** (0.006) 0.020*** (0.005) 0.010 (0.007) 0.031*** (0.006) Death in family -0.027** (0.011) 0.029*** (0.011) 0.008 (0.014) 0.029** (0.012) Death of friend -0.010 (0.008) 0.016** (0.007) 0.032*** (0.009) 0.024*** (0.008) Illness -0.015*** (0.006) 0.023*** (0.005) 0.017** (0.008) 0.007 (0.006) Injury -0.011 (0.009) 0.024*** (0.008) 0.039*** (0.011) 0.018* (0. 009) Financial crisis 0.010* (0.006) 0.011** (0.006) 0.006 (0.007) 0.0 09 (0. 006) P olice trouble -0.005 (0.009) 0.041*** (0.008) 0.018 (0.011) 0.025*** (0.009)
T able A4 Reduced for m co efficien ts for education and SDQ scores from full mo del: h yp e rac tiv it y index Co v ariate Education P aren t SDQ Child SDQ T eac her SDQ Age -0.037*** (0.008) -0.087*** (0.010) -0.026 (0.024) -0.076*** (0.011) Male -0.028*** (0.004) 0.104*** (0.006) 0.034*** (0.008) 0.151*** (0.007) No. children -0.056*** (0.021) -0.024 (0.032 ) -0.016 (0.041) 0.018 (0.037) So cial housing -0.016*** (0.006) 0.026*** (0.009) 0.018 (0.012) 0.043*** (0.010) Apartmen t 0.017* (0.009) -0.013 (0.013 ) -0.012 (0.019) -0.018 (0. 016) Cohabiting -0.014* (0.007) 0.054*** (0.010) 0.011 (0.015) 0.051*** (0.012) Single 0.004 (0.011) -0.018 (0.016 ) 0.000 (0.023) -0.025 (0.018) Wido w ed/div orced 0.017* (0.010) -0.024 (0.015 ) -0.010 (0.019) -0.030* (0.017) Mother’s GHQ -0.007*** (0.002) 0.034*** (0.003) 0.023*** (0.004) 0.014*** (0.003) Mother emplo y ed 0.008* (0.005) 0.001 (0.007) 0.011 (0.010) -0.004 (0.008) F ather emplo y ed 0.016** (0.008) -0.006 (0.012 ) 0.003 (0.016) -0.032** (0.014) Degree 0.068*** (0.008) -0.107*** (0.011) -0.044*** (0.014) -0.088*** (0.013) V o catio nal 0.049*** (0.007) -0.069*** (0.011) -0.035*** (0.013) -0.043*** (0.012) A-lev els 0.041*** (0.007) -0.051*** (0.010) -0.043*** (0.014) -0.046*** (0.012) O-lev els 0.025*** (0.005) -0.035*** (0.008) -0.015 (0.010) -0.035*** (0.009) ln(income) 0.200*** (0.041) -0.231*** (0.062) -0.040 (0.079) -0.127* (0.073) P aren tal split -0.015*** (0.006) 0.030*** (0.008) 0.016 (0.011) 0.052*** (0.010) Death in family -0.029*** (0.011) 0.045*** (0.017) 0.011 (0.023) 0.040** (0.020) Death of friend -0.009 (0.007) 0.025** (0.012) 0.045*** (0.014) 0.024* (0.014) Illness -0.016*** (0.005) 0.031*** (0.008) 0.028** (0.012) 0.013 (0.010) Injury -0.010 (0.010) 0.030** (0.013) 0.053*** (0.017) 0.036** (0.0 15) Financial crisis 0.010* (0.006) 0.007 (0.009) 0.020* (0.011) 0.021** (0.010) P olice trouble -0.003 (0.009) 0.042*** (0.013) 0.017 (0.019) 0.027* (0.015)
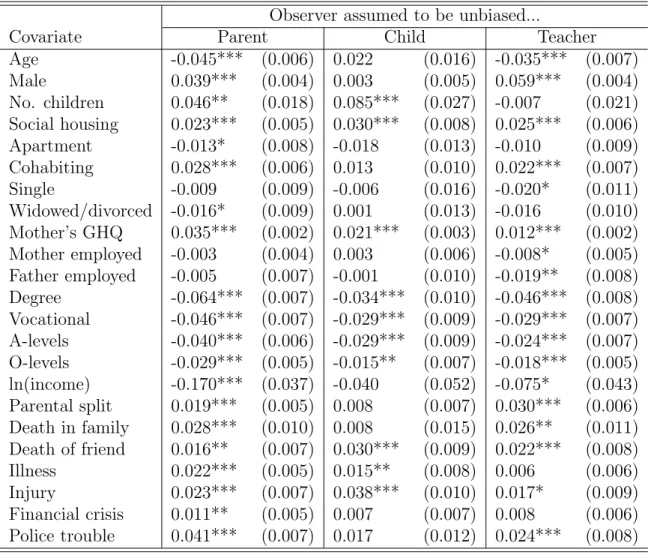
Table A5 Estimates of β with an unbiased observer
Observer assumed to be unbiased...
Covariate Parent Child Teacher
Age -0.045*** (0.006) 0.022 (0.016) -0.035*** (0.007) Male 0.039*** (0.004) 0.003 (0.005) 0.059*** (0.004) No. children 0.046** (0.018) 0.085*** (0.027) -0.007 (0.021) Social housing 0.023*** (0.005) 0.030*** (0.008) 0.025*** (0.006) Apartment -0.013* (0.008) -0.018 (0.013) -0.010 (0.009) Cohabiting 0.028*** (0.006) 0.013 (0.010) 0.022*** (0.007) Single -0.009 (0.009) -0.006 (0.016) -0.020* (0.011) Widowed/divorced -0.016* (0.009) 0.001 (0.013) -0.016 (0.010) Mother’s GHQ 0.035*** (0.002) 0.021*** (0.003) 0.012*** (0.002) Mother employed -0.003 (0.004) 0.003 (0.006) -0.008* (0.005) Father employed -0.005 (0.007) -0.001 (0.010) -0.019** (0.008) Degree -0.064*** (0.007) -0.034*** (0.010) -0.046*** (0.008) Vocational -0.046*** (0.007) -0.029*** (0.009) -0.029*** (0.007) A-levels -0.040*** (0.006) -0.029*** (0.009) -0.024*** (0.007) O-levels -0.029*** (0.005) -0.015** (0.007) -0.018*** (0.005) ln(income) -0.170*** (0.037) -0.040 (0.052) -0.075* (0.043) Parental split 0.019*** (0.005) 0.008 (0.007) 0.030*** (0.006) Death in family 0.028*** (0.010) 0.008 (0.015) 0.026** (0.011) Death of friend 0.016** (0.007) 0.030*** (0.009) 0.022*** (0.008) Illness 0.022*** (0.005) 0.015** (0.008) 0.006 (0.006) Injury 0.023*** (0.007) 0.038*** (0.010) 0.017* (0.009) Financial crisis 0.011** (0.005) 0.007 (0.007) 0.008 (0.006) Police trouble 0.041*** (0.007) 0.017 (0.012) 0.024*** (0.008)