BEN-GURION UNIVERSITY OF THE NEGEV FACULTY OF ENGINEERING SCIENCES
DEPARTMENT OF INDUSTRIAL ENGINEERING AND MANAGEMENT
Enhancing Business-Intelligence Tools with
Value-Driven Recommendations
THESIS SUBMITTED IN PARTIAL FULFILLMENT OF THE REQUIREMENTS FOR THE M.Sc. DEGREE
Yoav Kolodner
BEN-GURION UNIVERSITY OF THE NEGEV FACULTY OF ENGINEERING SCIENCES
DEPARTMENT OF INDUSTRIAL ENGINEERING AND MANAGEMENT
Enhancing Business-Intelligence Tools with
Value-Driven Recommendations
THESIS SUBMITTED IN PARTIAL FULFILLMENT OF THE REQUIREMENTS FOR THE M.Sc. DEGREE
By: Yoav Kolodner Supervised by: Dr. Adir Even
Author: Yoav Kolodner ………. Date: ………
Supervisor: Dr. Adir Even ………. Date: ……… Chairman of Graduate Studies Committee: Prof. Josef Kreimer
………. Date: ………
Acknowledgments
First, I would like to thank my supervisor, Dr. Adir Even, for his dedication, commitment and active involving in all aspects of this research. Thank you for sharing with me your experience, ideas, time and most importantly, thank you for giving me a strong feeling of friendship.
My study was supported by a grant from Microsoft R&D Israel, and I thank them for their support. I would like to express my appreciation to Roy Varshavsky and Daniel Sitton from Microsoft, who helped me in the development of some of the new concepts presented in this research and their support in the design of the experimental environment.
Many thanks are due to Prof. Nava Pliskin who guided me throughout the 4th year project, and for always being there for a good advice. I would also like to appreciate Prof. Joachim Meyer. Discussions and cooperation with Prof. Meyer were essential for the success of the experiment conducted in the study.
Lastly, for my Mom, Dad and my dearest family, this work would not have happened without your love and everlasting support. You are my inspiration…
My deepest love to Jenny. Thank you for your love, your advice and for supporting me throughout the happy and more challenging times of this project.
Abstract
Business-intelligence (BI) tools are broadly adopted in organizations today, supporting activities such as business analytics, decision making, and performance measurement. However, usage of BI tools is not simple and could be improved if feedback about usage and how-to-use recommendations were available to users. This study proposes a feedback and recommendation mechanism (FRM), embedded in a BI tool, whose visual cues and guidelines are based on assessment of previous usage. Moreover, this study introduces value-driven usage metadata - a novel methodology for tracking and communicating a quantitative assessment of the value gained from using the data resources. This study investigates the usefulness and the impact of integrating the proposed FRM via a comprehensive laboratory experiment with 200 participants. The findings confirm that FRM integration can improve the usability of BI tools and increase the benefits gained from data resources, highlighting the potential benefits of collecting and using value-driven usage metadata to generate usage recommendations.
Keywords: Business Intelligence (BI), Data Warehouse, Metadata, Data Value, Recommender System, Decision Support System (DSS)
Table of Contents
1. Introduction ... 1
2. Literature Review ... 3
2.1. Business Intelligence ... 3
2.1.1. Data as a Critical Organizational Resource ... 4
2.1.2. Transactional versus Analytical Data Usage ... 5
2.1.3. The Data Warehouse ... 7
2.1.4. Business Intelligence ... 10
2.1.5. Metadata in Business Intelligence Environments ... 13
2.2. Data Usage and the Associated Business Value ... 15
2.2.1. Data Usage and Utility ... 15
2.2.2. Tracking Data Usage – Solutions and Issues... 18
2.3. Recommender Systems ... 21
2.3.1. Recommender Systems Evaluation ... 24
2.3.2. Accuracy and Trust Issues in Recommender Systems ... 25
2.4. Literature Review Summary ... 26
3. Conceptual Framework... 28
3.1. Frequency-Driven versus Value-Driven Usage Metadata ... 28
3.2. Value Driven Feedback and Recommendation Mechanisms ... 35
4. Method ... 38
4.1. Prototyping a Value-Driven Usage Metadata Module ... 39
4.1.1. Query Analysis and Value Allocation ... 40
4.2. Experimental Lab Testing ... 43
4.2.1. Experiment Settings ... 44
4.2.2. Experiment Task ... 46
4.2.3. Experiment Tools ... 47
5. Experiment Results ... 51
5.1. Data Collection and Preparation ... 51
5.2. FRM Integration and Decision Outcomes ... 55
5.3. FRM Integration and Usage Style ... 58
5.5. Discussion ... 65
6. Conclusions ... 67
6.1. Limitations and Directions for Future Research... 68
6.1.1. Value-driven Usage Metadata ... 68
6.1.2. FRM Integration ... 70
6.1.3. Integration and Evaluation in Real-World Business Contexts ... 71
7. References ... 72
8. Appendices ... 79
8.1. Appendix 1: Metadata Schema ... 79
8.2. Appendix 2: Experimental System Specification ... 82
8.3. Appendix 3: Participant's Agreement Form ... 85
8.4. Appendix 4: Experiment Guidelines ... 86
8.5. Appendix 5: Questionnaire ... 89
8.6. Appendix 6: Statistical Analysis ... 90
8.6.1. Normality Tests ... 90
8.6.2. Decision Value – FRM Effect ... 91
8.6.3. Clicks and Time – FRM Effect... 92
8.6.4. Questionnaire – FRM Related Questions only ... 93
8.6.5. Questionnaire – General BI Questions ... 94
8.6.6. Questionnaire – Cronbach's Alpha ... 95
8.6.7. Correlations ... 99
8.7. Appendix 7: ECIS 2009 Submission ... 100
List of Figures
Figure 1: Research's focus on analysis decision tasks (Nutt, 2002) ... 3Figure 2: The BI environment ... 4
Figure 3: Star schema and Snow flake schema (Chaudhuri and Dayal, 1997) ... 8
Figure 4: Basic DW architecture (Kimball et al., 2002) ... 9
Figure 5: Reporting using spreadshits ... 10
Figure 6: Oracle OLAP tool ... 11
Figure 8: Proactive statistical analysis... 12
Figure 9: Collaborative filtering approach – users' similarity affects the rating prediction ... 22
Figure 10: Amazon.com collaborative based recommender system ... 23
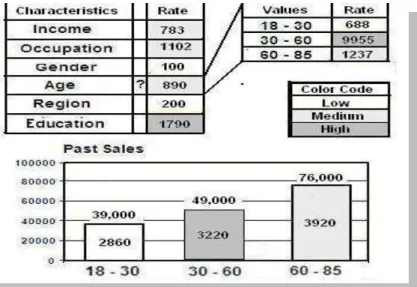
Figure 11: (a) Frequency-driven versus (b) Value-driven usage metadata ... 30
Figure 12: Example of frequency-driven and value-driven usage metadata assessment ... 33
Figure 13: Value-driven collection of usage metadata ... 34
Figure 14: A BI tool with FRM (Rates presented next to possible next steps of data analysis) .. 36
Figure 15: Pivot table with FRM ... 37
Figure 16: BI tool with collaborative based FRM ... 37
Figure 17: Metadata module architecture ... 40
Figure 18: Example of table Value_Dist ... 42
Figure 19: BI tool without FRM ... 48
Figure 20: BI tool with FRM ... 49
Figure 21: Decision screen ... 50
Figure 22: Campaign report ... 50
Figure 23: Control group, the effect of repetitive usage ... 56
Figure 24: First-session performance per group ... 56
Figure 25: Performance in session 2 ... 57
Figure 26: FRM by session effect ... 58
Figure 27: FRM by session effect on decision time ... 59
Figure 28: Clicks session effect ... 60
Figure 29: FRM related questions only ... 63
Figure 30: FRM related acceptance ... 64
Figure 31: Metadata repository table diagram ... 79
Figure 32: Example of table Integrate ... 82
Figure 33: Business DB diagram ... 83
Figure 34: User Management DB diagram ... 84
List of Tables
Table 1: OLTP versus OLAP ... 7Table 2: Literature review summary ... 27
Table 4: Participant demographics along the different experiment groups ... 51
Table 5: Survey questions ... 53
Table 6: Summary statistics for all participants ... 54
Table 7: Control variables effect ... 54
Table 8: Decision value analysis ... 55
Table 9: Time analysis ... 58
Table 10: Clicks analysis ... 59
Table 11: Session 1 correlations ... 61
Table 12: Session 2 correlations ... 61
Table 13: Perceived performance ... 62
Table 14: Usefulness, ease of use and acceptance... 62
Table 15: Usefulness, Ease of Use and Acceptance analysis (Session 2) ... 63
Table 16: Usefulness, rase of use, and acceptance analysis (Session 2, FRM-related questions) 64 Table 17: Table Trace – columns description ... 80
Table 18: Table Business_Task – columns description ... 80
Table 19: Table Value_Input – columns description ... 81
Table 20: Table Integrate – columns description ... 81
List of Abbreviations
API Application programming interface BI Business Intelligence
BPM Business Process Management COTS Commercial Of The Shelf DBMS Database Management System DDL Data Definition Language DL Digital Library
DML Data Manipulation Language DQM Data Quality Management DSS Decision Support System
DW Data Warehouse, Data Warehousing ER Entity Relationship
ERD Entity Relationship Diagram
ETL Extraction, Transformation and Loading FRM Feedback and Recommendation mechanism IP Internet Protocol
IS Information Systems IT Information Technology OLAP On Line Analytical Processing OLTP On Line Transaction Processing
RDBMS Relational Database Management System SQL Structured Query Language
1.
Introduction
Data repositories, along with the information systems (IS) utilizing them, have long been recognized as critical organizational resources. Recent years have witnessed a major transition toward extended usage of data resources for business analytics, performance measurement, and managerial decision support. This transition is driven by the notion that decisions based on evidence and data are likely to be better and thus help the organization thrive (Pfeffer and Sutton, 2006). Indeed, evidence exists about firms that gained competitive advantage by investing in the development of data analysis capabilities and data-driven analytics (Davenport, 2006). This transition toward data-driven management is well-supported by the rapid progress in the capacity and performance of information technologies (IT) for utilizing large data resources. Most notable is the broad adoption of business intelligence (BI) platforms and tools, which permit rapid development and distribution of data analysis and decision support utilities.
In the 2009 Gartner survey, responding chief information officers (CIOs) ranked BI as their #1 top technology-investment priorities (Gartner, 2009). High complexity, however, is a major limitation of current BI environments (Watson and Wixom, 2007). The common end-user, in search of an answer to a business question, often finds large data repositories too difficult to navigate for reaching the right data, and BI tools too complex to use for coming up with the right answer. Furthermore, in many cases the user knows neither the right business question to ask, nor the full range of capabilities offered by the BI tools and the underlying data repositories (Lawton, 2006).
To overcome these complexities, this study proposes to integrate a feedback and recommendation mechanism (FRM) into a BI tool and investigates the proposed integration. The proposed FRM generates textual and/or graphical visual cues, guiding the user to consider the use of certain data subsets and/or analysis forms. Recommender systems, like the proposed FRM, have been intensively explored and broadly adopted in contexts such as E-commerce and digital libraries, but rarely in the BI context. The main purpose of this research is to investigate whether the proposed FRM integration does improve the functionality of BI tools and thereby business decisions by facilitating effective and efficient navigation and by revealing the undiscovered potential of unused data and analysis forms.
In the proposed value-driven FRM, the recommendations are based on quantitative assessment of business-value gains and their attribution to the data resources being used. Since
data resources contribute value through their usage and integration within business processes, tracking the usage of data resources is essential for managing them effectively, and for understanding the associated value contribution. Usage tracking, or the collection of "usage metadata" (Shankaranarayanan and Even, 2004), is a relatively new concept in database environments which has not been significantly researched so far, and is currently supported only by a limited number of commercial tools. To facilitate the proposed FRM, this study develops a new form of usage metadata that tracks not only the frequency of using data objects, as commonly done today, but also includes quantitative assessments of the value gained by data usage, assigning value to different data elements (e.g., subsets of records and/or attributes) according to their former value contribution. The study also introduces a conceptual design and working prototype of the metadata layer that captures these value assignments.
The proposed FRM and the new concepts incorporated in it were investigated in a laboratory experiment involving 200 participants who were asked to use different FRM variants integrated into a BI tool to analyze a simulated sales database and to create promotion campaigns for a new product, based on their analysis. Following a set of rules, which guided the database simulation, each campaign was assigned with an objective value measure, later used for quantitative evaluation of the decision outcomes. Aspects of the participants' usage style and perceived contribution of FRM were also measured. The results show that the proposed value-based FRM significantly improves the effectiveness of using BI tools and also contribute important insights regarding the impact of FRM on usage behavior and on the perceived usefulness of BI tools.
The next sections provide the background for this research, introducing two novel concepts: the collection of value-driven usage metadata and the integration of FRM into BI tools. This is followed by a description of the laboratory experiment, analysis of its results, and a discussion of the findings and their implications. To conclude, limitations are discussed along with a few directions for future research and three potential contributions are outlined. First, this study proposes value-driven usage metadata, i.e., a novel methodology for tracking the usage of data resources which integrates assessments of the frequency of data usage and the associated value gains. Second, it presents the concept of integrating value-driven FRM into BI tools and highlights approaches for generating them. Finally, it explores the potential contribution of collecting value-driven metadata and generating value-based FRM through a comprehensive laboratory experiment.
2.
Literature Review
The following literature review, which sets the background for the research, begins with a survey of the BI environment, continues to discuss previous research on the IS usage and the associated business value, data resources in particular, and proceeds to cover recommender systems, their application in IS environments, and ways to measure and evaluate their success.
2.1.
Business Intelligence
This study focuses on assessing the usage patterns and the value-contribution of large data repositories, and ways to improve their use for analytical and decision-support purposes. Notably, not all forms of decisions need to be supported by vast amounts of data. Nutt (2002) defines four types of organizational decisions, different from each other by the clarity of objectives and the availability of means for decision making (Figure 1). The main focus of this research is on decisions in the "Analysis" upper-left quadrant of Figure 1 with well-defined goals and measureable performance that rely on the data available in the data repositories. The other decision types - Judgment, Bargaining and Inspiration - lack either a clear objective and/or the means for making the decision, while important and common organizations, are not within the scope of this research.
Figure 1: Research's focus on analysis decision tasks (Nutt, 2002)
The BI environment (Figure 2) has evolved from the concept of Decision Support Systems (DSS) as a dominant concept for supporting analytical usage (March and Hevner, 2007). At a high level, a typical BI architecture consists of (Kimball et al., 2002 Sen and Sinha, 2005):
1) Data Sources – data used for analysis are extracted from multiple source systems, including internal – e.g., operative systems inside the organization or external – e.g., the internet and commercial data vendors.
2) Extraction, Transformation and Loading (ETL) Mechanisms – data extracted from the
data sources are transformed into new data structures that are more suitable for analysis and loaded into a repository. Data transformation may include data cleansing (e.g. correcting misspellings and filling-in missing elements), aligning data formats between multiple sources and indexing to permit fast retrieval
3) Data Warehouse (DW) – the main data repository which organizes and stores archives of cleansed and well-structured data that meet the requirements of analytical usage.
4) BI Applications – front-end tools that the user interacts with, designed to support managerial decision making and permit effective and efficient data analysis.
Figure 2: The BI environment
BI components, concepts and relevant studies are reviewed next.
2.1.1. Data as a Critical Organizational Resource
Most organizations today depend on effective and efficient management of data repositories to support day-to-day business processes, meet regulatory requirements (Even and Shankaranarayanan, 2007), sell data as a commodity to other organizations (e.g., www.reuters.com, which sells financial quotes), and use analytically for decision support (Rhodes, 1993). Database management systems (DBMS) that manage data repositories are implemented and used in almost any industry and business domain including, for example, industrial production, commerce, finance, travel, and entertainment (Cooper et al., 2000; Watson et al., 2001; Davenport, 2006). A study of 32 leading organizations that collect and analyze
business data on a regular basis showed that these firms attribute much of their success to the masterful exploitation of data (Davenport, 2006). Data repositories have thus become among the most important organizational assets.
The management of data as a critical resource has to address the growing complexities, while supporting the fundamental goals of the enterprise (Levitin and Redman, 1998). The data repositories that organizations manage grow continuously and accumulate large volumes in the magnitude of Petabytes (see for example http://www.businessintelligencelowdown.com, which lists the world‟s largest databases in 2009), and their implementation requires a significant investment in data-management technology and formulation of companywide data-management strategies (Redman, 1996). Managing large data repositories is challenging for several possible reasons. First, data are not always aligned with the organization‟s business strategy, possibly leading to situations where vast amounts of data are collected, but the particular data elements needed to execute corporate strategy cannot be effectively accessed and remain unused (Levitin and Redman, 1998). Second, resource investment in data acquisition and data management technologies are high and often underestimated (Even and Shankaranarayanan, 2004). Third, supporting all business processes requires availability and accessibility of data resources to the many different data consumers which are not always guaranteed (Levitin and Redman, 1998). Fourth, maintaining high data quality, to avoid inaccuracy, incompleteness, duplications, inconsistency, or invalidity, can be very costly (Redman, 1996). Fifth, to deal with rapid changes in business environments, data repositories have to permit fast and inexpensive response to change. Finally, to deal with information-security breaches, systems that store and manage data must prevent unauthorized access, theft or loss of critical data (Elmasri and Navathe, 2006).
Large data repositories require constant maintenance and quality-assurance efforts to ensure effective use (Redman, 1996), including investment in implementing data quality monitoring tools, establishing data auditing and correction procedures, and appointing personnel for maintaining the data repositories (Wang, 1998). Data maintenance and quality assurance tasks are often being done without considering the economic aspects (Even, 2007). This study suggests that better understanding and linking usage of data to economic tradeoffs can make important contributions to the implementation of better data administration policies.
2.1.2. Transactional versus Analytical Data Usage
Data usage can be classified into two key categories: transactional data usage, often termed as On-Line Transactional Processing (OLTP), versus analytical data usage, often termed
as On-Line Analytical Processing (OLAP). This classification has major implications for design and administration of data resources (Kimball et al., 2002) and therefore understanding the fundamental differences between these two forms of data usage is important (Inmon, 1993).
A key role of OLTP applications is to automate the data processing (e.g. banking transactions, production events) that supports day-to-day operations and business processes in organizations. Such applications typically require detailed and up-to-date operational data which focus on a specific business entity or event (e.g., a customer, a product, or a sale transaction). Since data consumers retrieve and update only a small number of specific records during transaction processing, OLTP systems are required to support fast search, retrieval and processing of specific records, and guarantee high availability and recoverability, thus typically focusing on the most recent transactions and maintaining only limited historical data (Kimball et al., 2002). OLAP applications, on the other hand, typically support intelligent business analytics and managerial decision making. Such tasks often require access to large and diverse data resources, with the ability to aggregate vast amounts of data that have been collected over a long period of time; hence, OLAP databases need to store large volumes of data, and to support data-access queries, enabling rapid aggregation of data elements and permitting complex calculations (Chaudhuri and Dayal, 1997).
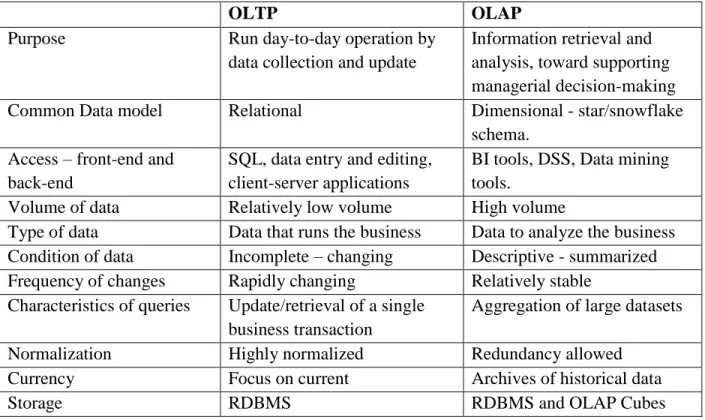
OLTP and OLAP applications are geared towards supporting different types of decisions. Typically the former support routine decisions, while for the latter support non-routine decisions which often require in-depth data analysis. Two examples for such business analysis tasks are: (a) Identifying the targeted list of customers for a marketing campaign – an important decision that a marketing manager would cope with when designing marketing campaigns is segmenting the customers database (typically managed in a CRM system), toward identifying which customer segments will be targeted by a certain campaign (Even et al., 2007); and (b) Identifying products for which the inventory policy has to change – decisions about which product to keep and at what stock level are important for retail and production firms that seek to lower their inventory costs and manage it efficiently (Ramanathan, 2006). Table 1 summarizes few key differences between OLTP and OLAP systems (Singh, 1998; Shankaranarayanan and Even, 2004). The difference most relevant to this work is the separation of the data environments that support OLAP from OLTP applications, with data warehouses supporting OLAP applications as described next.
OLTP OLAP
Purpose Run day-to-day operation by
data collection and update
Information retrieval and analysis, toward supporting managerial decision-making
Common Data model Relational Dimensional - star/snowflake
schema. Access – front-end and
back-end
SQL, data entry and editing, client-server applications
BI tools, DSS, Data mining tools.
Volume of data Relatively low volume High volume
Type of data Data that runs the business Data to analyze the business Condition of data Incomplete – changing Descriptive - summarized Frequency of changes Rapidly changing Relatively stable
Characteristics of queries Update/retrieval of a single business transaction
Aggregation of large datasets
Normalization Highly normalized Redundancy allowed
Currency Focus on current Archives of historical data
Storage RDBMS RDBMS and OLAP Cubes
Table 1: OLTP versus OLAP
2.1.3. The Data Warehouse
A DW supports the collection and the assessment of the critical business intelligence needed to understand and evaluate the firm within its environmental context (March and Hevner, 2007). The DW concept, first introduced by Inmon (1993), is aimed at managing data resources needed to support complicated analyses and serve as the foundation for improved managerial decision making. Providing consistent and reliable organizational data that can be easily accessed, DW data are often integrated into unified schemas through often-complex ETL processes from both internal (e.g., OLTP systems such as ERP) and external (e.g., online data feeds such as from the internet) sources.
The DW architecture and design are optimized for aggregating large datasets towards supporting reporting and data analysis needs. Methodologies such as the Entity-Relationship model (Chen, 1976), and the relational/normalized database design (Codd, 1970), while permitting optimizing databases for higher speed of retrieval, effective modification of specific data records, and prevention of data redundancies, are not optimal in terms of aggregation and retrieval of large datasets into a DW (Kimball et al., 2002). Hence, data warehouses often use a dimensional model composed of a fact table with a multi-attribute key that contains attributes, whose values are generally numeric and additive, with several tables, describing the data dimension, joining to the fact table as needed (Chaudhuri and Dayal, 1997). Dimensional models
have proved to be understandable, predictable, extendable, and highly resistant to the ad-hoc queries from groups of business users because of their relatively simple structure (Kimball et al., 2002; Sen and Sinha, 2005).
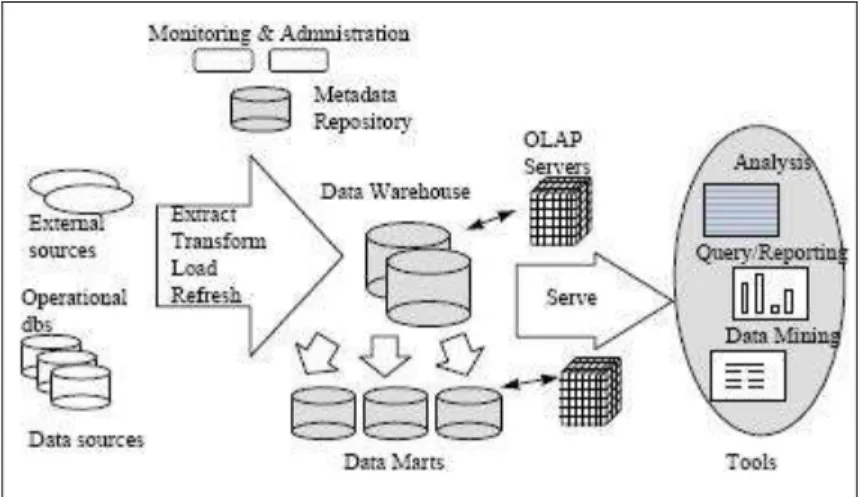
The characteristic structure of the physical representation of a dimensional model, called a star schema, can be extended to a snowflake schema by removing the low cardinality attributes in the dimensions and placing them in separate tables which are linked back into the dimension table with artificial keys (Figure 3). The data in the main DW repository can be re-arranged into subsets, commonly known as Data Marts (Figure 4), often aggregated and configured to accommodate specific decision-making processes, analyses or business questions via a variety of BI tools (Kimball et al., 2002). A DW and data mart can be organized in an OLAP cube structure, i.e., a data model which renders data into multidimensional perspectives, more efficiently supporting OLAP queries. For example, a data cube holding data for a sales application can have dimensions of product, location and time representing each of the sale transactions. The cube can be sliced on its different dimensions in order to get summarized data on one of the different products or time unit. Each of the dimensions can be summarized at different levels, ranging from the most summarized to the most detailed perspective and creating a dimensional hierarchy – each level of the hierarchy can be viewed by different users at different situations (Datta and Thomas, 1999). A Commonly-used commercial DBMS products (e.g., Oracle, MS-SQL and Sybase) support OLAP cubes alongside with the more traditional relational/tabular database structures.
Figure 4: Basic DW architecture (Kimball et al., 2002)
The implementation and the usage of DW have been associated with substantial benefits in organizations, as integrating multiple data sources, each reflecting different business aspects, and finding new sources of revenue in the given business environment by permitting rapid development of new analytical data usages (Watson et al., 2001), but at the same time, with significant difficulties. A few studies have described successful DW implementations in fields such as marketing, logistics and manufacturing, and demonstrated major contributions in large companies (Cooper et al., 2000; Even, 2007; Watson et al., 2001), e.g., reduce the amount of service calls in quality assuring department, help monitoring and analyze IRS tax payers, help marketing analysis for a financial services company, redefining corporate strategies, and supporting customer relationships management.
Other studies highlighted possible difficulties with DW projects, which might prevent firms that invest in DW solutions from achieving the desired performance (Lee et al., 2004), such as lack of managerial support (Wixom and Watson, 2000)., and severe data quality defects as a result of unsuccessful integration (Nelson et al., 2005). Large DWs, require constant maintenance and quality-assurance efforts to ensure effective use (Redman, 1996), especially since the DW stores data from heterogeneous databases associated with several transactional systems (Chaudhuri and Dayal, 1997), and given differences in naming, domain definitions, identification numbers, and the like. For example, upon changes in source database schemas, ETL processes must be adjusted accordingly to meet the changed definitions (Elmasri and Navathe, 2006). In addition, using heterogeneous set of databases as DW data sources requires getting full and ongoing support from all parts of the organization and senior management involvement (Davenport, 2006) since DW implementations often consist of major organizational changes and
involve interactions with many stakeholders from multiple organizational departments (Elmasri and Navathe, 2006).
2.1.4. Business Intelligence
The term BI describes applications and technologies used to gather, provide access to and analyze data about the organization for better business decisions (Druzdzel and Flynn, 2000; Lawton, 2006). In a survey of 1,500 CIOs, Gartner found that BI projects were the number one technology priority for 2009 (Gartner, 2009), and 68% of executives in top US firms believe that their company has to improve analytical capabilities to remain competitive (Accenture, 2009). Many companies, including retailers, telecommunications providers, travel agencies, and manufacturers, use BI for activities such as customer profiling, customer support, market research and segmentation, product profitability, and inventory and distribution analysis (Lawton, 2006). Mobile tools and wireless Internet protocols will likely to mark be among the next BI developments (Shim et al., 2002; Watson and Wixom, 2007).
BI incorporates mainly four different forms of analytical tools and data usage styles: 1. Reporting - Tools for creating and distributing batch versus ad-hoc reports. Batch reports
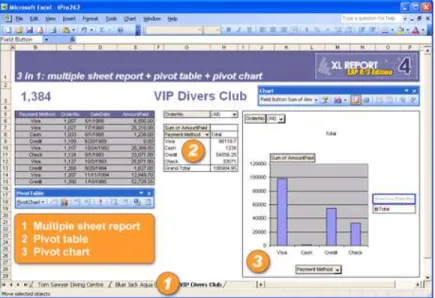
are typically created by an expert user and incorporate pre-defined structure and format, and distributed to users while ad-hoc reports are created by the users themselves. Spreadsheets (e.g., Microsoft Excel) are a common platform for generating reports (Figure 5), typically offering some BI capabilities such as pivot tables, and additional add-ons offered by BI vendors (Few, 2006).
2. OLAP tools – Tools for interactive inquiry of OLAP data cubes (Figure 6), which present aggregations of data and permit "Slice and Dice" and "Drill Down" into cube measures and dimensions (Chaudhuri and Dayal, 1997).
Figure 6: Oracle OLAP tool
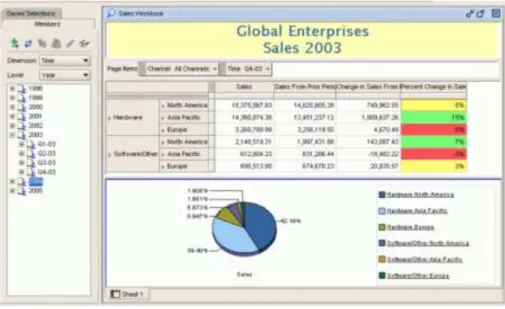
3. Digital Dashboards – Tools for snapshot overview of current business status, providing business performance measurement and key performance indicators (KPI) review and enabling business performance management (BPM) initiatives (Few, 2006). In a single or few screens, users can quickly see how actual performance compares to goals, benchmarks, and previous performance (Figure 7).
Figure 7: Dashboard with KPI in a Proclarity BI tool
4. Statistical Analysis tools – Tools for advanced reporting and data visualization which emphasize statistical tests (e.g. SPSS, SAS). Unlike simple reporting, statistical analysis
tools represent a proactive approach by not only reflecting what already happened but predicting future behavior (Figure 8).
Figure 8: Proactive statistical analysis
5. Data Mining - Tools for analyzing and finding knowledge in large datasets, which are typically automated or with minimal end-user intervention (Smyth, 2002).
A BI environment would typically incorporate a few of the tools described above. Watson and Wixom (2007) note a few facilitating conditions that encourage value generation from the BI environment. First, it is crucial that the use of information and analytics would be part of the organization‟s culture. Second, there need to be alignment between the business and BI strategies and senior management support of the BI strategy. Finally, it is important that users have the necessary training, and support to use the BI tools.
BI is especially valuable when the amount of available information elevate the intuition of an unaided human decision maker, and in which precision and optimality are important (Druzdzel and Flynn, 2000). Organizations realize the full value from their BI environment only when many employees use BI tools and BI benefits are spread to many departments and projects, thus getting more use out of the investment (Lawton, 2006).
The implementation of BI environments can be risky and many BI projects fail because of inadequate planning, missed tasks, missed deadlines, undelivered business requirements, or poor quality deliverables (Moss and Atre, 2003). Other risk factors relate to features of the BI application. First, the user interface must be intuitive and easy to use to support users who are managers without computer training. To meet this challenge, vendors are either developing better interfaces, or incorporate BI tools into applications with well-known interfaces, such as Web browsers and Microsoft Excel (Lawton, 2006).
In addition, the vast amounts of data in the DW may cause information overload whereby the excess data available to the user makes it difficult to cope, delaying the decision-making process and causing cognitive confusion (Beller, 2006). According to Edmunds and Morris, (2000) information overload may reduce the quality of business decisions and decrease the economic performance. Possible solutions for information overload in the BI context are better data visualization with charts that effectively represent the data, use of contrast and colors and avoiding unnecessary decorations, avoiding too much details and using the right measures to be presented (Kearse, 2009).
Without simple means to overcome information overload, the average employee cannot use BI to find useful data. This research suggests a way for reducing information overload by embedding recommendations into the front-end BI applications that guide users to the more valuable data that can be analyzed with the BI tool. The suggestion incorporates the concept of metadata discussed next.
2.1.5. Metadata in Business Intelligence Environments
Metadata is often described as “data about data” – an abstracted information about the structure, the contents, and the integration of data resources (Marco, 2000). Historically, metadata has been treated as a „second class citizen‟ in data management literature, as its business value was not as clear as other investments in data projects (Sen, 2004). As a result, metadata collection often gets cut from IS projects plan despite the acknowledgment that it is important (Kimball et al, 2002). However, with the expending use of metadata to cover many aspects of database management, it has been recognized as having important managerial implications (Shankaranarayanan and Even, 2004). Today, metadata management in BI platforms is well recognized as an important capability needed for successful implementation of BI environments (Gartner, 2009). It has been suggested that metadata can be used to support a better use of complex BI tools (Moss and Atre, 2003) – a notion that this study extends.
The metadata architecture in an analytical environment is complex; however, critical for uniformity and cohesion between the different components in a BI environment (Singh, 1998; Elmasri and Navathe, 2006). The unique needs of a DW and BI, stemming from the large volume and complexity of data resources that are managed in such environments, require managing different forms of metadata such as definitions of the source database, documentation of the
transformation rules that convert source data into DW formats, descriptions of back-end and front-end tools for managing the warehouse, definitions of the DW schema, data mart locations and contents, and data quality measurements (Shankaranarayanan and Even, 2004).
While the importance of metadata from a technical perspective has long been recognized, only recently studies have started examining metadata from the business perspective, trying to understand the potential benefits of exposing certain aspects of metadata to the business user. Notably, despite evidence that support the argument for potential benefits, the integration of metadata into front-end tools is still very rare in commercial BI. Hess and Wells (2002), emphasize the importance of metadata in the BI context by presenting two case-studies of the use of a BI infrastructure in large companies. In both organizations, end-users were given metadata about the data they analyze. The results show that metadata integration improved the sense of reliability when end-users used the BI tools for making business decisions. Notably, the study showed that analysts appreciated metadata integration, despite the low quality of the metadata maintained.
Chengular-Smith et al. (1999) combined metadata on the reliability of data in tools aiding the decision making process. They found that the inclusion of data-quality information is more valuable in situations where the decision-maker needs to find the best alternative while it may be less valuable when the decision process calls for the comparison of averages of larger subgroups. They conclude that database designers should include data quality metadata, since it affects the decision making process. However the complexity of the decision task is likely to affect the needed data quality measures and ways of presentation. A follow-up study (Fisher et al.,2003) claimed that incorporating quality metadata into databases is costly; hence it is important to understand the characteristics of the users that may benefit from this kind of metadata. They found that experts use the metadata substantially more than novice users. Also, older experts pay more attention to the metadata than younger experts. Decision support tools were also examined in the context of process metadata integration (Shankaranarayanan et al., 2006). Process metadata tend to support and aid contextual quality assessment; it describes how a particular data set was created and delivered. Process metadata claimed to be an additional source of value that organizations can provide to their decision-makers to improve decision outcomes. Empirical validation suggest that integrating process metadata do affect the decision making process which affects decision outcomes.
This study examines the integration of another form of metadata - "Usage Metadata", which tracks the use of data and applications. Despite the recognition of usage metadata as an important metadata form (Shankaranarayanan and Even, 2004), it has rarely been researched and today it is supported only by a limited number of commercial metadata products. The unique approach developed in this study for the collection of usage metadata and the generic module that was implemented to support such collection are described in detail in a later section.
2.2.
Data Usage and the Associated Business Value
This study suggests that the benefits that firms can gain from data resource, particularly in the context of BI, can be significantly improved through better understanding of usage and the associated economic outcomes. A plethora of studies have examined the usage of IS, and of data resources in particular, from different angles. This section starts with reviewing relevant aspects of data usage and the concept of associating it with utility, as a measure for the value generated from data use. Later, it highlights the challenge of tracking the use of data and associating it with economic outcomes, reviews usage metadata as a possible way to capture IS usage, and discusses the strengths and the weaknesses of current solutions for data usage tracking.
2.2.1. Data Usage and Utility
In recent years, enormous amounts of data are generated by traditional sources, such as OLTP systems, as well as by new sources such as point-of-sale records, click stream data (Bucklin and Sismeiro, 2003), and radio frequency identification (RFID) (Wang and Liu, 2005). The increasing investments in data management raise the issue of benefit – what benefits and business value do organizations gain by possessing and managing large data resources? The question of value and return on investment has been raised in broader IS contexts, as spending on IT is rapidly increasing and, in recent years, often reaches 30-50% of the capital investment in firms (Carr, 2004). A plethora of studies have examined the question of IS value – how firms benefit from IS implementation, and how successfully investments in IS translate into revenues and/or promote them. The usage of IS has long been identified as an important factor in explaining IS success and the associated value gained (DeLone and McLean, 1992). Actual usage of IS strongly explains their success and payoff – even more than the level of ICT-investments made (Deveraj and Kohli, 2003). Burton-Jones and Straub (2006) review a few conceptualizations of IS usage in past research – e.g., based on the extent, the nature, and the
frequency of use. They state that usage event is a triplet comprising of user, system and task. The extent, to which the user employs the system to carry out the task, is the richest usage data that can be collected according to them. Although studies of IS usage emphasize it as a key for IS success, none of them suggest to capture the actual data usage being made through the use of the IS.
Ahituv (1980) suggests the concept of utility as a tool for assessing value creation through the use of information systems. Utility can be conceptualized, for example, as the difference in the outcome between a decision based on certain information and the one that could be taken without having the information available. Ahituv (1980) suggests linking information systems and resources to value and benefits by defining a multi-variable utility function, which maps information system's attributes and configuration decisions to a measurable outcome. Using the utility mapping, he suggests a structured way for evaluating alternative data model designs, and figure out the most cost-effective choice.
The question of usage, utility and value is particularly relevant in the field of data management – as the market for data management hardware, software, data resources, and consulting services is estimated in $100's of billions in the US alone (Wixom and Watson, 2001). As the volume and the complexity of data resources grow, it is critical to understand and evaluate economic factors such as the business value those resources generate, costs for managing them, and their overall contribution to the organizational economic performance (Even, 2007). The benefits that can be gained from large data resources are apparent in many business fields, but these benefits are often difficult to quantify and/or express in monetary terms. Unlike other physical resources, data resources are not subject to market forces and pricing mechanisms; hence, the need to assess the value of data in a more contextual – depending on the specific organizational setting and task domain (Watson et al. 2001). Moreover, data resources do not have “stand alone” value, but their value contribution materializes as they are being used - to enable business processes, support managerial decision making, and/or generate revenues as a commodity. These processes are dependant in a specific business, time and organizational context (Levitin and Redman, 1998; Even et al., 2007).
Ignoring the value of data might lead to incorrect data management decisions – refrain from investing in data with high potential business contribution, or over-investing in less-important data. Further, the costs associated with acquiring, storing, and maintaining data are high. Beyond storage and maintenance cost – too-large data resources may damage search,
retrieval, usage performance and overload the decision maker with unnecessary information (Levitin and Redman, 1998). Viewing data as an important resource, Ronen and Spiegler (1991) have argued that data management can rely on known methodologies (e.g. "Just-in-time") that enable the application of inventory management of other, more traditional, resources. The view of data as a resource is broadly adopted in the data quality management literature – studies in that field (e.g., Wang, 1998) promote adopting common quality management methodologies, such as the Total Quality Management (TQM), and applying them to data resources as well.
Adopting the utility concept, Even et al. (2007a) define "data utility" as a numeric measure that reflects the value gained by using data resources within a specific business/task context. They propose an analytical framework for optimizing data management design and maintenance decisions, through understanding the link between dataset characteristics and utility/cost tradeoffs. Certain dataset and system attributes, such as quality level, time span, choice of attributes and system configuration are seem by this framework as decision variables that may affect utility, costs, and the overall net-benefit in data environment. The optimization framework suggested by Even et al. (2007a) maps these decisions to economic outcomes and can help optimize their configuration. The utility associated with data records, as reflecting the business benefit gained, may have significant variability (Even et al., 2007b). Inequality in large databases can be analyzed, using common methods, used in other research fields, such as Lorentz's Curve, Gini's index and ANOVA tests. Even et al. (2007b) demonstrate "utility inequality" in an alumni database of a large university. The alumni database, storing data about potential donors, can be viewed as a special form of CRM (Customer Relationship Management) – a class of systems which manage data on costumers in commercial business. Inequality in this database has been found in a few aspects - the chance of getting a new donation from a person whose most recent gift was a long time ago appears to be very small, leading to the possible conclusion that older records are generally less significant than newer ones. The different schools in the university also show high inequality in the number of donations made by the school graduates, leading to the possible conclusion that the data that is saved on certain schools generates higher utility then other schools.
Inequality in the utility of data may have some important managerial implications (Even et al., 2007b). In the presence of high inequality – the organization may consider managing differently records with high utility contribution in terms of targeted quality level, inclusion/exclusion of attributes, time span coverage and data granularity. Another decision that
can benefit from adopting an economic perspective and assessing inequality is the how to treat older and/or unused data – sustaining, archiving, eliminating it entirely (Even et al., 2007a). Investment in a powerful DW infrastructure will be harder to justify if the vast majority of the utility can be obtained from a small fraction of the data resources, which can be effectively managed with a simple and inexpensive system. Utility inequality can impact data acquisition and retention policies as the value gained from purchasing and maintaining large data volumes is not necessarily obvious (Even et al., 2007b).
This research considers possible inequality in data resources, and links it to the tracking of usage. This inequality approach is equivalent, to a great extent, to the ABC analysis which is very common in managing the inventory of tangible resources (Ramanathan, 2006), ABC suggests that inhabitants of certain entities, like inventory, events and even people, conceal within them, a natural inequality. The approach suggests classifying entities into groups (A, B and C) and managing each group differently according to its characteristics. The main difference between the utility measurement approaches in former studies to the one presented in this study is that here the utility of data is measured not only by analyzing the data itself, but rather by observing the usage of data as the utility generator. In addition, while most of the research done so far on data utility was focused on data management, this research is focused on leveraging data utility for enhancing front-end BI tools.
2.2.2. Tracking Data Usage – Solutions and Issues
This study introduces a novel form of metadata for tracking the usage of data resources and associating it to business value. Academic literature does not offer comprehensive research on methods and architectures for collecting usage metadata in databases and only small number of commercial products offers solutions for monitoring data usage (Ambeo, 2009; Zetapoint, 2009). However, there is a greater recognition in recent years of the need to track usage patterns - Bollen and Van de Sompel (2006), for example claim that a user-driven revolution is underway in which end-user services are no longer solely based on top-down design decisions, but have come to prominently include the analysis of user actions and preferences.
A plethora of studies addressed usage tracking aspects in the Internet domain (e.g., Cooley et al., 1997; Shahabi et al., 1997; Nasraoui et al., 2000). Internet technologies permit the collection of "clickstream" data - tracking and recording web-usage behavior, which can be seen as a form of usage metadata (a listing of many web usage tracking utilities can be found at http://www.uu.se/Software/Analyzers/Access-analyzers.html). Clickstream data gives researchers
and practitioners the opportunity to study how users browse or navigate websites and to assess site performance in various ways. Analysis of clickstream data can help gaining important insights toward improving website design, customization, and ongoing monitoring of performance (Bucklin and Sismeiro, 2003). Joshi et al. (2002) describe an approach for creating a DW that is populated by web logs – tables which contain data on user sessions in a web site. Analyzing and exploring the data in such a DW and, by that, finding regularities in the behavior of the users accessing a web site can improve website performance, enhance the quality and delivery of Internet information services to the end user, and identify population of potential customers for electronic commerce. Clickstream data collects usage metadata mainly on the user-interface; however, it does not track the usage of the actual data in a repository, which is a key concept of this study.
A few studies have explored metadata solution for tracking the usage of data in the back-end databases management system itself, rather than in BI tools. Saharia and Babad (2000) propose an enhancement to the traditional data warehouse structure, by building an adaptive query cache in which the definitions of recently written queries as well as their answers and access paths are kept as part of the metadata. The objective is to add intelligence at the warehouse level so that the system remembers recent work it has performed, and by that speeds up the answers given to future queries. Saharia and Babad focus mainly on improving technical aspects of DW and BI performance, but do not address using this metadata in order to improve front-end tools that analyze the data such as BI applications.
Bollen and Van de Sompel (2006) suggest architecture for collecting usage data of scholarly information services (e.g. digital libraries). The data collected for each usage event can be described as a triplet containing answers to three main questions:
1. What is the item for which the usage was recorded, e.g. a journal article? 2. Who is the originator of the event, e.g. the user?
3. When is the time at which the event occurred, i.e. the event‟s timestamp?
The resulting collection of this initiative consisted of 3,507,484 unique usage events. From the recorded events, usage patterns were derived, and were used to build a number of tools and applications, related to the field of digital libraries:
1. Recommendation tools (e.g. if a user asked for a certain article, related articles were recommended to).
2. Usage impact ranking which ranks the journals according to the number of events in which they were asked by users.
3. Journal level-of-interest mapping that enables easy clustering of journals into topics according to similar usage patterns.
Bollen and Luce (2002) propose a quantitative approach to Digital Library (DL) evaluation that analyzes the retrieval habits of users, and helps to reduce managerial decisions that are based on the management intuition. On-line DL services generally maintain a log of user requests in a set of log files, similar to the web-logs that are often collected by web servers. These log files contain detailed information regarding user requests such as the originating IP number, date and time of the request, the requested document, etc. The DL logs are used to find relations between articles and to generate a cluster analysis and network graphs for visual inspection of the usage metadata. The researches described above track usage in large data resources in order to improve the search process of academic article, but do not link, and does not collect the data necessary for value estimation of the data in this repositories. Although recording of usage data is common in scholarly information services, its exploitation for the creation of value added services remains limited (Bollen and Van de Sompel, 2006). Bollen and Van de Sompel (2006) describe several issues in existing usage metadata solutions. They point mainly user privacy, data validity and the lack of accepted standards for the representation, sharing and aggregation of usage metadata as the major drawbacks that constraint the creation of value-added services, based on usage metadata. They point out future research to be directed towards an investigation of the scalability of different aggregation architectures of usage data, models to protect user privacy, mechanisms to ensure data validity and a range of technical issues associated mainly with referent identification.
Until recently, commercial products that manage metadata did not offer comprehensive solutions for usage tracking. For example, a 2003 survey of commercial product (Shankaranarayanan and Even, 2004), has shown very little evidence for usage metadata support in BI/DW products. Today, a few commercial solutions are suggested for usage tracking in large data resources. Among them are "STATSPACK" by Oracle (http://www.oracle.com), "Usage Tracker" by Amebo (http://www.ambeo.com), and "DB*CLASSIFY" by Zetapoint (http://www.zettapoint.com). For example, DB*CLASSIFY (Zetapoint, 2007) is used by practitioners to track and collect usage metadata and then classify the collected data into certain groups according to the frequency of usage events that accessed it, where frequently-used data is
considered to be more valuable then seldom-used data. The classification is performed by analysis of actual database activity. DB*CLASSIFY captures in real-time database queries, along with contextual information such as the time, username, application and all other session-related information. The Zetapoint's optimization and data classification methods, as well as the methods used in other commercial products, is driven mostly by technical aspects – reducing storage space, accelerating data processing (ETL), and query retrieval speed. This approach assumes that the data with the most value is the data that is used more often and vice versa, without correlating the content of the data to its business context. For example, according to Zetapoint's optimization schema – if a certain dataset is queried or updated often, it is automatically classified as important (Zetapoint 2007). Arguably, this approach might turn out to be a major drawback if the business value gained by using this specific data subset is low.
This study explores an important usage-tracking aspect, not addressed before - linking data usage to the associated business value. It contributes a new, generic, module for collecting value-driven usage-tracking metadata. This module does not only address technical aspects (as done, for example, in Zetapoint's solution), but also informs on value contribution of data. As shown in this study, the value-driven usage metadata captured can be used to recommend users to use certain valuable data items when analyzing the data for decision making.
2.3.
Recommender Systems
Recommender system is an automated mechanism, which provides end-users with some rating of information items not seen so far (Adomavicius and Tuzhilin, 2005). Recommender systems aim at improving usability and decision-making outcomes, enhancing the end-user‟s experience, and reducing information overload (Wei et al., 2005; Sun et al., 2008). Such systems are very common today in E-commerce and social-network websites. However, there is almost no evidence, neither in the academic nor in the practitioner literature, for implementation of recommender systems in BI environments. This study attempts to address this gap by proposing a new form for developing and integrating recommender systems in BI environments. This gap deserves further investigation, as BI environments manage vast amounts of data, have a strong impact on managerial decision making and business performance (Davenport, 2006), and are often subject to information overload issues (Beller, 2006).
Adomavicius and Tuzhilin (2005) identify two categories of methods for generating recommendations – "content-based" versus "collaborative-filtering". Methods under the former
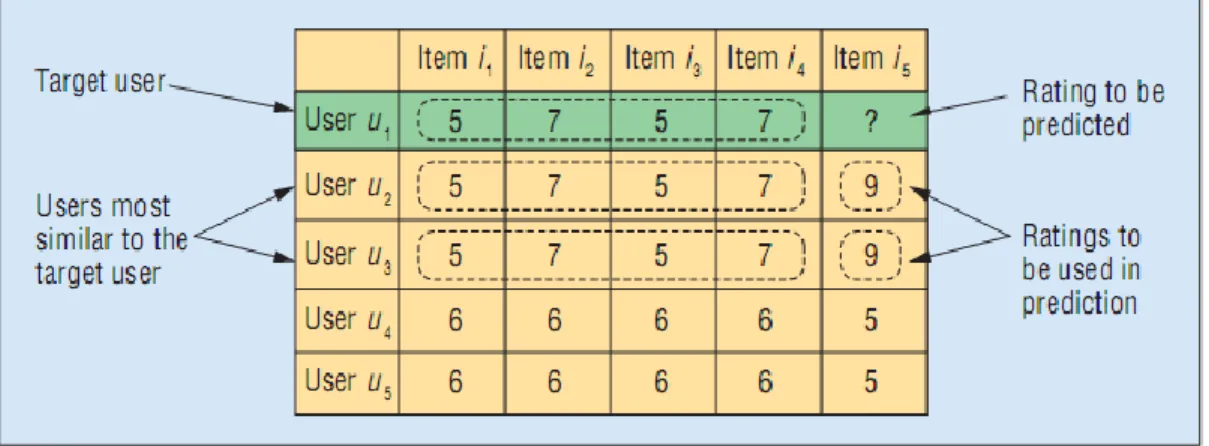
category recommend items that are similar to those preferred by the user in the past, while methods under the latter category recommend items that other users with similar preferences have liked. Collaborative filtering methods typically estimate the similarity of two users according to their past ratings. It estimates the rating of a user to un-seen item according to the ratings of similar users to the same item (Figure 9). The more similar the two users are - the higher is the weight that will be given to the known rating of one, when predicting the preferences of the other and assessing the rate, accordingly (Adomavicius and Kwon, 2008). To improve prediction accuracy, some collaborative filtering techniques also refer to the ratio between the number of users and the items to be fitted, the ratings scale and other properties of the underlying data set (Herlocker et al., 2004). Adomavicius and Tuzhilin (2005) describe a few recommender-systems methods, which can be seen as a hybrid between collaborative filtering and content based approaches. The recommendation form that is tested in the current study, described further later, can be seen as such a hybrid.
Figure 9: Collaborative filtering approach – users' similarity affects the rating prediction
A typical recommendation process starts with the specification of initial rating set, either provided explicitly by the user, or inferred by the system (Sun et al., 2008). Users offer feedback on purchased or consumed items and the recommender system uses the information to predict their preferences for yet unseen items and, subsequently, recommends items with the highest predicted relevance (Adomavicius and Kwon, 2008). Once the initial ratings are specified, a recommender system tries to estimate the rating function for the user. Importantly, most recommender systems techniques today are highly domain dependant and their performance relies significantly on the underlying data's characteristics; hence, the ability to generalize a
recommender system beyond the field in which it was tested is limited (Herlocker et al., 2004; Adomavicius and Kwon, 2008).
Recommender systems are a common practice today in commercial and social websites (McNee et al., 2003; Adomavicius and Kwon, 2008). A well-known recommender system is the one used by Amazon (www.amazon.com) which recommends users of books and other products they might be interested in (Figure 10). The system generates recommendations based on a collaborative-filtering approach, stating the products in which people with similar preferences to the user have expressed interest.
Figure 10: Amazon.com collaborative based recommender system
Another well-known application of recommender system is "Cinematch", used by Netflix (www.netflix.com) which recommends users movies that they may want to rent, based on common interests with other users. A content based music recommender system was developed by Pandora (www.pandora.com), which recommends songs to users, based on mapping the musical attributes of songs that the user has rated as high. Recommendations can be also found in social networks such as Facebook (www.facebook.com) and Linkedin (www.linkedin.com), which recommends people as potential friends and/or colleagues. Digital libraries are another important information-retrieval context in which recommender systems were studied (Song et al., 2006). Sun et al., (2008) have showed that analysis of user's logs can generate personalized recommendations for academic documents, based solely on the implicit feedback from the user.
2.3.1. Recommender Systems Evaluation
Defining the metrics on which the recommender systems should be measured is a complicated task, and the literature offers a variety of quantitative metrics and qualitative evaluation techniques (Herlocker et al., 2004). A common approach for recommender systems evaluation is to assess the accuracy of the recommendations, e.g., by measuring the MSE of the predicted ratings versus the actual user preference (Song et al., 2006). However, accurate recommendations alone do not guarantee positive user experience - additional aspects such as the extent to which a user is satisfied by the recommendations and the degree to which the recommendations made are not obvious must be examined as well (Cosley et al., 2003; Herlocker et al., 2004). Swearingen and Sinha (2001) carried out a study to investigate not only the accuracy of predictions but also the perceived usefulness, ease of use and usability of recommender systems. Such perceptive measurement would typically use a survey and interview methods. On the other hand, process factors such as the amount of time and effort required to complete a task would typically be measured implicitly by logging user behavior (Herlocker et al., 2004).
Recommender system evaluation can be done offline (e.g., by analyzing a dataset of certain user's ratings), or online with users who actually use the recommendations during the experiment (Sun et al., 2008). A major weakness of offline approach is that such analyses are limited to objective evaluation of prediction results, but cannot reasonably assess user preferences, satisfaction, and intention to use the recommendation. Offline analysis cannot determine, for example, whether users prefer a particular system because of its predictions capabilities, or because of other less objective criteria such as the aesthetics of the user interface. An alternative approach to offline analysis is to conduct a live-user experiment, such as controlled lab studies (e.g., with random assignment of subjects to different conditions), or field studies where a particular system is made available to a community of users (Herlocker et al., 2004). A lab study typically tests pre-defined hypotheses under controlled conditions, while a field study can reveal what users do in their own actual context (Herlocker et al., 2004). Lab experiments also differ from field studies by the time window of measurement - the former, usually implies a relatively short time period, while the latter permits a longer period in which dimensions such as long term dissatisfaction from the system can be evaluated (Turpin and Hersh, 2001).
This study includes a task-based lab experiment. In such experiments, subjects are assigned a set of clearly-defined tasks to complete, while various recommender algorithms or interfaces can be tested to find out which ones lead to the best task outcomes. For example, McDonald (2001) tests a system that was developed within a particular organizational task-based context. That study attempted to situate users in a task context that would lead them to evaluate the recommendations given within that context. Subjects were given a rich scenario for evaluating recommendations, which specified a general topic area and a specific problem. Task-based lab experiment was also conducted by Shankaranarayanan et al. (2006), who tested the integration of data-quality assessments and data-process maps into a decision support tool.
2.3.2. Accuracy and Trust Issues in Recommender Systems
A significant challenge in designing recommender systems is ensuring the accuracy of recommendations, and building up the trust of users in the recommendations made. Cosley et al. (2003) point out a possible bias in generating new recommendations, caused by exposure to previous ones. When presenting subjects with sets of movies they had rated in the past, that have found out that the predicted ratings did influence user ratings, causing a significant bias in the direction of the prediction. If such a bias indeed exists, user-interface design should let users concentrate on rating, while minimizing the focus on previous predictions. Cosley et al., also found that the control group which didn‟t get false recommendations expressed significantly more satisfaction than the experimental group who did get false recommendations. Experimental users sensed that predictions were inaccurate and that this inaccuracy led to an overall decrease in liking of the recommender system; hence the importance of choosing an accurate algorithm for generating recommendations.
Swearingen and Sinha (2001) suggest that in order to develop trust in a recommender system, the functionality of the underlying algorithm needs to be transparent to the user to an extent. Another possible way to facilitate trust would be to generate some recommendations on items that the user is likely to have known or rated before, as users might get confused if all recommendations are unrelated to unknown items. In order to increase user's trust in the system, McNee et al., (2003) suggest that recommendation system would be added with confidence metrics (e.g., based on the number of ratings available for an item) indicating how confident the system is in the recommendation given. They found that adding a confidence display to a recommender system increases the overall user satisfaction, although it decreases the trust of