Landscape evolution of a bedrock peneplain on the southern Tibetan Plateau revealed
by in situ-produced cosmogenic
10
Be and
21
Ne
M. Strobl
a,⁎
, R. Hetzel
a, S. Niedermann
b, L. Ding
c, L. Zhang
c aInstitut für Geologie und Paläontologie, Westfälische Wilhelms-Universität Münster, Corrensstr, 24, D-48149 Münster, Germany
bHelmholtz-Zentrum Potsdam, Deutsches GeoForschungsZentrum (GFZ), Telegrafenberg, D-14473 Potsdam, Germany c
Key Laboratory of Continental Collision and Plateau Uplift, Institute of Tibetan Plateau Research, Chinese Academy of Sciences, Beijing 100085, People's Republic of China
a b s t r a c t
a r t i c l e i n f o
Article history:
Received 25 November 2011
Received in revised form 22 February 2012 Accepted 26 February 2012
Available online 3 March 2012 Keywords: Tibet Peneplain Denudation rate Cosmogenic10 Be Cosmogenic21 Ne
Low-relief bedrock surfaces that occur at high altitude are a common feature of Cenozoic mountain belts and have often been used to infer a significant amount of rock uplift after their generation at low elevation. The timescale over which such surfaces can be preserved at high elevation and the rate at which they are
modi-fied by weathering and erosion are poorly known. Here we use cosmogenic10Be and21Ne to quantify the landscape evolution of a bedrock peneplain in southern Tibet that occurs at an altitude of ~5300 m. The pe-neplain is developed in Cretaceous granitoids and Jurassic metasediments of the northern Lhasa block (90°E, 31°N) and originally had a minimum extent of ~ 150 km east–west and ~ 75 km north–south. It has been dissected by small rivers that generated a few hundred meters of relief and formed additional bedrock sur-faces of limited extent at lower elevation. Local denudation rates for the peneplain and the lower bedrock surfaces–based on10Be concentrations in grus samples and amalgamated quartz clasts–cluster between 5 and 11 m Ma−1(mean = 8.1 m Ma−1) and are thought to be representative for the long-term rate of downwearing of these surfaces. Samples from bedrock outcrops and bedrock blocks yield more variable rates (3–20 m Ma−1), which partly overestimate the long-term lowering rate, presumably due to block tilt-ing and bedrock inhomogeneity. Spatially averaged10Be denudation rates for small river catchments range from 9 to 16 m Ma−1(mean = 11.8 m Ma−1) and are only slightly higher than the local denudation rates. Hence, the incision and widening of valleys proceeds at low rates, which demonstrates that the landscape of the peneplain region is remarkably stable. The combined21Ne and10Be data in a subset of the samples sug-gest that the bedrock surfaces have experienced a simple exposure history without periods of burial. Thus, our data do not provide any evidence for extended periods of shielding by ice during past glaciations, which is consistent with the absence of erratic boulders and moraines in the peneplain region.
© 2012 Elsevier B.V. All rights reserved.
1. Introduction
Low-relief surfaces eroded into bedrock have been documented in many mountain belts around the world, such as the Pyrenées (e.g.De Sitter, 1952), the Andes (e.g.Kennan et al., 1997; Hoke and Garzione, 2008), the Rocky Mountains (e.g. McMillan et al., 2006), the Gobi Altai (e.g.Jolivet et al., 2007), and the Himalaya (van der Beek et al., 2009). Typically, these bedrock surfaces occur at high alti-tudes of 2000 to 4000 m and are largely surrounded by areas with lower elevation that have steeper hillslopes. Hence, these low-relief surfaces are commonly interpreted as remnants of paleo-surfaces that had originally a much larger extent (e.g.De Sitter, 1952; Clark et al., 2005). Some workers have referred to these remnant surfaces as peneplains (e.g.Babault et al., 2005; Gunnell et al., 2009), a term that denotes a nearly featureless, gently undulating land surface of
considerable area, which has been produced by subaerial erosion almost to base level (Jackson, 1997).
To what extent the paleo-surfaces that are present in many moun-tain belts have been uplifted after their formation remains a matter of debate. For instance,De Sitter (1952)argued that low-relief surfaces in the Pyrenées were formed near sea level and have subsequently been raised to an altitude of ~2000 m. In support of this view, Gunnell et al. (2009)presented biochronologic and thermochronolo-gic data and suggested that the Eastern Pyrenées experienced a strong post-orogenic uplift by thermally driven thinning of the litho-spheric mantle after 12 Ma. On the other hand,field observations and experimental data have been used to suggest that the low-relief sur-faces in the Pyrenées were already formed at high elevation, owing to the deposition of thick alluvial fans at the mountain front and a con-comitant rise in base level (Babault et al., 2005, 2007). According to these authors, the erosive efficiency of the drainage network was re-duced and surface planation took place at high altitude—an interpre-tation which raises doubts on the inference of a young post-tectonic uplift.
⁎ Corresponding author.
E-mail address:[email protected](M. Strobl). 0169-555X/$–see front matter © 2012 Elsevier B.V. All rights reserved. doi:10.1016/j.geomorph.2012.02.024
Contents lists available atSciVerse ScienceDirect
Geomorphology
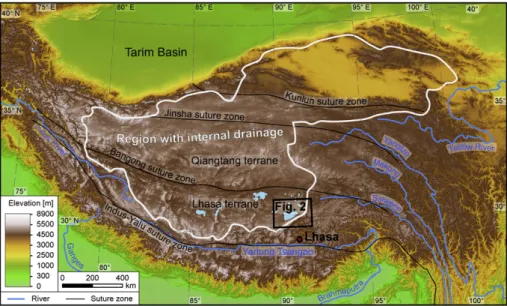
The Tibetan Plateau is the largest and highest plateau on Earth, with a mean elevation of ~5000 m and a relief of less than 1 km at a wavelength of ~ 100 km (Fielding et al., 1994). The plateau consists of continental terranes that were successively accreted to the Asian continental margin before the collision of India with Asia (e.g. Dewey et al., 1988; Yin and Harrison, 2000; Tapponnier et al., 2001) (Fig. 1). The remarkably low relief of the Tibetan Plateau has been explained by the development of an internal drainage system and the progressivefilling of intramontane basins by sediments eroded from the adjacent mountains (Métivier et al., 1998, Sobel et al., 2003; Liu-Zeng et al., 2008). Apart from the sediment-covered areas resulting from the process described above, older low-relief surfaces that are developed in bedrock have been documented in the south-eastern Tibetan Plateau (Clark et al., 2004) and in the Lhasa terrane of southern Tibet (Strobl et al., 2010). In southeastern Tibet, the for-mation and subsequent uplift of a regional low-relief landscape was inferred from a reconstruction of the large-scale drainage system through time (Clark et al., 2004). The onset of uplift and accelerated erosion was constrained with low-temperature thermochronology to 9–13 Ma (Clark et al., 2005) and may be related to a southeast-directed flow of the lower crust (e.g. Royden et al., 1997; Schoenbohm et al., 2006). As a response to the induced surface uplift, major rivers such as the Yangtze and Mekong have deeply incised this part of the plateau (Clark et al., 2005) and their headward incision continues to diminish the internally drained portion of the plateau (Fig. 1). In the Lhasa terrane, a well preserved bedrock peneplain oc-curs in the internally drained part of the plateau north of the lake Nam Co (Chinese:“Co”= lake) (Strobl et al., 2010) (Figs. 1and 2). Thermal modeling of low-temperature thermochronologic data indi-cates that this surface was formed just prior to the India–Asia colli-sion and was uplifted from a low elevation during an early stage of the continental collision (Hetzel et al., 2011). A small dataset of local and catchment-wide10Be denudation rates from the northwest-ern portion of the peneplain indicated that the peneplain is a rather stable geomorphic feature (Hetzel et al., 2011).
To date, most other studies that applied cosmogenic nuclides in the interior of the Tibetan Plateau have focused on exposure dating of moraines and erratic boulders (e.g.Schäfer et al., 2002; Owen et al., 2005; Chevalier et al., 2011and references therein). Apart from the study mentioned above, only two other studies have hitherto in-ferred denudation rates using cosmogenic nuclides. Thefirst 10 Be-based bedrock erosion rates were reported byLal et al. (2003)for
17 samples distributed across entire Tibet. Most of these samples yielded erosion rates of 3 to 30 m Ma−1, although high rates of up to 2000 m Ma−1were obtained from a few samples in the Kunlun mountains in northern Tibet. Although the study byLal et al. (2003) suggests that rates of bedrock erosion on the Tibetan Plateau are low, the limited geologic and geomorphic information provided on the studied sites precludes a detailed interpretation of their data. A second study in western Tibet (80°E, 35°N) focused on mafic volcanic cones that contain quartz xenocrysts (Kong et al., 2007). The erosion rates inferred from10Be and26Al concentrations in ten quartz sam-ples from these cones range from 4 to 24 m Ma−1and support the view that bedrock is generally eroding at low rates. Interestingly,
five of the investigated samples indicated a complex exposure history with significant periods of burial, which may result from a prolonged cover by ice or snow (Kong et al., 2007).
In this study, we present local and catchment-wide10Be denuda-tion rates for a total of 53 samples that are distributed over the entire bedrock peneplain region north of Nam Co (Fig. 2). In addition, we combine 21Ne and 10Be concentrations measured on a subset of these samples to evaluate whether the peneplain has experienced a simple exposure history with slow denudation only or a complex ex-posure history that included periods of burial. Together with a de-tailed description of the geomorphology and bedrock geology the cosmogenic nuclide dataset constrains the geomorphic evolution of the peneplain region.
2. Geological setting and characterization of the bedrock peneplain north of Nam Co
In the Nam Co region, the boundary between the internally and ex-ternally drained portions of the Tibetan Plateau extends along the crest of the Nyainqentanglha Shan (Chinese:“Shan”= mountain) and sepa-rates two regions with a markedly different topography signature (Fig. 2). The area southeast of the drainage divide, which comprises the headwater region of the Tsangpo River, the Yadong–Gulu rift, and the south-east facing slopes of the Nyainqentanglha Shan, has a rugged morphology with steep hillslopes and high local relief (Armijo et al., 1986; Strobl et al., 2010). The Nyainqentanglha Shan has been uplifted in the footwall of a low-angle normal fault that strikes ENE–WSW along the northern margin of the tectonically active Yadong–Gulu rift (Armijo et al., 1986; Pan and Kidd, 1992; Harrison et al., 1995). In con-trast, the region north of the Nyainqentanglha Shan belongs to the
Fig. 1.Digital elevation model (90 m SRTM data) of the Tibetan Plateau and surrounding regions. Major rivers are shown in blue and the main suture zones as black lines (after DeCelles et al., 2002; Ding et al., 2003). The white line delineates the area of internal drainage (modified fromLiu-Zeng et al., 2008).
internally drained part of the plateau and is characterized by a subdued morphology with low local relief, many lakes, and vast plains covered by alluvial sediment (Fig. 2). The climate in this region is cold and arid with a mean annual temperature of 0 °C and an annual precipitation of ~300 mm (Daut et al., 2010; Mügler et al., 2010).
The area north of Nam Co is dominated by remnants of a vast bed-rock peneplain, which extends for ~ 150 km east–west and ~75 km north–south (Strobl et al., 2010). The active N–S trending Bam Co gra-ben subdivides this region into a western and an eastern part (Fig. 2). The eastern part is bounded to the north by an active right-lateral strike–slip fault, which has formed a pull-apart basin occupied by lake Bong Co (Armijo et al., 1989). Apart from these structures, no ev-idence for active deformation has been observed. The well preserved remnants of the bedrock peneplain occur at altitudes between 5200 m and 5400 m with a mean of ~5300 m. The lack of tectonic ac-tivity suggests that the different peneplain remnants were originally part of a more extensive surface. Today, these different parts are sep-arated by small valleys with rivers that transport sediment to the broad, sediment-covered plains which mainly occur at an elevation of 4600–4700 m (Figs. 2and3a). Hillslopes are largely covered by a thin mantle of regolith with local exposures of bedrock. Field observa-tions and the analysis of digital elevation models in the northwestern part of the peneplain near the town of Bangoin (Fig. 3a) revealed that hillslope angles increase toward lower elevation, which indicates that the peneplain is the oldest landscape element and was later dissected by the streams. The progressive incision of these streams has generat-ed additional bgenerat-edrock surfaces of limitgenerat-ed extent below the main pe-neplain surface (Strobl et al., 2010).
The bedrock in the peneplain region consists of Cretaceous granit-oids with U–Pb zircon ages of 110–120 Ma (Xu et al., 1985; Harris et al., 1988; Hetzel et al., 2011) that intruded very low-grade metamor-phic Jurassic sediments (mainly siltstones and sandstones), and Lower Cretaceous sediments and volcanic rocks (Leeder et al., 1988) (Fig. 3b). The planar peneplain remnants occur predominantly in the granitoids and the resistant Jurassic metasediments (Figs. 3b and4a) and do not follow a specific stratigraphic boundary. Original-ly, the peneplain may have also been present in the Cretaceous sedi-ments, however, owing to the low strength of these sedimentary rocks it was not preserved there. An exception is an area located
northeast of Nam Co with predominantly Cretaceous volcanic rocks (Fig. 3b).
On theflat peneplain remnants and the smaller surfaces that were formed during progressive river incision, the bedrock is either ex-posed or covered by blockfields (Fig. 4b). The soil between the blocks appears to be thin and contains large amounts of granite grus. Flat bedrock outcrops are commonly dissected by polygonal fractures
filled with grus and soil (Fig. 4c). During progressive disintegration by freezing and thawing such bedrock exposures may be transformed to blockfields (e.g.Ives, 1958; Ballantyne, 1998), which typically con-sist of blocks with a size of a few decimeters up to about two meters (Fig. 4d). In the entire peneplain region we did not detect any erratic boulders, moraines, or glacially sculpted bedrock surfaces. Hence, Quaternary glaciations seem to have left no clear imprint on the geo-morphology, although it cannot be ruled out that cold-based ice had accumulated on theflat surfaces during glacial periods in the past. We will address this question when discussing the exposure history with two-nuclide plots based on cosmogenic10
Be and21Ne.
3. Sampling and analytical procedures
3.1. Sampling strategy
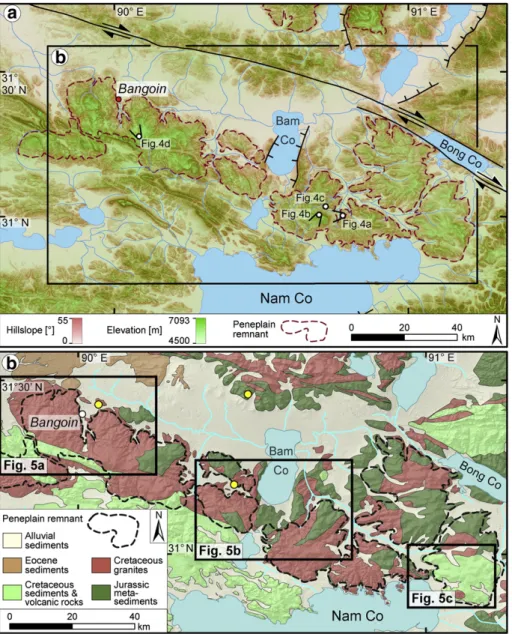
In order to test what kind of samples are best suited to quantify local denudation rates that are representative at the outcrop scale, we used four different sample types: samples from bedrock outcrops (n=10) and bedrock blocks (n=3), amalgamated quartz clasts (n=4), and grus samples (n=22) (Table 1). All these samples were taken either from the main peneplain or from flat surfaces at lower elevation (Fig. 4a, b). For the bedrock samples we chose sites where soil cover is minimal and mainly restricted to bedrock fractures (Fig. 4c) or is completely absent. Two samples (08T5 and -T6) were taken from meter-sized bedrock highs about 6 m apart that stick out of theflat sur-rounding bedrock. Sample 08T5 is from the horizontal top of a bedrock high that has several ~15 cm-deep weathering pits and is elevated 1.2 m above the adjacent bedrock. The second sample (08T6) is from a bedrock high with rounded edges that stands 0.4 m above the surround-ing ground and lacks weathersurround-ing pits. In regions where the bedrock is covered by blockfields, we sampled three large blocks with a diameter Fig. 2.Digital elevation model of the Nam Co region with lakes and active faults (fromArmijo et al., 1989). The high mountains of the Nyainqentanglha Shan (Chinese:“Shan”= mountain) separate the rugged morphology in the southeast from the smooth topography in the northwest. Most of the lakes are situated in the hanging wall of normal faults ex-cept Bong Co, which occupies a pull-apart basin. Theflat surface of the bedrock peneplain north of Nam Co is at an elevation of ~ 5300 m and appears in brownish colors. The white line delineates the boundary between the area of internal drainage and the catchment of the Tsangpo River.
of at least 1 m that appeared to rest in a stable position in the surrounding soil and blocks underneath. The 2 m-long block where we took sample 08T11 (Fig. 4d) had 1–3 cm-deep weathering pits that seemed to indicate that the block has remained in a stable position for a long period of time. In addition to the bedrock samples, we took samples consisting of amal-gamated quartz clasts or granite grus over areas with a size of 10 to 400 m2. For each quartz clast sample we collected at least a hundred clasts with a size of about 1 cm. The grus samples were sieved in the
field to obtain the 0.25–2 mm size fraction. In order to quantify spatially integrated denudation rates for entire river catchments, we took 14 sed-iment samples from creeks or from sandbars in small rivers draining the peneplain region (Table 2). The respective catchments ranged in size from 2 to 53 km2(Fig. 5).
3.2. Beryllium separation and analysis
The bedrock, clast, and grus samples werefirst crushed and then all samples were washed and sieved. Subsequently, the 250–500μm
grain size fraction was split into a magnetic and a non-magnetic frac-tion using a Frantz magnetic separator. This was followed by one etching step in 6 M HCl, several etching steps in diluted HF/HNO3 in a heated ultrasonic bath (Kohl and Nishiizumi, 1992), and two al-ternating etching steps in aqua regia and 8 M HF to obtain pure quartz. After addition of ~ 0.3 mg of Be-carrier, the quartz samples were dissolved, Be was separated by successive anion and cation ex-change columns, and precipitated at pH 8–9 as Be(OH)2. Following the transformation to BeO at 1000 °C and target preparation, 10Be was analyzed at the accelerator mass spectrometer (AMS) facility of ETH Zurich (Kubik and Christl, 2010). The blank-corrected10Be con-centrations reported inTables 1 and 2are normalized to the second-ary ETH standard S2007N, which has a nominal 10Be/9Be ratio of 28.1 × 10⁻¹²(Kubik and Christl, 2010) considering the10Be half-life of 1.387 Ma (Chmeleff et al., 2010; Korschinek et al., 2010). The sec-ondary standard is in use since April 2010 and has been calibrated to the primary standard ICN 01-5-1 (Nishiizumi et al., 2007; Kubik and Christl, 2010).
Fig. 3.(a) Map of the study area illustrating the spatial variations in elevation (green) and hillslope angle (red). The subhorizontal peneplain remnants appear in greenish color and are outlined with a purple dashed line. Note that slope angles in the valleys dissecting the peneplain increase towards lower elevation as shown by the increasing intensity of the red color towards lower elevation. Dark red to brownish colors indicate mountain ranges outside the peneplain area. The location and view direction of fourfield photographs shown inFig. 4is also indicated. (b) Geological map of the region north of Nam Co with a shaded relief image as background. The map has been simplified from Chinese geological maps with a scale of 1:200,000 and our ownfield observations. The best preserved parts of the peneplain are located in Cretaceous granitoids and Jurassic metasediments. The lo-cations of three samples analyzed for10
It is noteworthy that the ICP-OES analysis of the chemically cleaned quartz samples revealed that eleven of the 53 quartz samples had natural Be concentrations between 0.1 and 1 ppm; one sample (08T5) even had a Be content of 1.6 ppm. Given the mass of purified quartz that was dissolved per sample (~15 g), the natural 9Be amounts to a few percent of the Be that was added with the Be carrier solution (the largest value was 7.4% for sample 08T5). All samples with elevated Be contents were analyzed twice using ICP-OES and the natural Be concentrations were taken into account when calculat-ing the concentrations of in situ-produced cosmogenic10Be. 3.3. Neon analysis and data reduction
Apart from10Be, we also analyzed the neon isotopic composition of a subset of seven quartz samples in the noble gas laboratory of the Deutsches GeoForschungsZentrum (GFZ) in Potsdam (Table 3). Before the analysis, the purified quartz samples were ground to a grain size ofb100μm to diminish the proportion of noble gasses fromfluid inclusions. Samples of ~0.7 g each were wrapped in Al-foil and placed in a sample carousel under ultra-high vacuum, where they were baked at 100 °C for about one week to remove adsorbed atmospheric gasses. Extraction of noble gasses was achieved by step-wise heating at 400, 600, 800 and 1200 °C in an ultra-high vacuum fur-nace. After removal of active gasses in Ti sponge and ZrAl getters, the noble gasses were trapped in a cryogenic adsorber at 11 K and sequen-tially released for analysis in a VG5400 mass spectrometer. In addition, the isotopic composition of neon contained in fluid inclusions was checked by analyzing the gas released by crushing ~1.0 g samples of the 250–500μm quartz fraction in vacuo. Three of the crushed samples (08T2, -16, -27) were subsequently used for stepwise heating, while separate aliquots were taken otherwise. All data have been corrected for mass discrimination effects, isobaric interferences, and analytical blanks. Error limits correspond to the 95% confidence level; they include
statistical uncertainties of the measurement, uncertainties of sensitivity and mass discrimination determination, and blank and interference corrections. Further details about the analytical procedures and data reduction methods can be found inNiedermann et al. (1997) and Goethals et al. (2009a).
Cosmic-ray-produced Ne in quartz is characterized by a unique 22Ne/21Ne ratio and therefore mixtures of cosmogenic Ne and an-other Ne component must plot on the‘spallation line’in a three-isotope diagram (Niedermann et al., 1993). As the trapped Ne com-ponents released by the crushing procedure have21Ne/20Ne ratios that slightly exceed the one of air (21Ne/20Ne = 0.00296), the cos-mogenic21Ne concentration of each sample was determined from the excesses in the 400, 600, and 800 °C temperature steps relative to the crushing extraction values (cf.Hetzel et al., 2002) (Table 3). Above 800 °C, no more cosmogenic Ne is released from quartz (Niedermann, 2002). Small to moderate amounts of excess21Ne re-leased in the 1200 °C steps are interpreted to be nucleogenic21Ne, which is supported by the positions of 1200 °C data in the Ne three-isotope plots away from the‘spallation line’(Fig. A1 of the Supplementary information).
4. Results
4.1. Calculation of10Be denudation rates
Cosmogenic nuclides allow quantification of rates of denudation because the nuclide concentration of a steadily eroding surface de-pends on the rate of erosion (Lal, 1991). Although the term‘erosion’ is often used to describe the removal of mass from the Earth's surface, the cosmogenic nuclide concentrations also reflect the loss of mass owing to chemical weathering. In other words, concentrations of cosmogenic nuclides record the sum of physical erosion and chemical weathering, which is collectively referred to as denudation (Riebe et Fig. 4.Field images illustrating the topography of the bedrock peneplain. The locations and view directions of the pictures are shown inFig. 3a. (a) Westward view to a well pre-served remnant of theflat bedrock peneplain at an elevation of ~ 5400 m. The thin dashed line indicates the poorly preserved remnant of a lower bedrock surface, which has been largely eroded by continuing valley incision. (b) Detailed view over theflat surface of the peneplain remnant shown in (a). The surface is covered by a blockfield and underlain by Cretaceous granite. A grus sample (09T5) taken from the thin soil between the granitic blocks yielded a denudation rate of ~ 8.0 m Ma−1. View is to the SSW. (c) Flat bedrock
ex-posure with disintegration fractures at an elevation of ~ 5100 m. At this location we took a bedrock specimen (09T12) and a grus sample (09T13), which yielded similar denudation rates of ~ 5.6 and ~ 7.8 m Ma−1
. (d) Blockfield on the peneplain southeast of Bangoin at an elevation of ~ 5350 m. A bedrock sample (08T11) taken from the block with the hammer in front of Marcus Strobl gave a high apparent denudation rate of ~ 20.2 m Ma−1
, whereas a grus sample from this site (08T12) yielded a rate of only ~ 6.8 m Ma−1
, which is con-sidered as representative for the long-term denudation of the surface.
al., 2003; von Blanckenburg, 2006). The10Be denudation rates reported in this study (Tables 1and2) were obtained with the CRONUS-Earth online calculator (Balco et al., 2008), version 2.2 with version 2.2.1 of the constantsfile (http://hess.ess.washington.edu). For the various pa-rameters, e.g. the effective attenuation length of neutrons or the contri-bution of muons to cosmogenic nuclide production, we used the default values of the online calculator if not mentioned otherwise. For deter-mining catchment-wide denudation rates we took the mean elevation of the respective catchments to calculate the nuclide production rate and quantified the topographic shielding using the Matlab script of Greg Balco (http://depts.washington.edu/cosmolab/shielding.m) and
a digital elevation model with a resolution of 30 m (Table 2). The topo-graphic shielding of the samples that were used to determine local de-nudation rates was negligible. A potential shielding by snow or ice has not been taken into account.
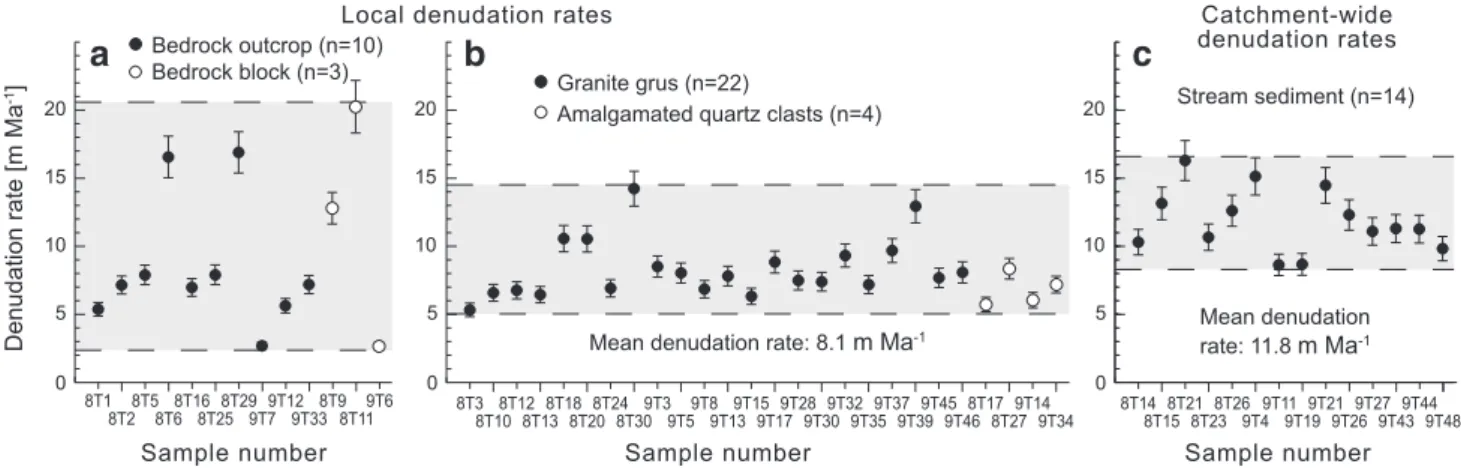
In order to allow a direct comparison of our data with those of pre-vious studies (Lal et al., 2003; Kong et al., 2007), we used the constant production rate scaling model ofLal (1991)—Stone (2000)in the on-line calculator. The local10Be denudation rates obtained from bed-rock exposures and bedbed-rock blocks vary from 2.7 to 20.2 m Ma−1, whereas the amalgamated clast and grus samples cluster between 5.3 and 14.2 m Ma−1(mean = 8.1 m Ma−1) (Fig. 6a, b). The stream Table 1
10Be concentrations, production rates, and local denudation rates derived from different sample types in the Nam Co region, southern Tibet.
Sample type and number
Latitude Longitude Elevation (m) Sample thickness (cm) 10Be conc.a (104at g−1)
Production rateb Denudation
ratec
(m Ma−1
)
Internal External Time scaled
(ka)
WGS 84 Spallation Muons 1σerror 1σerror
(°N) (°E) (at g −1 a−1 ) (at g−1 a−1 ) (m Ma−1 ) (m Ma−1 ) Bedrock outcrop 08T1 30.9398 91.0018 4911 4.0 814 ± 24 77.29 0.734 5.37 ±0.17 ± 0.52 112 08T2 30.9495 90.9603 5013 4.0 650 ± 20 80.96 0.752 7.15 ±0.23 ± 0.69 84 08T5 30.9491 90.9994 4784 3.0 539 ± 16 72.93 0.716 7.89 ±0.24 ± 0.75 76 08T6 30.9490 90.9995 4783 2.5 265 ± 10 72.89 0.719 16.55 ±0.63 ± 1.59 36 08T16 31.4548 89.9809 4916 3.5 651 ± 20 78.85 0.738 6.97 ±0.22 ± 0.68 86 08T25 31.4293 89.9033 5203 5.0 647 ± 19 89.55 0.783 7.90 ±0.25 ± 0.76 76 08T29 31.4758 89.8970 4823 5.0 263.7 ± 7.9 75.62 0.716 16.89 ±0.52 ± 1.58 36 09T7 31.1035 90.7748 4846 3.5 1502 ± 45 75.42 0.725 2.69 ±0.09 ± 0.28 223 09T12 31.0370 90.7095 5099 3.5 852 ± 26 84.37 0.770 5.63 ±0.24 ± 0.55 107 09T33 31.2580 90.3680 4838 5.0 625 ± 19 75.54 0.742 7.18 ±0.23 ± 0.70 78 Bedrock block 08T9 31.2690 90.0759 5306 4.5 424 ± 13 93.14 0.803 12.79 ±0.39 ± 1.21 47 08T11 31.2741 90.0842 5351 3.0 280 ± 11 94.99 0.819 20.23 ±0.82 ± 1.98 30 09T6 31.0001 90.7142 5395 3.0 1933 ± 58 95.91 0.827 2.65 ±0.09 ± 0.28 226
Amalgamated quartz clasts
08T17 31.4548 89.9809 4916 1.0 807 ± 24 78.85 0.754 5.67 ±0.18 ± 0.55 106 08T27 31.2848 90.1544 5070 1.0 600 ± 18 84.00 0.781 8.28 ±0.26 ± 0.79 72 09T14 31.0625 90.5625 4896 1.0 751 ± 23 77.05 0.752 6.04 ±0.19 ± 0.59 99 09T34 31.2592 90.3673 4817 1.0 669 ± 20 74.82 0.735 7.18 ±0.21 ± 0.64 91 Gruse 08T3 30.9398 91.0020 4910 – 848 ± 25 77.25 0.754 5.32 ±0.17 ± 0.52 113 08T10 31.2690 90.0759 5306 – 832 ± 25 93.14 0.829 6.58 ±0.21 ± 0.64 91 08T12 31.2741 90.0842 5351 – 827 ± 25 94.99 0.838 6.76 ±0.21 ± 0.66 89 08T13 31.2703 90.0852 5358 – 868 ± 26 95.26 0.840 6.44 ±0.20 ± 0.62 93 08T18 31.2487 89.7821 5260 – 519 ± 15 91.19 0.820 10.56 ±0.33 ± 1.01 57 08T20 31.2747 89.8416 5109 – 488 ± 15 85.42 0.792 10.54 ±0.33 ± 1.00 57 08T24 31.4293 89.9033 5203 – 765 ± 23 89.55 0.810 6.91 ±0.22 ± 0.67 87 08T30 31.4758 89.8970 4823 – 324.3 ± 9.7 75.62 0.740 14.23 ±0.44 ± 1.34 42 09T3 31.1004 90.6361 5095 – 592 ± 18 84.40 0.789 8.51 ±0.27 ± 0.81 71 09T5 31.0048 90.7032 5436 – 721 ± 22 97.62 0.854 8.04 ±0.25 ± 0.77 75 09T8 31.1035 90.7748 4845 – 652 ± 19 75.38 0.743 6.85 ±0.21 ± 0.67 87 09T13 31.0370 90.7095 5099 – 642 ± 19 84.37 0.789 7.81 ±0.24 ± 0.75 77 09T15 31.0625 90.5625 4896 – 720 ± 22 77.05 0.752 6.32 ±0.20 ± 0.61 95 09T17 31.1599 90.5018 4782 – 498 ± 15 73.36 0.732 8.84 ±0.28 ± 0.84 68 09T28 31.2614 90.1071 5434 – 776 ± 23 98.39 0.854 7.49 ±0.24 ± 0.73 80 09T30 31.2885 90.1044 5333 – 755 ± 23 94.30 0.835 7.39 ±0.23 ± 0.72 81 09T32 31.2580 90.3680 4838 – 488 ± 15 75.54 0.742 9.32 ±0.29 ± 0.89 64 09T35 31.1880 90.3573 4998 – 669 ± 20 81.05 0.771 7.18 ±0.23 ± 0.70 84 09T37 31.2425 90.3574 4658 – 433 ± 13 69.44 0.710 9.68 ±0.30 ± 0.92 62 09T39 31.3921 89.9053 5418 – 458 ± 18 98.17 0.852 12.94 ±0.52 ± 1.27 46 09T45 30.8719 91.1727 5047 – 635 ± 19 82.03 0.780 7.68 ±0.24 ± 0.74 78 09T46 30.9166 91.1859 5215 – 651 ± 27 88.50 0.811 8.08 ±0.35 ± 0.81 74 a Blank-corrected10
Be concentrations. Propagated analytical errors (1σ) include the error based on counting statistics and the error of the blank correction.10
Be concentrations were measured at ETH Zurich and are normalized to the secondary standard S2007N with a nominal10
Be/9
Be ratio of 28.1 × 10⁻¹²
(Kubik and Christl, 2010).
b
The reported10
Be production rates were calculated with the CRONUS-Earth10
Be–26
Al calculator, version 2.2 (Balco et al., 2008;http://hess.ess.washington.edu), using the time-invariant production rate scaling model of Lal (1991)–Stone (2000). The sea level and high latitude 10
Be production rate due to neutron spallation is 4.49 ± 0.39 at g−1yr−1(updated constantsfile version 2.2.1 of online calculator), with an additional contribution of 2.1% by negative muon capture and 1.9% by fast muons (Heisinger et al., 2002). An assumed rock density of 2.7 g cm−3and the sample thickness specified in the table is taken into account. Topographic shielding of all samples is negligible.
c
Denudation rates were calculated with the CRONUS-Earth10
Be–26
Al calculator, version 2.2 (Balco et al., 2008;http://hess.ess.washington.edu). Internal uncertainties include errors from the counting statistics and the blank correction, whereas external uncertainties also include the systematic uncertainty of the sea level high latitude production rate. Note that the 2.7% error associated with the10
Be/9
Be ratio of the standard S2007N is also included in the external uncertainty.
d
The time over which the denudation rate integrates is calculated by dividing the absorption depth scale of 60 cm by the denudation rate.
e
sediment samples yielded catchment-wide denudation rates ranging from 8.6 to 16.3 m Ma−1(mean = 11.8 m Ma−1) (Fig. 6c). The time-scale over which denudation rates integrate is equivalent to the time required to remove about 60 cm of bedrock (Granger et al., 1996; von Blanckenburg, 2006) and is thus inversely correlated to the denuda-tion rate. The integradenuda-tion times for our samples range from ~40 to ~ 230 ka (Tables 1and2).
4.2.10Be–21Ne erosion island plot
To evaluate whether the peneplain region was covered by ice for a significant period of time in the past, we combined the10Be and 21Ne concentrations that were obtained from seven samples and plotted them in an‘erosion island’plot (cf.Lal, 1991) of10Be versus 21Ne/10Be (Fig. 7). The plot was generated with the software Cos-moCalc (Vermeesch, 2007) and the values of the different parame-ters chosen in CosmoCalc are outlined in the caption ofFig. 7. Six out of seven data points are consistent with a simple exposure his-tory. Only one sample, which was taken from a bedrock block, lies above the saturation line in the complex exposure history field. The implications of these results will be discussed in more detail inSection 5.4.
5. Discussion
5.1. Comparison of denudation rates obtained from different sample types
In the Nam Co area of southern Tibet, local10Be denudation rates for a large-scale peneplain at ~5300 m altitude and smaller bedrock surfaces at lower elevation were obtained from four different kinds of samples. The denudation rates derived from granite grus and amal-gamated quartz clasts range from ~ 5 to ~ 14 m Ma−1and show much less scatter than those inferred from bedrock exposures and bedrock
blocks, which range from ~3 to ~20 m Ma−1(Fig. 6a, b). As both the grus and clast samples–which were taken over areas of 10 to 400 m2
–consist of many grains, their 10Be concentrations average a large number of individual denudation histories. Therefore, the denudation rates from these samples are interpreted to be more representative than those derived from bedrock blocks and bedrock exposures (cf. Hancock and Kirwan, 2007; Meyer et al., 2010).
Two bedrock blocks from a blockfield in the northwestern part of the peneplain (Fig. 4d) yielded high apparent denudation rates of ~12.8 and ~ 20.2 m Ma−1. We consider these denudation rates as un-reasonably high, because two grus samples from the same sites and three additional grus samples in this portion of the peneplain show consistent denudation rates of ~ 6.4 to ~ 7.5 m Ma−1(Fig. 5a). We at-tribute the high rates inferred from the bedrock blocks to be caused by frost heave and block tilting as a result of repeated freeze–thaw cy-cles (cf.Dahl, 1966; Ballantyne, 1998). We envision that the sampled block surfaces were partly shielded and thus experienced a time-integrated10Be production rate that is lower than the one for an ex-posed horizontal surface. This would have led to lower10Be concen-trations and thus to high apparent denudation rates. Although the third bedrock block yielded a low denudation rate of 2.7 m Ma−1 (Fig. 6a), we conclude that sampling bedrock blocks from blockfields carries the risk of significantly overestimating long-term denudation rates.
Most samples from bedrock exposures yielded denudation rates of 5 to 8 m Ma−1, i.e. similar to those inferred from grus and quartz clast samples (Fig. 6a, b). At nearly all sites where both grus or clast sam-ples and bedrock were analyzed, the resulting denudation rates are in good agreement (Fig. 5a–c). The two samples from adjacent bed-rock highs that stand 1.2 and 0.4 m above the surrounding ground (08T5 and -T6), respectively, gave denudation rates that differ by a factor of two. The larger bedrock high, which had distinct weathering pits on theflat upper surface, yielded a denudation rate of ~7.9 m Ma−1, whereas the sample from the lower surface without weathering pits Table 2
10Be concentrations, production rates, and catchment-wide denudation rates derived from stream sediment samples in the Nam Co region, southern Tibet.
Sample type and number
Latitude Longitude Elevation of sample (m) Mean catchment elevation Topographic shielding factor 10Be conc.a (104at g−1)
Production rateb Denudation ratec
(m Ma−1)
Internal External Time scaled
(ka)
WGS 84 (Spallation) (Muons) 1σerror 1σerror
(°N) (°E) (m) (at g −1 a−1 ) (at g−1 a−1 ) (m Ma−1 ) (m Ma−1 ) Stream sedimente 08T14 31.3293 90.1526 4714 5201 0.9974 518 ± 16 88.93 0.810 10.30 ± 0.32 ±0.98 58 08T15 31.3147 90.1759 4822 5171 0.9984 405 ± 12 87.80 0.804 13.14 ± 0.41 ±1.24 46 08T21 31.4854 89.9299 4783 5070 0.9963 315.6 ± 9.5 84.30 0.785 16.29 ± 0.50 ±1.53 37 08T23 31.4009 90.0009 4734 4921 0.9954 445 ± 13 78.52 0.758 10.66 ± 0.33 ±1.01 56 08T26 31.4475 89.8987 4893 5054 0.9973 402 ± 12 83.66 0.782 12.61 ± 0.39 ±1.19 48 09T4 31.1069 90.6435 4850 5018 0.9945 326.8 ± 9.8 81.11 0.775 15.13 ± 0.47 ±1.43 40 09T11 31.0392 90.7468 4801 4952 0.9969 546 ± 16 78.74 0.762 8.63 ± 0.27 ±0.82 70 09T19 31.1048 90.6493 4808 4984 0.9948 551 ± 17 79.89 0.768 8.67 ± 0.27 ±0.83 70 09T21 31.3534 89.8542 4783 5193 0.9981 372 ± 11 88.74 0.808 14.47 ± 0.45 ±1.37 41 09T26 31.3224 90.0513 4804 5202 0.9975 437 ± 13 88.96 0.810 12.30 ± 0.38 ±1.17 49 09T27 31.3450 90.0392 4776 5169 0.9970 476 ± 14 87.70 0.804 11.09 ± 0.34 ±1.05 54 09T43 31.0638 90.7427 4792 5055 0.9978 441 ± 13 82.62 0.781 11.30 ± 0.35 ±1.07 53 09T44 31.0626 90.7469 4781 5060 0.9979 444 ± 13 82.81 0.782 11.26 ± 0.35 ±1.07 53 09T48 30.8857 91.1809 4853 5055 0.9994 504 ± 15 82.31 0.781 9.82 ± 0.31 ±0.94 61 a Blank-corrected10
Be concentrations. Propagated analytical errors (1σ) include the error based on counting statistics and the error of the blank correction.10
Be concentrations were measured at ETH Zurich and are normalized to the secondary standard S2007N with a nominal10Be/9Be ratio of 28.1 × 10⁻¹²(Kubik and Christl, 2010).
b The reported10Be production rates were calculated with the CRONUS-Earth10Be–26Al calculator, version 2.2 (Balco et al., 2008;http://hess.ess.washington.edu), using the
time-invariant production rate scaling model of Lal (1991)–Stone (2000). The sea level and high latitude10Be production rate due to neutron spallation is 4.49 ±
0.39 at g−1
yr−1
(updated constantsfile version 2.2.1 of online calculator), with an additional contribution of 2.1% by negative muon capture and 1.9% by fast muons (Heisinger et al., 2002). The rock density was considered with 2.7 g cm−3
. For the topographic shielding correction, we calculated a shielding factor for each catchment by using 30 m Aster Digital Elevation Models and the Matlab script of Greg Balco (http://depts.washington.edu/cosmolab/shielding.m).
c
Denudation rates were calculated with the CRONUS-Earth10
Be–26
Al calculator, version 2.2 (Balco et al., 2008;http://hess.ess.washington.edu). Internal uncertainties include errors from the counting statistics and the blank correction, whereas external uncertainties also include the systematic uncertainty of the sea level high latitude production rate. Note that the 2.7% error associated with the10Be/9Be ratio of the standard S2007N is also included in the external uncertainty. For the calculation of catchment-wide denudation
rates we used the mean elevation of the respective catchments.
d
The time over which the denudation rate integrates is calculated by dividing the absorption depth scale of 60 cm by the denudation rate.
e
yielded a rate of ~16.6 m Ma−1. This shows that–at least at the outcrop scale–the variable development of weathering features reflects local differences in denudation rate. A bedrock and a grus sample (08T29 and -T30) from northwest of Bangoin yielded consistent but relatively high denudation rates of ~16.9 and ~14.2 m Ma−1, respectively (Fig. 5a). The two latter samples are from a region that has a more irreg-ular morphology and lacks well-developed flat surfaces. The rates obtained from these two samples suggest that this area, which is located below the peneplain, is indeed experiencing a more rapid denudation than most other parts of the study area—probably because the granitic bedrock here is less resistant to weathering and physical erosion. Finally
we note that the three granitoid samples analyzed byLal et al. (2003) yielded10Be denudation rates that range from ~3.3 to ~7.8 m Ma−1 and are thus similar to our results (the location of these three samples is shown inFig. 3b).
The spatially integrated denudation rates inferred from stream sed-iment samples for 14 catchments cluster between 8.6 and 16.3 m Ma−1 with a mean of 11.8 m Ma−1(Fig. 6c). These rates are thus slightly higher than the mean local denudation rate of ~8.1 m Ma−1derived from the grus and quartz clast samples. This is expected because the catchments include portions with somewhat larger hillslope angles (albeit not steeper than 25–30°,Strobl et al., 2010) that are denuding more rapidly than the sub-horizontal surfaces where we determined the local denudation rates. The rather small difference in the mean rates suggests that river incision and hillslope lowering proceed slowly and therefore the landscape of the peneplain region is remarkably sta-ble. Importantly, both local and catchment-wide denudation rates obtained in the three sub-regions (Fig. 5a–c) reveal no systematic spa-tial pattern, in particular no correlation with altitude.
5.2. Uncertainties of the10Be denudation rates
The derivation of local and catchment-wide denudation rates from cosmogenic nuclide concentrations is based on several assumptions that have been described and discussed in detail by others (e.g.Lal, 1991; Brown et al., 1995; Dunai, 2010). One of these assumptions is that denudation has been steady through time, so that cosmogenic nuclide concentrations have attained a secular equilibrium (Lal, 1991). During the Quaternary, however, the global climate has re-peatedly shifted from glacial to interglacial conditions and thesefl uc-tuations may have led to changes in the rate of denudation. On the Tibetan Plateau, cold and dry conditions during marine oxygen iso-tope stage 2 were followed by a warm and humid period with high lake levels in the early–mid Holocene (e.g. Wang et al., 2002; Mügler et al., 2010). A subsequent phase of increased aridity, which started 5–6 ka ago, is documented by falling lake levels (e.g.Lister et al., 1991; Lee et al., 2009; Mügler et al., 2010). These past changes in temperature and moisture conditions result from a variable strength of the monsoon system (e.g.Thompson et al., 1997; Liu et al. 1998; Herzschuh, 2006) and may have caused changes in the rate of denudation through time. The effect of such changes in denu-dation rate on the present-day concentration of cosmogenic nuclides has been investigated by numerical models that allow comparison of a synthetic input erosion history with the erosion rate that would be calculated from the nuclide concentration of a sample taken today (Bierman and Steig, 1996; Heimsath, 2006; von Blanckenburg, 2006). These models reveal that stepwise changes in the erosion rate between 5 and 10 m Ma−1over 100 ka climate cycles are almost completely damped out (e.g.von Blanckenburg, 2006), because for landscapes eroding that slowly the integration timescale of cosmo-genic nuclides is several tens of thousands of years (seeTables 1 and2). In other words, even if the rate of denudation in the peneplain region has varied by a factor of two during Quaternary climate changes, it is likely that the denudation rates determined in this study provide a representative long-term average that integrates over glacial–interglacial cycles.
Calculating denudation rates from in situ-produced cosmogenic nuclides in quartz implicitly assumes that the relatively insoluble mineral quartz is not enriched in the regolith by preferential dissolu-tion of other minerals such as feldspar (Small et al., 1999). If quartz in the regolith has been enriched relative to the bedrock, then the calcu-lated denudation rates are underestimated (Small et al., 1999; Riebe et al., 2001). By analyzing the immobile element zirconium in both bedrock and regolith in catchments with granitic lithologies,Riebe et al. (2001)showed that over a wide range of temperate climates, the bias introduced ranges from 1 to 12%. We argue that under the cold and arid climate prevailing in southern Tibet, the preferential Fig. 5.(a–c): All10
Be denudation rates obtained in this study plotted on three geological maps with shaded relief images as background. The stated errors represent the internal uncertainties (1σ) that are relevant to compare the results from different samples (exter-nal uncertainties are given inTables 1and2). Local denudation rates, which were derived from four different types of samples, are nearly always lower than spatially integrated denudation rates for nearby catchments, except for a few bedrock samples. Note that the local denudation rates are independent from the sample elevation. The positions of the three maps are indicated inFig. 3b.
enrichment of quartz by chemical weathering is unlikely to exceed a few percent. Hence, the underestimation of the denudation rates owing to the possible enrichment of quartz in the grus samples and the stream sediments is presumably of minor importance for the local and catchment-wide denudation rates reported in this study.
In quantifying the denudation rates we did not account for a po-tential shielding by snow, which would decrease the production rate of10Be. In this respect the reported denudation rates are there-fore maximum values, although the shielding effect is presumably small given the low annual precipitation of only ~300 mm in the study area (Li et al., 2008; Daut et al., 2010). For instance, even if the entire annual precipitation would fall as snow and remain at the surface for six months per year, the local10Be production rates and therefore the real denudation rates would only decrease by ~ 4.5%.
On the other hand, the production rates of cosmogenic nuclides during glacial periods were probably higher than during the Holocene on the Tibetan Plateau, because factors such as (1) atmospheric com-pression due to cooling and (2) changes in global atmospheric dy-namics owing to the presence of polar ice sheets led to changes
in air pressure (Staiger et al., 2007). As indicated by the application of a general circulation model, these changes are greatest at high elevations and on the Tibetan Plateau they have probably caused pro-duction rates during the Last Glacial Maximum to be ~ 6% higher than today (Staiger et al., 2007). The time-integrated effect on the produc-tion rates over ~50 to ~150 ka is likely to be much smaller but diffi -cult to quantify. As this climate effect has not been taken into account when applying the CRONUS-Earth online calculator, it will probably cause a slight underestimation of the inferred denudation rates.
Two other factors might introduce a bias in the inferred catchment-wide denudation rates: prolonged periods of sediment storage (e.g.Granger et al., 1996) and the occurrence of bedrock land-slides in the valleys upstream of the sediment samples (e.g.Niemi et al., 2005). Field observations provide no evidence for either of these two processes. In support of this conclusion, we note that (1) the relief of the relatively small catchments (2 to 53 km2) does not exceed a few hundred meters, (2) the valleys are small and have narrow valley bottoms that do not offer significant accommodation space for the Table 3
Results of Ne analyses of quartz separates from samples from the Nam Co region, southern Tibet.
Sample Temp. (°C) 20Ne (10−12cm3STP g−1) 22Ne/20Ne 21Ne/20Ne 21Ne exa (106at g−1) Bedrock outcrop 08T1 400 40.3 ± 3.2 0.1535 ± 0.0024 0.0484 ± 0.0010 49.1 ± 3.8 600 72.4 ± 5.7 0.1225 ± 0.0016 0.00892 ± 0.00025 11.4 ± 1.0 800 61.0 ± 4.9 0.1181 ± 0.0025 0.00434 ± 0.00018 2.08 ± 0.34 1200 13.1 ± 1.3 0.464 ± 0.017 0.01322 ± 0.00077 3.57 ± 0.35 Total 186.8 ± 8.3 0.1517 ± 0.0030 0.01624 ± 0.00072 55.8b ± 7.8 Crusher 300 ± 15 0.10183 ± 0.00078 0.003063 ± 0.000059 – 08T2 400 38.0 ± 2.2 0.1254 ± 0.0026 0.02690 ± 0.00062 24.4 ± 1.5 600 110.7 ± 7.1 0.1054 ± 0.0013 0.00722 ± 0.00014 12.52 ± 0.91 800 331 ± 21 0.10114 ± 0.00033 0.003166 ± 0.000042 1.33 ± 0.54 1200 92.7 ± 6.0 0.1026 ± 0.0011 0.00343 ± 0.00011 1.01 ± 0.30 Total 572 ± 23 0.10381 ± 0.00042 0.00557 ± 0.00014 38.3 ± 1.8 Crusher 683 ± 49 0.10136 ± 0.00034 0.003016 ± 0.000043 – 08T16 400 22.2 ± 1.5 0.1550 ± 0.0033 0.0411 ± 0.0012 22.6 ± 1.5 600 38.2 ± 2.3 0.1114 ± 0.0011 0.01320 ± 0.00039 10.38 ± 0.74 800 34.0 ± 2.2 0.1018 ± 0.0015 0.00382 ± 0.00017 0.66 ± 0.24 1200 7.53 ± 0.68 0.1024 ± 0.0026 0.0185 ± 0.0016 3.13 ± 0.33 Total 101.9 ± 3.6 0.1170 ± 0.0012 0.01654 ± 0.00056 33.6 ± 1.7 Crusher 41.6 ± 3.0 0.10318 ± 0.00089 0.00308 ± 0.00020 – 08T25 400 33.6 ± 2.7 0.1385 ± 0.0029 0.03474 ± 0.00086 28.5 ± 2.3 600 14.5 ± 1.3 0.1084 ± 0.0047 0.00779 ± 0.00068 1.85 ± 0.30 800 8.1 ± 1.1 0.1035 ± 0.0063 0.00326 ± 0.00038 0.048 + 0.086/−0.048 1200 3.69 ± 0.70 0.1018 ± 0.0071 0.0161 ± 0.0029 1.29 ± 0.23 Total 59.9 ± 3.3 0.1242 ± 0.0024 0.02281 ± 0.00091 30.4 ± 2.3 Crusher 37.2 ± 2.0 0.1029 ± 0.0016 0.00302 ± 0.00012 – Bedrock block 08T9 400 72.9 ± 5.7 0.11328 ± 0.00094 0.01529 ± 0.00035 23.9 ± 2.0 600 81.2 ± 6.3 0.1035 ± 0.0012 0.00485 ± 0.00018 3.81 ± 0.52 800 71.4 ± 5.7 0.1029 ± 0.0018 0.00356 ± 0.00019 0.88 ± 0.41 1200 2.43 ± 0.66 0.115 ± 0.010 0.0371 ± 0.0092 2.21 ± 0.33 Total 228 ± 10 0.10656 ± 0.00080 0.00813 ± 0.00030 28.6 ± 2.1 Crusher 157.5 ± 8.1 0.10171 ± 0.00077 0.003097 ± 0.000098 –
Amalgamated quartz clasts
08T17 400 52.4 ± 2.8 0.11256 ± 0.00089 0.01286 ± 0.00033 13.88 ± 0.87 600 165.8 ± 8.6 0.1089 ± 0.0012 0.00785 ± 0.00015 21.6 ± 1.4 800 185.5 ± 9.8 0.10284 ± 0.00081 0.003204 ± 0.000050 1.02 ± 0.61 1200 8.92 ± 0.70 0.1078 ± 0.0029 0.00308 ± 0.00067 0.02 + 0.16/−0.02 Total 413 ± 13 0.10662 ± 0.00063 0.00629 ± 0.00012 36.5 ± 1.8 Crusher 178 ± 13 0.10196 ± 0.00049 0.00300 ± 0.00011 – 08T27 400 31.5 ± 2.0 0.1280 ± 0.0015 0.02640 ± 0.00056 19.7 ± 1.2 600 106.9 ± 6.3 0.1035 ± 0.0015 0.00491 ± 0.00015 5.28 ± 0.60 800 115.7 ± 6.9 0.10159 ± 0.00097 0.00316 ± 0.00013 0.30 + 0.51/−0.30 1200 14.1 ± 1.0 0.1052 ± 0.0027 0.00364 ± 0.00019 0.214 ± 0.081 Total 268.2 ± 9.6 0.10564 ± 0.00079 0.00661 ± 0.00021 25.3 ± 1.4 Crusher 129.0 ± 9.3 0.10208 ± 0.00093 0.003064 ± 0.000099 –
Error limits are 2σ.
a
Excess21
Ne relative to the trapped Ne composition as determined by crushing extractions (see last line for each sample). Totals show estimated concentrations of cosmogenic
21
Ne, calculated based on the excesses in the 400–800 °C steps (see text).
b For sample 08T1 only (50 ± 50)% of the21Ne excesses in the 600 °C and 800 °C steps was added to the 400 °C excess to obtain total cosmogenic Ne, as the three-isotope
storage of sediments, and (3) the hillslope angles adjacent to the small rivers are smaller than 25–30°.
As stated inSection 4, we applied the constant production rate scaling model ofLal (1991)–Stone (2000)for quantifying the denuda-tion rates with the CRONUS-Earth online calculator. It is important to note that the time-dependent scaling models, which attempt to ac-count for secular variations of the geomagneticfield, lead to higher production rates and thus to higher denudation rates. At the high al-titude of around 5000 m on the Tibetan Plateau these differences are considerably more pronounced than at lower elevation. For the time-dependent adaptation of theLal (1991)–Stone (2000)scaling model (cf.Balco et al., 2008) the difference is ~15%, whereas the scaling schemes ofDunai (2001),Desilets and Zreda (2003),Lifton et al. (2005)and Desilets et al. (2006)lead to denudation rates that are about 30 to 40% higher than those reported herein. The exact differences depend on, among other factors, the integration time and the sample elevation, be-cause the altitude-dependence of nuclide production slightly differs in the various scaling models. In summary, the discussion above reveals that the most significant uncertainty associated with the10Be denuda-tion rates of this study is the uncertainty introduced by the scaling
model that is used to calculate the local nuclide production rates. This important point has also been highlighted byOwen et al. (2008)and Chevalier et al. (2011)and emphasizes the urgent need for a production rate calibration site at high elevation of ~5 km—ideally such a site should be located on the Tibetan Plateau.
5.3. Implications for sediment generation and deposition in the peneplain region
Although the local and catchment-wide denudation rates in the peneplain region are low, a significant volume of sediment must have been generated during progressive valley incision and lowering of the peneplain over millions of years. As the peneplain region belongs to the internally drained part of the plateau (Fig. 1), the sed-iment produced cannot leave the interior of the plateau. The occur-rence of Miocene lacustrine strata suggests that numerous lakes in south and central Tibet existed already between 13 and 23 Ma (Wu et al., 2008). Hence, the internal drainage system has likely persisted since the Miocene. As the volume of sediments that are present in the small valleys of the peneplain region is insignificant, most of the sed-iment that has been produced in the past millions of years was either deposited on the broadfloodplains or transported to lakes such as Bam Co and Bong Co, which are situated in actively subsiding basins bounded by normal or strike–slip faults (Fig. 2). Owing to its sheer size Nam Co may also contain significant volumes of sediment, although it remains unknown whether the inferred normal fault along its south-eastern margin is active and the lake bottom experiences tectonic sub-sidence (Strobl et al., 2010).
5.4. Evaluating past burial of the peneplain by glaciers or cold-based ice Moraines and U-shaped valleys on both sides of the Nyainqen-tanglha Shan (Fig. 2) indicate that during the last glacial cycle glaciers descended down to ~ 4800 m on the northern slope of the mountain range and to about 4300–4500 m on its southern margin (Lehmkuhl et al., 2002; Klinge and Lehmkuhl, 2004). In the southern part of the Nyainqentanglha Shan, boulders from a sequence of three moraines yielded10Be exposure ages of ~34 ka, ~ 25 ka, and ~ 12 ka (Chevalier et al., 2011; the exposure ages were calculated with the scaling scheme ofLifton et al., 2005). Five boulders from an even older mo-raine in the eastern part of the mountain range have minimum10Be ages between ~ 50 ka and ~ 110 ka and indicate a slightly larger ice ex-tent during the penultimate glaciation (Owen et al., 2005). For the moraines on the northwestern side of the Nyainqentanglha Shan no exposure ages are available, however, geomorphologic observations
a
b
c
Fig. 6.Comparison of denudation rates derived from different sample types. Error bars denote external 1σerrors. The errors of points without visible error bars are smaller than the dot. (a) Bedrock outcrop and bedrock block samples show a large scatter of denudation rates and may overestimate the long-term rate. (b) Denudation rates derived from granite grus and quartz clasts are more evenly distributed and are considered to be more representative. (c) Small differences between catchment-wide denudation rates and those obtained from grus and quartz clasts suggest a slow process that has been active for millions of years.
Fig. 7.Erosion island plot for the subset of seven samples in which both10Be and21Ne
were analyzed. The plot was generated with CosmoCalc, version 1.7 (Vermeesch, 2007), using the time-invariant scaling scheme ofStone (2000)and the following pa-rameters: a total production rate of 4.66 at g−1
a−1 for10 Be and 20.1 at g−1 a−1 for 21
Ne, a contribution of 2.1% from slow muons and 1.9% from fast muons to10
Be produc-tion and of 3.6% from fast muons to21
Ne production (cf.Goethals et al., 2009band ref-erences therein), a10
Be decay constant of 5.00 × 10⁻⁷
a−1
(corresponding to a half-life of 1.387 Ma), the preset production rate mechanisms of CosmoCalc with three expo-nentials, and the default values for the attenuation lengths. Error bars represent 2σ uncertainties.
and a few minimum luminescence ages on aeolian silt, which locally rests on top of the glacial deposits, indicate that two moraine ridges formed during the last glaciation, whereas an older moraine is related to the penultimate glaciation (Lehmkuhl et al., 2002; Klinge and Lehmkuhl, 2004).
The available information summarized above suggests that a for-mer advance of glaciers from the Nyainqentanglha Shan to the pene-plain is very unlikely and this is corroborated by the absence of erratic boulders and moraines in the area north of Nam Co. This inference, however, does not preclude the accumulation of cold-based ice in the peneplain region. For instance,flat summit surfaces in Labrador, Canada, were buried under non-erosive ice during past glaciations as revealed by erosion island plots based on cosmogenic10Be and 26Al (Marquette et al., 2004). In our case, the combination of cosmo-genic10Be and21Ne concentrations does not provide any evidence for significant periods of burial, because six out of seven samples have a nuclide inventory that is consistent with a simple exposure history (Fig. 7). Note that four of these six samples are bedrock sam-ples, whereas two samples (08T17 and -27) consist of amalgamated quartz clasts. Sample 08T17 was taken at the same site as bedrock sample 08T16 and the nuclide inventory of both samples suggests a simple exposure history (Fig. 7). The only sample that plots into the complex exposure historyfield (08T9) and may indicate a phase of burial was taken from a bedrock block. As discussed inSection 5.1, however, this bedrock block yields an unreasonably high10Be denu-dation rate of ~ 12.8 m Ma−1—presumably because it has been tilted by frost heave. Thus, we consider the apparently complex exposure history indicated by this sample as geologically meaningless. In sum-mary, the combined analysis of21Ne and10Be in a subset of our sam-ples indicates that at least during the past hundred thousand years no cold-based ice was present in the peneplain region north of Nam Co. This is not surprising, because the ~ 7000 m-high Nyainqentanglha Shan constitutes an efficient topographic barrier that has presumably blocked the monsoonal precipitation from the peneplain region dur-ing past glaciations (Owen et al., 2005). At a larger spatial scale, our data are also inconsistent with the postulated presence of a Late Pleis-tocene ice sheet on the Tibetan Plateau as envisaged byKuhle (1998). The existence of such an ice sheet is also negated by exposure ages of up to ~170 ka, which were obtained from moraines in central Tibet (Schäfer et al., 2002).
6. Conclusions
The analysis of cosmogenic10Be in four different kinds of samples from a large-scale bedrock peneplain in southern Tibet indicates that grus and amalgamated quartz clasts are best-suited to infer geologi-cally meaningful denudation rates at the outcrop scale. The mean denudation rate obtained from this sample type is ~8 m Ma−1, whereas catchment-wide denudation rates for small watersheds de-rived from stream sediment are only slightly higher and range from 9 to 16 m Ma−1(mean ~ 12 m Ma−1). The small difference between the local and spatially integrated rates demonstrates that the relief production proceeds at low rates. Hence, the geomorphology of the peneplain region has been barely modified during the last few mil-lions of years. In addition, the combined use of cosmogenic10Be and 21Ne in a small sub-suite of samples indicates that the peneplain re-gion experienced a simple exposure history without periods of burial underneath cold-based ice.
The denudation rates reported in this study are afflicted with several uncertainties that may result from the following processes: (1) temporal changes in the rate of denudation as a result of Qua-ternary climatefluctuations, (2) a potential enrichment of quartz in the regolith relative to the bedrock, (3) a lowering of the nuclide production rate owing to snow shielding, and (4) temporally increased production rates during glacial periods as a result of atmospheric com-pression and changes in atmospheric dynamics. The cumulative
uncertainty of the10Be-based denudation rates related to these pro-cesses is likely smaller than 10%, because the different uncertainties partially cancel out. At the high altitude of the Tibetan Plateau the most significant uncertainty affecting10Be denudation rates is the un-certainty introduced by the choice of the scaling model, which is needed to calculate local nuclide production rates. As a consequence, a reliable calibration of the10Be production rate at the high elevation of the Tibet-an Plateau would be highly desirable.
Supplementary materials related to this article can be found on-line atdoi:10.1016/j.geomorph.2012.02.024.
Acknowledgments
This study was funded by the German Research Foundation (DFG) within the framework of the Priority Programme No. 1372 (grants HE 1704/8-1 and HE 1704/8-2) and by the National Natural Science Foundation for Distinguished Young Scholars (grant 40625008 to Ding Lin), and supported by the Deutsches GeoForschungsZentrum (GFZ) Potsdam. We are grateful to Pieter Vermeesch (University College London) for discussions on two-nuclide plots and to Peter Kubik (ETH Zurich) for the AMS measurements. Andreas Struffert is thanked for his help in preparing the samples and Enzio Schnabel for performing the noble gas analyses. The constructive reviews of two anonymous re-viewers are greatly appreciated.
References
Armijo, R., Tapponnier, P., Mercier, J.L., Han, T.L., 1986. Quaternary extension in south-ern Tibet:field observations and tectonic implications. Journal of Geophysical Re-search 91, 13803–13872.
Armijo, R., Tapponnier, P., Tonglin, H., 1989. Late Cenozoic right-lateral strike–slip faulting in Southern Tibet. Journal of Geophysical Research 94, 2787–2838. Babault, J., Van Den Driessche, J., Bonnet, S., Castelltort, S., Crave, A., 2005. Origin of the
highly elevated Pyrenean peneplain. Tectonics 24, TC2010. doi:10.1029/ 2004TC001697.
Babault, J., Bonnet, S., Van Den Driessche, J., Crave, A., 2007. High elevation of low-relief surfaces in mountain belts: does it equate to post-orogenic surface uplift? Terra Nova 19, 272–277.
Balco, G., Stone, J.O., Lifton, N.A., Dunai, T.J., 2008. A complete and easily accessible means of calculating surface exposure ages or erosion rates from10
Be and26
Al measurements. Quaternary Geochronology 3, 174–195.
Ballantyne, C.K., 1998. Age and significance of mountain-top detritus. Permafrost and Periglacial Processes 9, 327–345.
Bierman, P.R., Steig, E.J., 1996. Estimating rates of denudation using cosmogenic isotope abundances in sediment. Earth Surface Processes and Landforms 21, 125–139. Brown, E.T., Stallard, R.F., Larsen, M.C., Raisbeck, G.M., Yiou, F., 1995. Denudation rates
determined from the accumulation of in situ-produced10
Be in the Luquillo Experi-mental Forest, Puerto Rico. Earth and Planetary Science Letters 129, 193–202. Chevalier, M.L., Hilley, G., Tapponnier, P., Van Der Woerd, J., Liu-Zeng, J., Finkel, R.C.,
Ryerson, F.J., Li, H., Liu, X., 2011. Constraints on the late Quaternary glaciations in Tibet from cosmogenic exposure ages of moraine surfaces. Quaternary Science Re-views 30, 528–554.
Chmeleff, J., von Blanckenburg, F., Kossert, K., Jakob, D., 2010. Determination of the10
Be half-life by multicollector ICP-MS and liquid scintillation counting. Nuclear Instru-ments and Methods in Physics Research Section B: Beam Interactions with Mate-rials and Atoms 268, 192–199.
Clark, M.K., Schoenbohm, L.M., Royden, L.H., Whipple, K.X., Burchfiel, B.C., Zhang, X., Tang, W., Wang, E., Chen, L., 2004. Surface uplift, tectonics, and erosion of eastern Tibet from large-scale drainage patterns. Tectonics 23, TC1006. doi:10.1029/ 2002TC001402.
Clark, M.K., House, M.A., Royden, L.H., Whipple, K.X., Burchfiel, B.C., Zhang, X., Tang, W., 2005. Late Cenozoic uplift of southeastern Tibet. Geology 33, 525–528. Dahl, R., 1966. Blockfields, weathering pits and tor-like forms in the Narvik Mountains,
Nordland, Norway. Geografiska Annaler 48A, 55–85.
Daut, G., Mäusbacher, R., Baade, J., Gleixner, G., Kroemer, E., Mügler, I., Wallner, J., Wang, J., Zhu, L., 2010. Late Quaternary hydrological changes inferred from lake levelfluctuations of Nam Co (Tibetan Plateau, China). Quaternary International 218, 86–93.
DeCelles, P.G., Robinson, D.M., Zandt, G., 2002. Implications of shortening in the Hima-layan fold–thrust belt for uplift of the Tibetan Plateau. Tectonics 21, TC1062. doi:10.1029/2001TC001322.
Desilets, D., Zreda, M., 2003. Spatial and temporal distribution of secondary cosmic-ray nucleon intensities and applications to in situ cosmogenic dating. Earth and Planetary Science Letters 206, 21–42.
Desilets, D., Zreda, M., Prabu, T., 2006. Extended scaling factors for in situ cosmogenic nuclides: new measurements at low latitude. Earth and Planetary Science Letters 246, 265–276.