on multi-objective interpolated continuous optimisation problems. To be presented at 16th International Parallel
problem solving from nature conference (PPSN 2020), 5-9 September 2020, Leiden, Netherlands. Lecture notes in
computer science (LNCS). Cham; Springer, (accepted).
Comparative run-time performance of
evolutionary algorithms on multi-objective
interpolated continuous optimisation problems.
ZĂVOIANU, A.-C., LACROIX, B. and MCCALL, J.
2020
This document was downloaded from
https://openair.rgu.ac.uk
The final authenticated version is available online at https://doi.org/NYA
.
This pre-copyedited version is made
available under the Springer terms of reuse for AAMs:
https://www.springer.com/gp/open-access/publication-policies/aam-terms-of-use
Evolutionary Algorithms on Multi-Objective
Interpolated Continuous Optimisation Problems
Alexandru-Ciprian Zăvoianu, Benjamin Lacroix, and John McCall School of Computing Science and Digital Media, Robert Gordon University,
Aberdeen, Scotland, UK
{c.zavoianu, b.m.e.lacroix, j.mccall}@rgu.ac.uk
Abstract. We propose a new class of multi-objective benchmark prob-lems on which we analyse the performance of four well established multi-objective evolutionary algorithms (MOEAs) – each implementing a dif-ferent search paradigm – by comparing run-time convergence behaviour over a set of 1200 problem instances. The new benchmarks are created by fusing previously proposed single-objective interpolated continuous opti-misation problems (ICOPs) via a common set of Pareto non-dominated seeds. They thus inherit the ICOP property of having tunable fitness landscape features. The benchmarks are of intrinsic interest as they de-rive from interpolation methods and so can approximate general problem instances. This property is revealed to be of particular importance as our extensive set of numerical experiments indicates that choices pertaining to (i) the weighting of the inverse distance interpolation function and (ii) the problem dimension can be used to construct problems that are challenging to all tested multi-objective search paradigms. This in turn means that the new multi-objective ICOPs problems (MO-ICOPs) can be used to construct well-balanced benchmark sets that discriminate well between the run-time convergence behaviour of different solvers.
Keywords: multi-objective continuous optimisation · evolutionary al-gorithms · performance analysis · large-scale benchmarking.
1 Introduction and Motivation
A multi-objective optimisation problem (MOOP) can be defined as:
minimizeF(x) = (f1(x), . . . , fm(x))T, (1)
where the search space is multi-dimensional (i.e., x∈ Vd ⊂Rd) and them ∈
{2,3} real-valued objectives ofF(x)need to be minimized simultaneously. The
conflicting nature of themobjectives means that the general solution of a MOOP
is given by a Pareto optimal set (PS) that aggregates all solution candidates
x∗ ∈Vd with the property that they are not fully dominated – i.e., @y ∈ Vd :
fi(y)≤fi(x∗),∀i∈ {1, . . . , m}andF(y)̸=F(x∗). The Pareto front (PF) is the
Because of their ability to discover high-quality PS approximations called Pareto non-dominated sets (PNs) in single runs, multi-objective evolutionary al-gorithms (MOEAs) have emerged as some of the most successful MOOP solvers [3]. As an increasing number of MOEA practitioners (e.g., mechatronic engi-neers [19], industrial designers [16], quality assurance analysts [28]) are tackling ever more challenging real-world problems, difficulties stemming from relying on
experimentation/simulation-driven F(x) values are being brought to the
fore-front. A costly evaluation of solution candidate quality (i.e., fitness) greatly
reduces the number of fitness evaluations (nfe) that can be computed during
an optimisation and runs might be stopped prematurely. Furthermore, running multiple optimisation runs often becomes infeasible and only a single solver (with literature recommended parameter settings) is applied despite the well-known implications of the No Free Lunch Theorems for Optimisation (NFL) [22, 4] re-garding the benefits of algorithm and/or parameter selection.
To alleviate the aforementioned difficulties of real-world MOEA application, researchers have explored several avenues. Among them, promising results have been delivered by both (i) the integration of surrogate modeling techniques [13, 17] that reduce solver dependency on costly fitness evaluations and (ii) the de-velopment of multi-method solvers that can deliver a robust performance over large (benchmark) problem sets with a fixed parameterisation [21, 23]. While surrogate techniques are often demonstrated on MOOP formulations bound to “closed” simulation or experimentation environments, most MOOP benchmark problems share biases like analytically engineered challenges and strong inter-problem correlations [2]. The present work aims to aid both research streams by introducing a new class of MOOPs with tunable fitness landscapes that:
(i) are intrinsically interesting for benchmark construction as they propose chal-lenges to several state-of-the-art MOEAs, when instantiated randomly; (ii) can be used to effortlessly generate easy-to-share, lightweight
interpolation-based surrogate formulations, when instantiating with real-world data.
2 Multi-Objective Interpolated Continuous Optimisation
Problems
2.1 Interpolated Continuous Optimisation Problems
First proposed in a single-objective context [12], ICOPs are defined by the fol-lowing elements:
1. A search spaceΩ: a set, whose elements we refer to ascandidate solutions,
that defines the optimisation problem domain. For continuous problems, this will be a (subset of) real space of chosen dimension. In this paper, we have
chosen our search spaces to be thed-dimensional cubes:Ω= [−5,5]d.
2. A distance function, e(x, y) :Ω×Ω→Rdefining the distance between
two solutions x and y. The pair (Ω, e) with these definitions is a metric
space. A natural choice of distance function for continuous search spaces is the Euclidean distance.
3. A set of seedsS⊂Ω: a (generally finite) set of distinct candidate solutions
with an assigned fitness. Elements ofSand their assigned fitness values will
define the entire optimisation problem via interpolation.
4. An interpolation function fS : Ω → R : in this paper, we apply the
inverse distance weighting method, originally defined by Shepard [18] for
use in spatial analysis. Assuming the seed setS containsN seeds, labelled
S={s1, ..., sN}, and with the assigned fitnessesU ={u1, ..., uN}, we define
for any solution candidatex∈Ω:
fS,U(x) = ∑N j=1 uj e(x,sj)k ∑N j=1 1 e(x,sj)k ife(x, sj)̸= 0for allj uj, ife(x, sj) = 0for some j (2)
wherekis a positive real number called thepower parameter. Higher values
ofkincrease the relative influence of nearby seeds on the interpolated value.
5. An optimisation objective: e.g., the minimisation offS.
2.2 Multi-Objective ICOPs
Multi-Objective ICOPs (MO-ICOPs) can be obtained by associating each
single-objectivefi(x), i∈ {1, . . . , m}from Equation 1 with a distinct ICOP. Given that
in a real-world optimisation scenario, we would expect each solution candidatex
to be evaluated across allmobjectives to be optimised, it would make sense that
the individual ICOPs share the same seeds (i.e., solution candidate samples), but
differ on the fitness values associated to each seed1. Hence, a MO-ICOP is defined
by the tuple(S, U1, . . . , Um)and the value ofkand Equation 1 can be rewritten:
minimizeF(S,U1,...,Um)(x) = (fS,U1(x), . . . , fS,Um(x))
T, (3)
One major caveat is that the PF of a MO-ICOP cannot be computed an-alytically and must be estimated in an iterative fashion by aggregating the best (Pareto non-dominated) solutions found during multiple optimisation runs. Sampling-based PF discovery was also required for real-world visualisable (i.e.,
x∈V2) distance-based MOOPs [9], but for this problem type, restrictions can
be imposed to generate artificial instances with prescribed PFs [8].
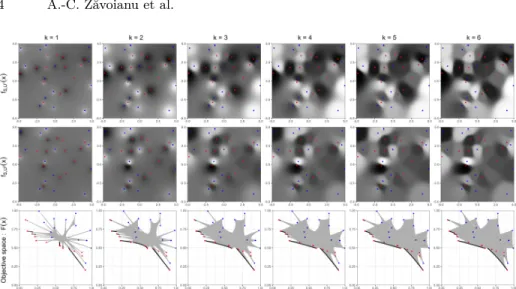
2.3 The k Parameter
The power parameterkdefines the influence of each seed on the interpolation of
the rest of the search space as illustrated in Figure 1.kincrease the importance
of distance weighting in the interpolation function. Lower values ofkcreate flat
fitness landscape around the average of the seed’s value with sharp peaks and
pitsaround the seeds. Higher values ofkcreate large basins of attraction around
each seed. This in turn influences the PF of resulting MO-ICOPs, as illustrated in the third row plots of Figure 1.
1 A similar strategy of composing MOOPs from single-objective problems was recently
Fig. 1. MO-ICOPs with two objectives ford= 2based on the same tuple(S, U1, U2) but differentkvalues. The first two rows show the impact ofkon the fitness landscape of each sub-contained ICOP. Non-dominated seeds are marked with red and dominated ones with blue; axes correspond to decision variablesx1andx2; lighter shades⇒lower values. The third row shows how this translates to different shapes of the MO-ICOP objective space (gray) and PF (black) when grid sampling106candidate solutions.
3 Experimental Setup
3.1 Test Problems
While the properties of MO-ICOPs seeded with real-world data do warrant rig-orous examination, in this preliminary study we focus on analysing the run-time convergence behaviour of established MOEA search paradigms with respect to the inherent characteristics of MO-ICOPs by considering a large set of 1200 two-objective random problem instances.
Randomly constructing a MO-ICOP is centred on embedding the seeds in
objective space. We defineSndas the set of Pareto non-dominated seeds andSd
as the set of dominated seeds such that S = Snd∪Sd. We start to randomly
sample fitness values for each seed in Snd ensuring that no seed in Snd fully
dominates another seed inSnd. We then randomly sample fitness values for each
seed in Sd, ensuring that every seed in Sd is fully dominated by at least one
seed inSnd. The idea behind this construction is to create randomly generated
problems that may provide some different PF shapes. Finally, the positions of the seeds in the search space are obtained by random uniform sampling.
For our benchmark set we generated 50 distinct objective-space seed set embeddings and corresponding search space positions for 4 different dimensions
d ∈ {5,10,20,30}. We obtained the final MO-ICOP instances by associating
each of the 200 resulting combinations with 6 values ofk∈ {1,2,3,4,5,6}. For
between 5 and 20 and the number of dominated seeds (|Sd|) was randomly chosen
between 1 and 80. For each problem, the PF was estimated using 20 million fitness evaluations spread across 400 independent optimisation runs. This data
can be accessed at:https://github.com/czavoianu/PPSN_2020.
3.2 Solvers and Parameterisation
The four MOEAs used in our tests were chosen because they exemplify different well-proven strategies for solving multi-objective optimisation problems.
NSGA-II [6] is one of the best-known and most widely applied multi-objective solvers. It has popularised alongside SPEA2 [25] a highly elitist multi-objective
evolutionary paradigm in which the population of iterationt+ 1is obtained by
applying a two-tier selection for survival (i.e., filtering) operator on the union
between the population of iterationtand all the offspring generated at iteration
t. The filtering relies on a primary Pareto non-dominated sorting criterion and a
secondary crowding criterion (for tie-breaking situations). The success of NSGA-II has also popularised two genetic operators for real-valued MOOPs: simulated binary crossover (SBX) and polynomial mutation (PM) [5].
The GDE3 [11] solver maintains the two-tier selection for survival operator introduced by NSGA-II, but aims to also exploit the very good performance of the differential evolution (DE) paradigm [20] on continuous optimisation
prob-lems by replacing the SBX and PM operators with aDE/rand/1/bin strategy.
MOEA/D-DE with Dynamic Resource Allocation [24] is a state-of-the-art solver that achieves highly competitive solutions for a wide-range of MOOPs. MOEA/D-DE refines the multi-objective search paradigm proposed in MOGLS [10] as it decomposes the original MOOP into several single-objective sub-problems that are the result of weighting-based aggregations of the original MOOP
objec-tives. During the run, individuals are evolved viaDE/rand/1/binto become the
solution to one or more of the sub-problems. Provided a proper choice of weight
vectors, the solver population should provide a very goodP S approximation.
The DECMO2++ [23] solver was designed for rapid convergence across a wide range of MOOPs as it integrates and actively pivots between three differ-ent search paradigms implemdiffer-ented via coevolved sub-populations. Specifically, while one sub-population implements Pareto-based elitism via the SPEA2 evo-lutionary model and the associated SBX and PM operators, the other actively co-evolved sub-population uses the DE-centred GDE3 search strategy. Decompo-sition is implemented via a largely passive archive based on a uniformly weighted Tschebyscheff distance measure that aims to maintain the best achieved
approx-imation of theP Sat each stage of the search process.
We used the standard / literature recommended parameterisation for all
four MOEAs and allowed a total computational budget ofnfe=50,000 for each
optimisation run. In the case of NSGA-II, GDE3 and DECMO2++ we used a population/archive size of 200. In the case of MOEA/D-DE DRA we used an archive size of 300 – the recommended setting for MOOPs with two objectives.
3.3 Performance Evaluation
The PN quality measure we track during the run-time is IndH - a normalised
version of the hypervolume [26] that evaluates a PN by relating the size of the objective space it dominates to that of the objective space dominated by the PF.
Hypervolume-ranked performance curves (HRPCs) have been proposed in [27] as a means to quickly estimate the comparative differences in the run-time convergence behaviour of several MOEAs across large benchmark sets. For each MOOP, the strategy is to rank the MOEAs that aim to solve it after every 1000
newly generated individuals (pre-defined comparison stages) using IndH values
averaged over 100 independent runs. Under a basic ranking schema, the solver
with the lowest averageIndH in a set ofnsMOEAs will receive the ranknsand
the best performer will receive the rank 1. A bonus rank of 0 can be given to
solvers that are estimated to have fully converged on the problem (i.e.,IndH>
0.99). By averaging for each MOEA at each comparison stage the ranks achieved on individual MOOPs, one can rapidly obtain an overview of the comparative convergence behaviour across the entire benchmark set.
HRPCs are constructed via two-by-two comparisons between the tested solvers
in increasing order ofIndH-indicated performance. As we also wish to illustrate
the magnitude of the differences in run-time convergence behaviours, we com-plement the basic ranking schema with:
– apessimistic ranking schemaunder which different ranks are awarded in the stage-wise two-by-two comparison only if the difference between the average
IndH values of the two MOEAs is higher than a th = 0.01, th = 0.05 or
th= 0.10predefined threshold2;
– a statistical ranking schema under which different ranks are awarded only
if the difference between the stage-wise averageIndH values is statistically
significant when using a one-sided Mann-Whitney-Wilcoxon test [14] with a considered significance level of 0.025 after a Bonferroni correction [7].
It is noteworthy that in [27] the ranking was based on the average IndH
assessment of the run-time MOEA populations at each comparison stage. In the present work, motivated by the interactive way in which engineers employ
MOEA-based searches in practice [19], theIndHaverages over independent runs
are computed by considering the set of all the Pareto non-dominated individuals that have been discovered by the MOEA till each comparison stage.
4 Results and Analysis
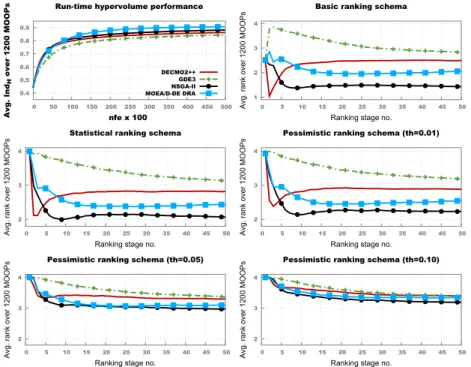
Before going into run-time performance analysis, it worth noting the performance
of the four algorithms atnfe=50,000. On the 1200 problems tested,
MOEA/D-2 If the difference between the
IndH-measured qualities of two PNs is larger than
th= 0.05, the interpretation is that the objective space dominated by the best PN is larger than its counterpart by a size that is equivalent to at least 5% of the size of the objective space dominated by the solution of the MOOP (i.e., the PF).
DE obtained the highestIndH 545 times, followed by NSGA-II with 509
end-of-the-run wins. GDE3 and DECMO++ obtained respectively 125 and 21 wins. In
the top left plot of Figure 2 we present the run-timeIndH-averaged performance
of the four tested MOEAs across the entire benchmark of 1200 MO-ICOPs.
Fornfe>10,000, the plot indicates that MOEA/D-DE DRA achieves the best
average performance, ahead of NSGA-II and DECMO2++. GDE3 constantly
achieved the lowest run-timeIndH average values.
0.4 0.5 0.6 0.7 0.8 0.9 0 50 100 150 200 250 300 350 400 450 500 Avg. Ind H over 1200 MOOPs nfe x 100
Run-time hypervolume performance
DECMO2++ GDE3 NSGA-II MOEA/D-DE DRA 1 2 3 4 0 5 10 15 20 25 30 35 40 45 50
Avg. rank over 1200 MOOPs
Ranking stage no.
Basic ranking schema
2 3 4
0 5 10 15 20 25 30 35 40 45 50
Avg. rank over 1200 MOOPs
Ranking stage no.
Statistical ranking schema
2 3 4
0 5 10 15 20 25 30 35 40 45 50
Avg. rank over 1200 MOOPs
Ranking stage no.
Pessimistic ranking schema (th=0.01)
2 3 4
0 5 10 15 20 25 30 35 40 45 50
Avg. rank over 1200 MOOPs
Ranking stage no.
Pessimistic ranking schema (th=0.05)
2 3 4
0 5 10 15 20 25 30 35 40 45 50
Avg. rank over 1200 MOOPs
Ranking stage no.
Pessimistic ranking schema (th=0.10)
Fig. 2. Results across the entire benchmark of 1200 MO-ICOPs: d ∈ {5,10,20,30}
andk∈ {1,2,3,4,5,6}. A bonus rank of 0 is awarded for full convergence – i.e., when
IndH>0.99.
In the early phases of the optimisation runs (i.e.,nfe<7,000), both NSGA-II
and DECMO2++ achieve slightly better average IndH values than MOEA/D.
This is confirmed by the HRPC plots from Figure 2 as they indicate a slight advantage in early convergence for NSGA-II and DECMO2++ even when
con-sidering a pessimistic ranking with a threshold th = 0.05. Surprisingly, the
general picture of the five rank-based comparisons indicates that NSGA-II edges MOEA/D-DE DRA as the best performer throughout the run-time. Since this is
to focus the analysis on NSGA-II and MOEA/D-DE and thus remove the impact of convergence behaviour cliques on the relative rankings.
Furthermore, by not awarding a bonus rank of 0 for full convergence (i.e.,
when IndH > 0.99), the restricted NSGA-II vs. MOEA/D-DE analysis
high-lights more clearly at each ranking stage the difference between the number of problems on which one solver performs better than the other. Thus, since only ranks of 2 and 1 can be awarded, achieving an average value of 2 at a certain ranking stage is a clear indication that a solver is not better than its counter-part (given the considered ranking criterion) across any MOOPs in the chosen benchmark set. Conversely, HRPC values very close to 1 indicate a clear better performance. More formally, in a one-on-one comparison with no bonuses, a rank value of 1.x associated with a solver, indicates that the solver outperforms its
counterpart on(1−0.x)×100% of the problems considered in the benchmark.
In light of strong empirical evidence (please see Figure 1) that the power
parameter used in the interpolation functionkfrom Equation 2 has a significant
impact on the geometry of the resulting MO-ICOP problem, it is natural to analyse if and how this translates into divergent MOEA run-time behaviours.
Therefore, in Figure 3, we present present the comparative convergence be-haviour of NSGA-II and MOEA/D-DE when only considering a benchmark sub-set containing the 600 MO-ICOPs with the lowest weights of the inverse distance
interpolation function: i.e.,k∈ {1,2,3}. The average IndH values from the top
left plot indicate that MOEA/D-DE generally outperforms NSGA-II in all stages of the optimisation runs. Furthermore, this subset of benchmark MO-ICOPs is
more challenging as, for both solvers, the achieved averageIndH values are lower
than those reported in Figure 2 over all 1200 problems.
0.4 0.5 0.6 0.7 0.8 0.9 1 0 50 100 150 200 250 300 350 400 450 500 Avg. Ind H over 600 MOOPs nfe x 100
Run-time hypervolume performance
NSGA-II MOEA/D-DE DRA 1 1.2 1.4 1.6 1.8 2 0 5 10 15 20 25 30 35 40 45 50
Avg. rank over 600 MOOPs
Ranking stage no. Statistical ranking schema
1 1.2 1.4 1.6 1.8 2 0 5 10 15 20 25 30 35 40 45 50
Avg. rank over 600 MOOPs
Ranking stage no. Pessimistic ranking schema (th=0.01)
1 1.2 1.4 1.6 1.8 2 0 5 10 15 20 25 30 35 40 45 50
Avg. rank over 600 MOOPs
Ranking stage no. Pessimistic ranking schema (th=0.05)
Fig. 3. Results across the benchmark subset with 600 MO-ICOPs with d ∈
The different convergence behaviours of the two solvers for lowk values is confirmed by all three corresponding HRPC plots. These also highlight that,
fornfe>15,000, theIndH-measured performance of MOEA/D-DE solutions is
better across≈40% of the problems in this benchmark subset when considering
a IndH thresholdth= 0.05. 0.4 0.5 0.6 0.7 0.8 0.9 1 0 50 100 150 200 250 300 350 400 450 500 Avg. Ind H over 600 MOOPs nfe x 100
Run-time hypervolume performance
NSGA-II MOEA/D-DE DRA 1 1.2 1.4 1.6 1.8 2 0 5 10 15 20 25 30 35 40 45 50
Avg. rank over 600 MOOPs
Ranking stage no. Statistical ranking schema
1 1.2 1.4 1.6 1.8 2 0 5 10 15 20 25 30 35 40 45 50
Avg. rank over 600 MOOPs
Ranking stage no. Pessimistic ranking schema (th=0.01)
1 1.2 1.4 1.6 1.8 2 0 5 10 15 20 25 30 35 40 45 50
Avg. rank over 600 MOOPs
Ranking stage no. Pessimistic ranking schema (th=0.05)
Fig. 4. Results across the benchmark subset with 600 MO-ICOPs with dim ∈
{5,10,20,30}andk∈ {4,5,6}. No bonus rank of is awarded for full convergence.
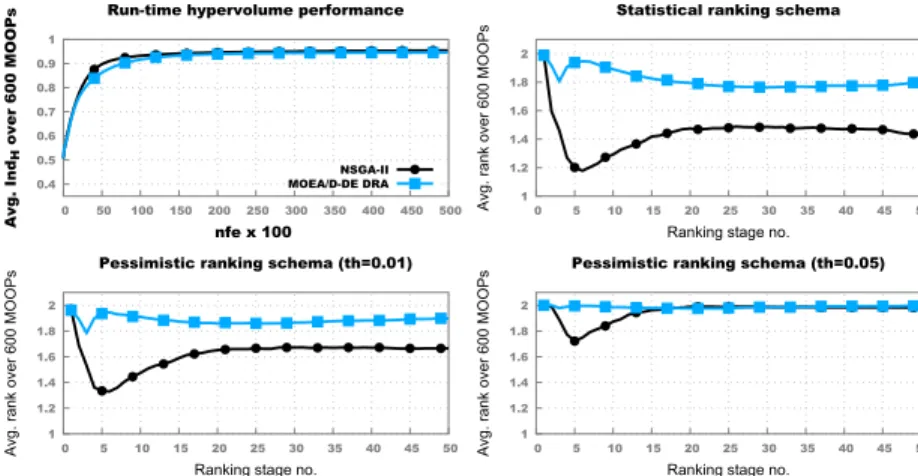
The plots in Figure 4 indicate that for a higher weight of the inverse distance
interpolation function (i.e., k ∈ {4,5,6}), the IndH-measured performance of
NSGA-II solutions is:
– consistently better across≈50% of the MO-ICOPs in this benchmark subset
when considering the one-sided Mann-Whitney-Wilcoxon statistical signifi-cance test;
– consistently better across ≈ 30% of the MO-ICOPs, when considering a
IndH threshold of 0.01.
– only better by large margins (i.e.,th = 0.05) across ≈10-25% of the
MO-ICOPs in the early stages of the optimisation runs: 5000<nfe<10,000.
It is also noteworthy that on the MO-ICOPs associated with higher values
of k, both multi-objective solvers perform well and are able to reach average
benchmark-wideIndH values higher than 0.9 after 10,000 fitness evaluations.
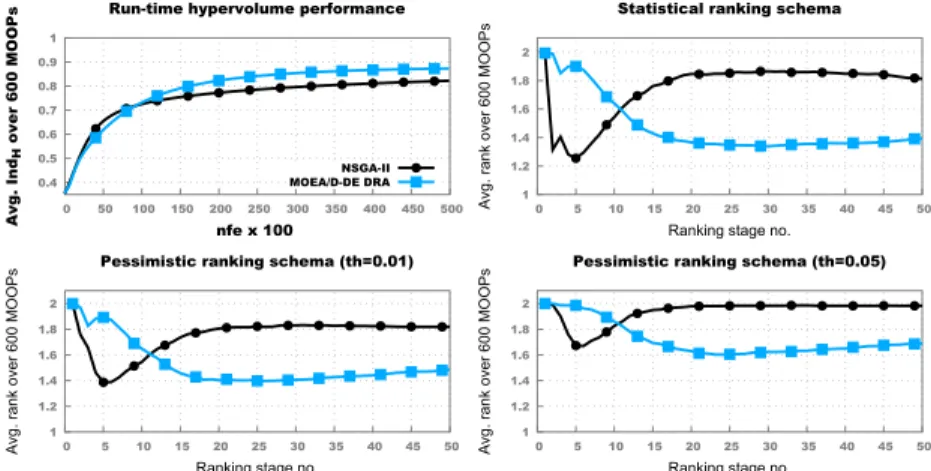
The plots in Figure 5 illustrate the run-time convergence behaviour of
NSGA-II and MOEA/D-DE on problems with a lower dimension: d ∈ {5,10}. The
HRPCs show that while solver performance is similar early on, fornfe>5,000,
when comparing based on statistical significance, NSGA-II performs better across
≈50-60% of the 600 MO-ICOPs and MOEA/D-DE perform better across≈
0.4 0.5 0.6 0.7 0.8 0.9 1 0 50 100 150 200 250 300 350 400 450 500 Avg. Ind H over 600 MOOPs nfe x 100
Run-time hypervolume performance
NSGA-II MOEA/D-DE DRA 1 1.2 1.4 1.6 1.8 2 0 5 10 15 20 25 30 35 40 45 50
Avg. rank over 600 MOOPs
Ranking stage no. Statistical ranking schema
1 1.2 1.4 1.6 1.8 2 0 5 10 15 20 25 30 35 40 45 50
Avg. rank over 600 MOOPs
Ranking stage no. Pessimistic ranking schema (th=0.01)
1 1.2 1.4 1.6 1.8 2 0 5 10 15 20 25 30 35 40 45 50
Avg. rank over 600 MOOPs
Ranking stage no. Pessimistic ranking schema (th=0.05)
Fig. 5.Results across the benchmark subset with 600 MO-ICOPs withd∈ {5,10}and
k∈ {1,2,3,4,5,6}. No bonus rank is awarded for full convergence.
thenfeincreases are also observed when imposing a smallIndH ranking
thresh-old ofth= 0.01. However, when looking at the larger thresholds of 0.05, NSGA-II
doesn’t outperform on any problem in the benchmark while MOEA/D-DE still
perform better across≈10-20% of the problems throughout the entire run-time.
The fact that NSGA-II performs better on more problems but with a lower
mar-gins (i.e., th < 0.05) while MOEA/D performs better on fewer problems but
with higher margins (i.e., th ≥0.05) helps to explain the average
benchmark-wideIndHplot (top-left) associated with this benchmark subset. As a side note,
when considering Figures 4 and 5, the HRPCs provide valuable insight that helps to differentiate convergence behaviours captured by largely similar
benchmark-wideIndH averaging plots.
The plots in Figure 6 show that on the benchmark subset of 600 MO-ICOPs
with a higher dimension – i.e., d ∈ {20,30} – MOEA/D-DE consistently
out-performs NSGA-II fornfe >15,000 across≈60% of the problems (based on a
statistical significance and pessimisticth = 0.01 criteria) and≈ 30-40% of the
problems (when considering the stricter th = 0.05 criterion). It is noteworthy
that in the early part of the runs (nfe < 15,000), NSGA-II performs notably
better than MOEA/D-DE across all the considered comparison criteria. Finally, in order to better understand the interplay between the inverse dis-tance weighting parameter and the MO-ICOP problem dimension on one side
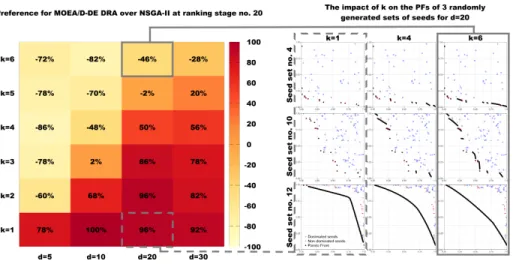
and the comparative solver performance on the other, we can compute a (k, d)
preference matrix at a fixed point of interest during the run-time. For example, the top-left plot of Figure 2 indicates that all solvers are past their knee-point
in convergence at nfe = 20,000 (i.e., ranking stage no. 20). When considering
the statistical significance ranking criterion, we can compute the preference for
0.4 0.5 0.6 0.7 0.8 0.9 1 0 50 100 150 200 250 300 350 400 450 500 Avg. Ind H over 600 MOOPs nfe x 100
Run-time hypervolume performance
NSGA-II MOEA/D-DE DRA 1 1.2 1.4 1.6 1.8 2 0 5 10 15 20 25 30 35 40 45 50
Avg. rank over 600 MOOPs
Ranking stage no. Statistical ranking schema
1 1.2 1.4 1.6 1.8 2 0 5 10 15 20 25 30 35 40 45 50
Avg. rank over 600 MOOPs
Ranking stage no. Pessimistic ranking schema (th=0.01)
1 1.2 1.4 1.6 1.8 2 0 5 10 15 20 25 30 35 40 45 50
Avg. rank over 600 MOOPs
Ranking stage no. Pessimistic ranking schema (th=0.05)
Fig. 6. Results across the benchmark subset with 600 MO-ICOPs with d ∈ {20,30}
andk∈ {1,2,3,4,5,6}. No bonus rank is awarded for full convergence.
percentage of problems on which NSGA-II outperforms (at ranking stage no. 20) from the percentage of problems on which MOEA/D-DE performs better.
The resulting (k, d) preference matrix shown in Figure 7 indicates that while
MOEA/D-DE obtains better results than NSGA-II on problems with low k pa-rameters and larger dimensions, NSGA-II performs better on problems with
large k values and lower dimensions. Low k values (in particulark= 1) result in
very discontinuous point-wise PFs (as illustrated in Figures 1 and 7) that highly
favour the directional decomposition search strategy of MOEA/D-DE. Higherk
values generate more continuous PFs that are generally easier to converge on for both solvers, but on which the decomposition strategy is at a slight disadvantage (please see Figure 4) as its more rigid exploration mechanism likely generates PNs with an inferior spread.
5 Conclusions and Future Work
In this paper we (i) describe a new class of multi-objective interpolated contin-uous optimisation problems (MO-ICOPs) constructed using a weighted inverse distance function and we (ii) proceed to analyse the comparative run-time per-formance of four established MOEAs on a benchmark of 1200 random MO-ICOP instances using multiple criteria.
The optimisation results indicate that MO-ICOPs propose challenges to all tested multi-objective optimisation paradigms. GDE3 consistently achieves the lowest benchmark-wide average hypervolume attainment levels despite obtaining the best approximation of the PF on 10% of the problems tested. DECMO2++ only demonstrates its characteristic fast converging behaviour during the very
Fig. 7.Preference of MOEA/D-DE over NSGA-II when considering differences in aver-age performance over 100 independent runs confirmed by statistical significance testing (left). Example of the impact ofkon the PF shape of 9 MO-ICOPs withd= 20(right).
NSGA-II. The comparative performance of NSGA-II and MOEA/D-DE DRA is strongly influenced by the weighting of the inverse distance function and the dimension of the problem.
Since the observed convergence behaviours of GDE3 and DECMO2++ some-what contrast with those previously reported on widely used benchmarks [23], moving forward we plan to (i) investigate more closely the causes that impact the general performance of all four algorithms on MO-ICOPs (ii)and complement existing benchmark sets with both random and real-world based MO-ICOPs in order to obtain a well-balanced test rig that can effectively support the discovery of robust MOEAs and/or robust MOEA parameterisations.
Finally, we believe that more comprehensive test sets can provide a better insight on algorithm performance by characterising problems through the de-velopment of landscape and objective space features. As it is already the case in single-objective optimisation [15], such advancements could lead to the ap-plication of landscape and objective space features for algorithm selection or algorithm performance prediction.
Acknowledgments
This work has been supported by the COMET-K2 “Center for Symbiotic Mecha-tronics” of the Linz Center of Mechatronics (LCM) funded by the Austrian fed-eral government and the fedfed-eral state of Upper Austria.
References
1. Brockhoff, D., Tusar, T., Auger, A., Hansen, N.: Using well-understood singlobjective functions in multisinglobjective black-box optimization test suites. ArXiv e-prints, 1604.00359v3 (2019)
2. Christie, L.A., Brownlee, A.E., Woodward, J.R.: Investigating benchmark cor-relations when comparing algorithms with parameter tuning. In: Proceedings of the Genetic and Evolutionary Computation Conference Companion. pp. 209–210 (2018)
3. Coello Coello, C.A., Lamont, G.B.: Applications of multi-objective evolutionary algorithms. World Scientific (2004)
4. Corne, D.W., Knowles, J.D.: No free lunch and free leftovers theorems for mul-tiobjective optimisation problems. In: International Conference on Evolutionary Multi-Criterion Optimization. pp. 327–341. Springer (2003)
5. Deb, K.: Multi-Objective Optimization using Evolutionary Algorithms. John Wiley & Sons (2001)
6. Deb, K., Pratap, A., Agarwal, S., Meyarivan, T.: A fast and elitist multiobjec-tive genetic algorithm: NSGA-II. IEEE Transactions on Evolutionary Computation
6(2), 182–197 (2002)
7. Dunn, O.J.: Multiple comparisons among means. Journal of the American statis-tical association56(293), 52–64 (1961)
8. Fieldsend, J.E., Chugh, T., Allmendinger, R., Miettinen, K.: A feature rich distance-based many-objective visualisable test problem generator. In: Proceed-ings of the Genetic and Evolutionary Computation Conference. p. 541–549. GECCO ’19, Association for Computing Machinery, New York, NY, USA (2019). https://doi.org/10.1145/3321707.3321727
9. Ishibuchi, H., Akedo, N., Nojima, Y.: A many-objective test problem for visually examining diversity maintenance behavior in a decision space. In: Proceedings of the 13th Annual Conference on Genetic and Evolutionary Computation. p. 649– 656. GECCO ’11, Association for Computing Machinery, New York, NY, USA (2011). https://doi.org/10.1145/2001576.2001666
10. Jaszkiewicz, A.: On the performance of multiple-objective genetic local search on the 0/1 knapsack problem - A comparative experiment. IEEE Transactions on Evolutionary Computation6(4), 402–412 (2002)
11. Kukkonen, S., Lampinen, J.: GDE3: The third evolution step of generalized dif-ferential evolution. In: IEEE Congress on Evolutionary Computation (CEC 2005). pp. 443–450. IEEE Press (2005)
12. Lacroix, B., Christie, L.A., McCall, J.A.: Interpolated continuous optimisation problems with tunable landscape features. In: Proceedings of the Genetic and Evolutionary Computation Conference Companion. pp. 169–170 (2017)
13. Loshchilov, I., Schoenauer, M., Sebag, M.: A mono surrogate for multiobjective optimization. In: Proceedings of the 12th annual Conference on Genetic and Evo-lutionary Computation (GECCO). pp. 471–478. ACM (2010)
14. Mann, H.B., Whitney, D.R.: On a test of whether one of two random variables is stochastically larger than the other. The annals of mathematical statistics18(1), 50–60 (1947)
15. Muñoz, M.A., Sun, Y., Kirley, M., Halgamuge, S.K.: Algorithm selection for black-box continuous optimization problems: A survey on methods and challenges. In-formation Sciences317, 224–245 (2015)
16. Oyama, A., Kohira, T., Kemmotsu, H., Tatsukawa, T., Watanabe, T.: Simultane-ous structure design optimization of multiple car models using the k computer. In: IEEE Symposium Series on Computational Intelligence (2017)
17. Pilát, M., Neruda, R.: Hypervolume-based local search in multi-objective evolu-tionary optimization. In: Proceedings of the 2014 Annual Conference on Genetic and Evolutionary Computation. pp. 637–644. ACM (2014)
18. Shepard, D.: A two-dimensional interpolation function for irregularly-spaced data. In: Proceedings of the 1968 23rd ACM national conference. pp. 517–524 (1968) 19. Silber, S., Bramerdorfer, G., Dorninger, A., Fohler, A., Gerstmayr, J.,
Kop-pelstätter, W., Reischl, D., Weidenholzer, G., Weitzhofer, S.: Coupled opti-mization in magopt. Proceedings of the Institution of Mechanical Engineers, Part I: Journal of Systems and Control Engineering 230(4), 291–299 (2016). https://doi.org/10.1177/0959651815593420
20. Storn, R., Price, K.V.: Differential evolution - a simple and effcient heuristic for global optimization over continuous spaces. Journal of Global Optimization11(4), 341–359 (December 1997)
21. Vrugt, J.A., Robinson, B.A.: Improved evolutionary optimization from genetically adaptive multimethod search. Proceedings of the National Academy of Sciences
104(3), 708–711 (2007)
22. Wolpert, D.H., Macready, W.G.: No free lunch theorems for optimization. IEEE Transactions on Evolutionary Computation1(1), 67–82 (1997)
23. Zăvoianu, A.C., Saminger-Platz, S., Lughofer, E., Amrhein, W.: Two enhance-ments for improving the convergence speed of a robust multi-objective coevolu-tionary algorithm. In: Proceedings of the Genetic and Evolucoevolu-tionary Computation Conference. pp. 793–800. ACM (2018)
24. Zhang, Q., Liu, W., Li, H.: The performance of a new version of MOEA/D on CEC09 unconstrained MOP test instances. Tech. rep., School of CS & EE, Uni-versity of Essex (February 2009)
25. Zitzler, E., Laumanns, M., Thiele, L.: SPEA2: Improving the strength Pareto evo-lutionary algorithm for multiobjective optimization. In: Evoevo-lutionary Methods for Design, Optimisation and Control with Application to Industrial Problems (EU-ROGEN 2001). pp. 95–100. International Center for Numerical Methods in Engi-neering (CIMNE) (2002)
26. Zitzler, E.: Evolutionary Algorithms for Multiobjective Optimization: Methods and Applications. Ph.D. thesis, Swiss Federal Institute of Technology (1999)
27. Zăvoianu, A.C., Lughofer, E., Bramerdorfer, G., Amrhein, W., Klement, E.P.: DECMO2: a robust hybrid and adaptive multi-objective evolutionary algorithm. Soft Computing 19(12), 3551–3569 (2014). https://doi.org/10.1007/s00500-014-1308-7
28. Zăvoianu, A.C., Lughofer, E., Pollak, R., Meyer-Heye, P., Eitzinger, C., Radauer, T.: Multi-objective knowledge-based strategy for process parameter optimization in micro-fluidic chip production. In: Proceedings of the IEEE SSCI 2017 Conference, pp. 1927–1934. IEEE, Honolulu, USA (2017)