Bio-Inspired Clustering of Complex Products
Structure based on DSM
Fan Yang
1Institute of Systems Science and Engineering
Wuhan University of Technology 2
College of Computer Hubei University of Education
Wuhan, China
Pan Wang*, Sihai Guo*, Qibing
Lu
Institute of Systems Science and Engineering
Wuhan University of Technology Wuhan, China
Xingxing Liu
School of Management Wuhan University of TechnologyWuhan, China
Abstract—Clustering plays an important role in the
decomposition of complex products structure. Different clustering algorithms may achieve different effects of the decomposition. This paper aims to proposes a bio-inspired genetic algorithm that is implemented based on its reliable fitness function and design structure matrix (DSM) for clustering analysis of complex products. This new bio-inspired genetic algorithm captures the features of DSM, which is base on the biological evolution theory. Examples of these products include motorcycle engines that are presented for clustering. The five cluster alternatives are obtained from the regular clustering algorithm and the bio-inspired genetic algorithm, while the best cluster alternative comes from the bio-inspired genetic algorithm. The results show that this algorithm is well adaptable, especially when the product elements have complicated and asymmetric connections.
Keywords—Bio-inspired computation; genetic algorithm (GA); reliable fitness function; DSM; complex products; clustering
I. INTRODUCTION
In this case, complex products are those whose structure is more complicated and whose module partition is scattered. There are many methods for the designing the physical structure of complex products, including the DSM method [1], the Hatley/Pirbha method [2], the stochastic block model [3], and biclustering in machine learning. With fierce competition in the manufacturing industry, however, the issue of physical structure is a problem worthy of concern. The clustering methods for the physical structure of complex products are thus a key consideration for core competition in business.
In recent years, studies on the function module partition have been frequently discussed. The goal is to construct a symmetric matrix, transformed from attributes of many products [4, 5]. Then, the scholars create new methods to deal with this matrix, in order to gather similar elements for optimized clustering. Erixon et al. [6] propose a module partition method based on impact factors like technological innovation, planning, parameters, and style. Gu et al. [7] propose a product modularization for life cycle engineering, a method of constructing correlation matrixes for the stage targets. At this time, the design professors then select the better module partition result by comparing the results from different design objectives. Salhieh et al. [8] use design for modularity
by the Fuzzy Theory, a quantitative description and analysis algorithm. Stone et al. [9] use a heuristic method for identifying modules for product architectures based on energy flow, material flow, and signal flow in architecture charts. Gao et al. [10] identify functional modules using generalized directed graphs. Chen et al. [11] propose the dynamic cluster analysis of a fuzzy equivalence matrix to be applied to a dynamic partition function module.
The above studies offer better routes for structuring partitions for new products, but few of them consider the physical structure or the asymmetric connections between product components. DSM, first proposed by Dr. Steward, could solve these problems partly [1]. It consists of a matrix with homogenous rows and columns, and the value of each cell is not a random probability. Thus, it is different from the matrix in the Stochastic Block Model or the biclustering model. Many studies concentrate on how to cluster and evaluate the module partition based on DSM [12]. For the efficiency of clustering, some studies use GA for identifying modules. Tseng et al. [13] use a grouping genetic algorithm for clustering the components. Crossover mechanisms are modified according to the need of modular design by a reasonable evaluation. Zhou et al. [14] propose a function module partition method for innovative product design in order to meet customers’diverse requirements and to shorten design and assembly time. Liu et al. [15] establish a method of decomposition and clustering of the product architecture performed by GA. Their method is based on a building the product with DSM.
With the help of literatures [11, 15, 16], in this paper, a bio-inspired genetic algorithm is proposed for a components cluster based on DSM. This algorithm uses a more reasonable fitness function and an asymmetric matrix. Compared with a regular cluster method, the bio-inspired genetic algorithm is suitable for a cluster optimized for complex product architecture.
II. DSMIMPLEMENTATION AND EVALUATION
The aim of DSM is to decompose elements of a product first, and then divide the elements into different clusters. It is possible that all the elements may cluster into one, determined by the connection degree between elements. Finally, the best one can be selected by several different cluster alternatives through an evaluation function.
A. Physical DSM
DSM is a product engineering matrix tool, which has four applications: components clustering, team design, task assign and action design [16]. The first one is used here. Each element in DSM corresponds to each component of the product. Cells indicate the connection among elements, except those that are diagonal. Empty cells mean no connection between corresponding elements, while cells with high value indicate high connections intensity. As shown in figure 1, six components as (a1, a2, a3, a4, a5, a6) compose product A. The value of the connection degree between a1 and a3 is two. Product A can be divided into three modules using manual classification. Module 1 includes a1, a2, and a5. Module 2 includes a3 and a5. Module 3 includes only a6.
The relations of space, energy, information, or material could be considered to confirm the value of the connection degree with the weighted average. A larger connection degree shows that a closer relationship between the two elements.
initial model a1 a2 a3 a4 a5 a6 a1 3 1 a2 1 4 4 a3 4 1 a4 3 3 3 a5 4 3 a6 1 2 1 3 4 (a) (b) Fig. 1. DSM of product A
B. Clustering and evaluation function
The evaluation influences the clustering process. The common simple clustering algorithm is based on specific evaluation functions, which are performed using software tools like SPSS and Matlab. In these tools, the clustering methods are almost the same, meaning that it is necessary to generate a symmetric matrix. We also must complete clustering with evaluation methods using maximum or minimum distance as a parameter. This matrix is similar to the DSM mentioned above, with the exception of diagonal symmetry. The internal concentration and the external linkage degree are key parameters to the cluster alternatives. They can be calculated by asymmetrical DSM and the related formula after elements clustering. Then, the cluster alternative with the higher internal concentration and the lower external linkage degree is considered to be the better one. In order to obtain a reasonable evaluation model, the equation for the internal concentration
and the external linkage degree are set with some assumptions. The elements in DSM representing components of a product often convert into one or more modules after clustering. The assumptions are as follows:
1) Assume a product is comprised of m components. The number of components is the same as the elements of DSM. The DSM is m×m matrix. And dij is the value at the ith row, jth
column (expressed cell (i,j)) in DSM where i, j∈(0,m). It represents the value of connection degree.
2) The individual element means it is the only element in a module where the internal concentration is 0.
3) Overlapping elements are allowed, meaning that one element may belong to two or more modules.
4) Unless correlation occurs, clusters decompose. We maximize the total internal concentration value and minimize the total external linkages.
5) Assume gd as the internal concentration of the dth
module. For the purpose of system optimization, gd is in direct
proportion to the total value of cells in the dth module; while it is inversely proportional to the number of connections inside the dth module. A higher total value shows strong cohesion, while the more connections may disperse the concentration. The formula for the internal concentration of the dth module is as follows:
1, ,
0,
1
1
(
),
1
(
1)
d d d ij d d i j M d dk
g
d
k
k k
(1)Assume the total number of modules is D; kd is the number of elements in dth module.
k
d
1
means the case of the only element in a module where the internal concentration is 0, namely the "individual element". The total value of internal concentration of system G is given by:1 D d d
G
g
(2)6) Assume rdb as the external linkages between dth and bth
modules. Also, for the purpose of optimizing the system, rdb is
in direct proportion to the total value of cells between the dth and the bth modules. It means that the higher the total value, the tighter the connection between the two modules. The formula for the external linkages between the dth and the bth modules is as follows: , db ij i d j b
r
d
(3) The total value of external linkages of system R is as follows: 1 1 1 D D db d b dR
r
(4) manual clustering a5 a1 a2 a4 a3 a6 a5 4 3 a1 3 1 a2 4 1 1 4 a4 3 3 3 a3 4 1 a6 4 1 2 3 1 Module 1 Module 2 Module 37) According to the explanation of G and R, it is obvious that a higher G and a smaller R means a better clustering effect. Thus, the evaluation value can be set as follows:
F G R
(5)III. THE BIO-INSPIRED GENETIC ALGORITHM
A. Fitness function
When a product is not complex, it can cluster the DSM with manual methods. The optimal alternative can then be selected with the above evaluation model from the set of alternatives. However, in the case that there are too many components, connections between components are made complicated, and handling it manually is no longer suitable. In this section, the GA with an optimized fitness function is presented to select the clustered alternatives.
Let’s take product A as an example. One of its chromosomes and the clustered alternative is shown in Table 1. It can be described as a 01-matrix. When an element belongs to a cluster, the gene value is 1, others are 0. The elements in one column should not all be 0, meaning an element must belong to one or more cluster(s). The length of a chromosome is D×m,
D≤m/2.
TABLE I. THE CLUSTERING OF MODULES AND THE ENCODING OF A
CHROMOSOME Encoding of a chromosome a 1 a 2 a 3 a 4 a 5 a 6 Mod ule 1 1 1 0 0 1 0 Mod ule 2 0 0 1 1 0 0 Mod ule 3 0 0 0 0 0 1
The chromosome 01-matrix can be presented as:
1
1
0
0
1
0
0
0
1
1
0
0
0
0
0
0
0
1
rst
(6)The corresponding clustering alternative is:
1,2,5 , 3,4 , 6
A
(7) Based on formulas (1) to (5), the fitness function of every chromosome can be designed as:
min max min
( )
F h
F
Fit
F
F
(8) Where F(h)is the evaluation value of the hth chromosome,Fmax and Fmin is the maximum and the minimum respectively. Then, the selection probability is:
1
( )
( )
( )
n hF h
p h
F h
(9)B. The flow of the bio-inspired algorithm
The equations are an exception to the prescribed specifications of this template. You will need to determine whether or not your equation should be typed using either the Times New Roman or the Symbol font (please no other font). To create multileveled equations, it may be necessary to treat the equation as a graphic and insert it into the text after your paper is styled.
The parameters, specifically chromosome size n, crossover, and mutation probability, of the bio-inspired genetic algorithm are fixed a priori. Based on the fitness function and the selection probability above, the steps of the GA are as follows:
Step 1: Generate randomly n chromosomes, actually 01-matrixes by the requirement above;
Step 2: Generate corresponding clustered alternatives from chromosomes;
Step 3: Calculate the evaluation values of the alternations based on the evaluation function;
Step 4: Calculate the fitness function values and the selection probabilities based on the evaluation values;
Step 5: Select the top m chromosomes and eliminate the bad ones, and adds new chromosomes so as to the total number is n;
Step 6: Realize the crossover and mutation with the 2- dimension multiple-points crossover and 2-dimension basic mutation [16] (the suitable values may be obtained by trial-and-error.).
Step 7: Judge the terminated condition — if the optimal one in one generation keeps constantly evolves, stop; for others, return to step 2.
IV. CASE STUDY
A. Construction of the DSM
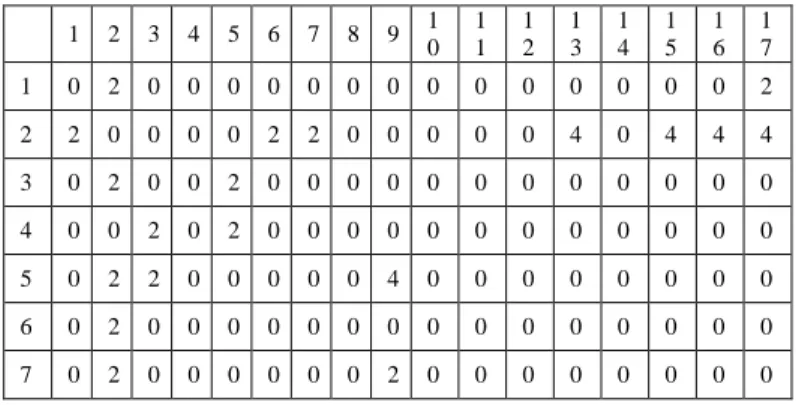
For example, a motorcycle engine with seventeen components would create a DSM matrix like Table 2 by experts’ evaluation and the AHP method.
TABLE II. DSM MATRIX
1 2 3 4 5 6 7 8 9 1 0 1 1 1 2 1 3 1 4 1 5 1 6 1 7 1 0 2 0 0 0 0 0 0 0 0 0 0 0 0 0 0 2 2 2 0 0 0 0 2 2 0 0 0 0 0 4 0 4 4 4 3 0 2 0 0 2 0 0 0 0 0 0 0 0 0 0 0 0 4 0 0 2 0 2 0 0 0 0 0 0 0 0 0 0 0 0 5 0 2 2 0 0 0 0 0 4 0 0 0 0 0 0 0 0 6 0 2 0 0 0 0 0 0 0 0 0 0 0 0 0 0 0 7 0 2 0 0 0 0 0 0 2 0 0 0 0 0 0 0 0
8 0 0 0 0 0 0 1 0 4 0 0 0 0 0 0 0 0 9 0 0 0 0 4 0 2 4 0 0 0 0 0 0 0 0 0 1 0 0 2 0 0 0 0 0 0 0 0 0 4 0 0 0 0 0 1 1 0 0 0 0 0 0 0 0 0 0 0 2 0 0 0 0 0 1 2 0 2 0 0 0 0 0 0 0 4 2 0 0 0 0 0 0 1 3 0 4 0 0 0 0 0 0 0 0 0 0 0 4 0 0 0 1 4 0 4 0 0 0 0 0 0 0 0 0 0 4 0 4 0 0 1 5 0 4 0 0 0 0 0 0 0 0 0 0 0 0 0 0 0 1 6 0 4 0 0 0 0 0 0 0 0 0 0 0 0 1 0 0 1 7 2 4 0 0 0 0 0 0 0 0 0 0 0 0 0 0 0 B. Regular clustering
Clustering it with MATLAB, firstly the asymmetric matrix is transferred into the symmetric one, taking the means of dij and dji as the new dij and dji. The following results are obtained by adopting the clustering algorithm of the MATLAB (for better effectiveness, the element 2 and 6 are eliminated, and regarded as independent elements).
Then several clustering alternatives can be obtained:
A1={[1,17],[2],[3,4,5],[6],[5,7,8,9],[10,11,12],[13,14,15,16]}
A2={[1,17],[2],[3,4,5,7,8,9],[6],[10,11,12],[13,14,15,16]}
A3={[1,17],[2],[3,4,5],[6],[7,8,9],[10,11,12],[13,14,15,16]}
A4={[1,17],[2],[3,4],[6],[5,7,8,9],[10,11,12],[13,14,15,16]}
C. Genetic clustering
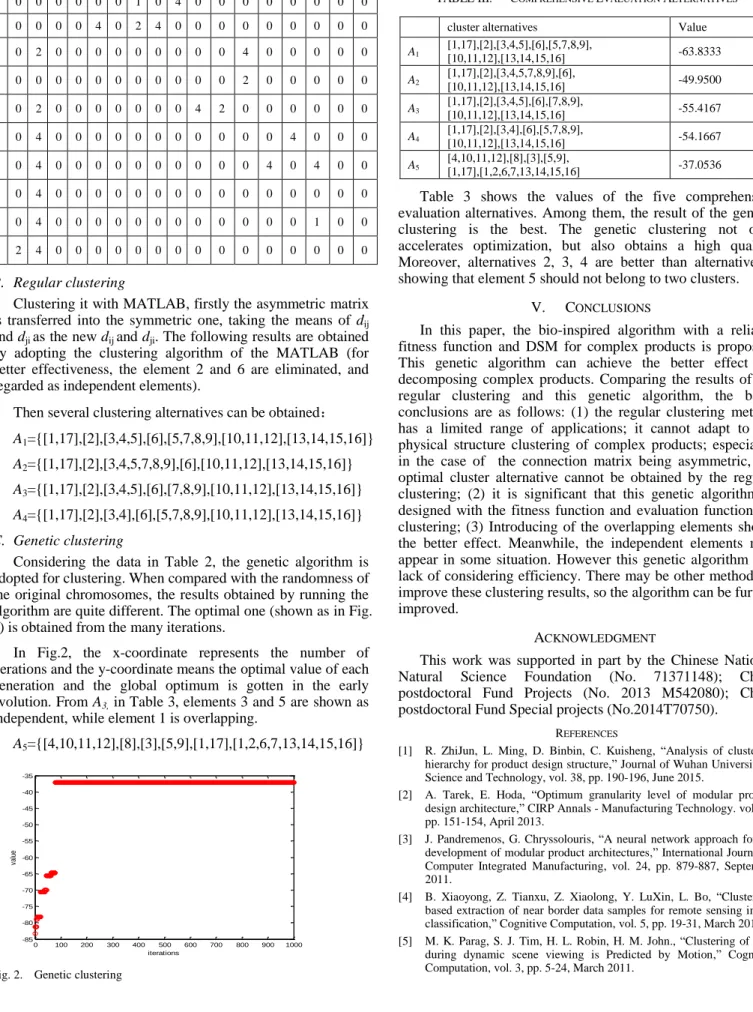
Considering the data in Table 2, the genetic algorithm is adopted for clustering. When compared with the randomness of the original chromosomes, the results obtained by running the algorithm are quite different. The optimal one (shown as in Fig. 2) is obtained from the many iterations.
In Fig.2, the x-coordinate represents the number of iterations and the y-coordinate means the optimal value of each generation and the global optimum is gotten in the early evolution. From A3, in Table 3, elements 3 and 5 are shown as independent, while element 1 is overlapping.
A5={[4,10,11,12],[8],[3],[5,9],[1,17],[1,2,6,7,13,14,15,16]}
Fig. 2. Genetic clustering
TABLE III. COMPREHENSIVE EVALUATION ALTERNATIVES
Table 3 shows the values of the five comprehensive evaluation alternatives. Among them, the result of the genetic clustering is the best. The genetic clustering not only accelerates optimization, but also obtains a high quality. Moreover, alternatives 2, 3, 4 are better than alternative 1, showing that element 5 should not belong to two clusters.
V. CONCLUSIONS
In this paper, the bio-inspired algorithm with a reliable fitness function and DSM for complex products is proposed. This genetic algorithm can achieve the better effect for decomposing complex products. Comparing the results of the regular clustering and this genetic algorithm, the basic conclusions are as follows: (1) the regular clustering method has a limited range of applications; it cannot adapt to the physical structure clustering of complex products; especially, in the case of the connection matrix being asymmetric, the optimal cluster alternative cannot be obtained by the regular clustering; (2) it is significant that this genetic algorithm is designed with the fitness function and evaluation function for clustering; (3) Introducing of the overlapping elements shows the better effect. Meanwhile, the independent elements may appear in some situation. However this genetic algorithm is a lack of considering efficiency. There may be other methods to improve these clustering results, so the algorithm can be further improved.
ACKNOWLEDGMENT
This work was supported in part by the Chinese National Natural Science Foundation (No. 71371148); China postdoctoral Fund Projects (No. 2013 M542080); China postdoctoral Fund Special projects (No.2014T70750).
REFERENCES
[1] R. ZhiJun, L. Ming, D. Binbin, C. Kuisheng, “Analysis of clustering hierarchy for product design structure,” Journal of Wuhan University of Science and Technology, vol. 38, pp. 190-196, June 2015.
[2] A. Tarek, E. Hoda, “Optimum granularity level of modular product design architecture,” CIRP Annals - Manufacturing Technology. vol. 62, pp. 151-154, April 2013.
[3] J. Pandremenos, G. Chryssolouris, “A neural network approach for the development of modular product architectures,” International Journal of Computer Integrated Manufacturing, vol. 24, pp. 879-887, September 2011.
[4] B. Xiaoyong, Z. Tianxu, Z. Xiaolong, Y. LuXin, L. Bo, “Clustering-based extraction of near border data samples for remote sensing image classification,” Cognitive Computation, vol. 5, pp. 19-31, March 2013. [5] M. K. Parag, S. J. Tim, H. L. Robin, H. M. John., “Clustering of gaze
during dynamic scene viewing is Predicted by Motion,” Cognitive Computation, vol. 3, pp. 5-24, March 2011.
0 100 200 300 400 500 600 700 800 900 1000 -85 -80 -75 -70 -65 -60 -55 -50 -45 -40 -35 iterations va lu e
cluster alternatives Value
A1 [1,17],[2],[3,4,5],[6],[5,7,8,9], [10,11,12],[13,14,15,16] -63.8333 A2 [1,17],[2],[3,4,5,7,8,9],[6], [10,11,12],[13,14,15,16] -49.9500 A3 [1,17],[2],[3,4,5],[6],[7,8,9], [10,11,12],[13,14,15,16] -55.4167 A4 [1,17],[2],[3,4],[6],[5,7,8,9], [10,11,12],[13,14,15,16] -54.1667 A5 [4,10,11,12],[8],[3],[5,9], [1,17],[1,2,6,7,13,14,15,16] -37.0536
[6] G. Exixon, A. V.Yxkull, M. A. Arnstr, “Modularity-the basis for product and factory reengineering,” Annals of the CIRP, vol. 45, pp. 1-6, July 1996.
[7] P.Gu P, S.Sosale, “Product modularization for life cycle engineering,” Robotics and Computer Integrated Manufacturing, vol. 15, pp. 387-401, October 1999.
[8] S. M. Salhieh, A. K. Kamrani, “Macro level product development using design for modularity,” Robotics and Computer Integrated Manufacturing, vol. 15, pp. 319-329, August 1999.
[9] R. B. Stone, K. L. Wood, R. H. Crawford, “A heuristic method for identifying modules for product architectures,” Design Studies, vol. 21, pp. 5-31, January 2000.
[10] G. Fei, X. Gang, T. Simpson, “Identifying functional modules using generalized directed graphs: definition and application,” Computer in Industry, vol. 61, pp. 260-269, April 2010.
[11] C. Jiwen, Z. Jinsheng, W. Zhi, H. Bo, W. Fakai, “Research on function module dynamic partition for product innovation Design,” The Chinese mechanical engineering, vol. 24, pp. 251-256, January 2013.
[12] L. Jiangang, T. Dunbing, Y. Chun, H. Xiangdong, J. Taotao, W. Ningsheng, “Clustering and evaluating of product architecture based on physical DSM and row-column transform,” Systems Engineering and Electronics, vol. 30, pp. 1904-1908, October 2008.
[13] T. Hwaien, C. Chienchen, L. Jiadiann, “Modular design to support green life-cycle engineering,” Expert Systems with Application, vol. 34, pp. 2524-2537, May 2008.
[14] Z. Kaijun, L. Dongbo, T. Yifei, “Function module partition method for product innovative design,” Journal of Computer Aided Design & Computer Graphics, vol. 19, pp. 73-83, January 2007.
[15] L. Jiangang, H. Xiangdong, W. Ningsheng, Q. Xiaoming, M. An, “Clustering and reorganization of product architectures based on genetic algorithm,” Mechanical Science and Technology, vol. 25, pp. 1318-1337, November 2006.
[16] T. Guobing, Q. Xiaoming, L. Jiangang, Product design and development based on design structure matrix (DSM), Bei Jing: Science press, 2009.