Analytical Evaluation of Higher Order
Sectorization, Frequency Reuse and User
Classification Methods in OFDMA Networks
Jianhua He, Wenqing Cheng, Zuoyin Tang, David L´opez-P´erez and Holger Claussen
Abstract—Higher order sectorization (HOS), which splits macrocells into a larger number of smaller sectors, are receiving significant interest as a cost-effective means of improving network capacity. Potentially, the capacity gain with HOS is proportionally linear to the number of sectors per cell due to spatial reuse, but factors such as non-ideal antenna radiation patterns together with inter-cell interference can significantly reduce this capacity gain. We develop a statistical model to theoretically characterize the performance of HOS deployments in wireless networks using orthogonal frequency division multiplex access (OFDMA). More-over, a fractional frequency reuse scheme is considered, which aids to mitigate inter-cell interference. The model provides a fast and effective tool for studying network performance in terms of user signal quality, site throughput and outage probability, and it can be used to speed up network planning and optimization. In addition, we consider the impact of user classification methods in the analysis, and propose a new spectrum efficiency-based user classification method that improves resource utilization and al-location fairness. Performance results indicate that the proposed model is accurate, and shows a diminishing performance gain of HOS deployments with the number of antennas. The proposed user classification method improves network performances with respect to state of the art approaches.
I. INTRODUCTION
The increasing popularity of smartphones and video on demand is driving a strong growth in wireless network traffic. As a result, enhancing network capacity is a major concern of mobile operators. To do so, apart from well-known techniques such as small cell deployments, multi-antenna techniques, coordinated resource management and inter-cell interference mitigation, the usage of HOS is receiving significant interest in the cellular community [1]–[5]. With HOS deployments, macrocells are split into a larger number of smaller sectors by using of a large number of directional antennas per base station (BS). This facilitates spectrum reuse and increases the network capacity.
In the baseline configuration of cellular networks, macrocell BSs are usually equipped with 3 sectors. HOS with 6, 12 or even more sectors per macrocell BS have the potential of enhancing network capacity by exploiting spatial reuse without Jianhua He (email: [email protected]) and Zuoyin Tang (email:
[email protected]) are with the School of Engineering and Applied Science, Aston University, UK. Wenqing Cheng (email:
[email protected], Corresponding Author) is with the School of Electronic Information and Communications, Huazhong University of Science and Technology, China. David L´opez-P´erez (email:
[email protected]) and Holger Claussen (email:
[email protected]) are with Bell Labs, Nokia, Ireland.
incurring significant capital and operational expenditures com-pared to deploying new macrocell BSs or frequency carriers. However, HOS also come with their own challenges in terms of hardware development, inter-cell interference and mobility management, and there are a number of research questions that need to be addressed before HOS can be considered as a solid candidate technology for the next generation of cellular technologies.
The applicability of HOS to conventional macrocellular networks has been the subject of a large body of research in previous years, in both code division multiple access (CDMA) and OFDMA networks, e.g., [7]–[14].
In CDMA networks, the performance gain of HOS due to higher order diversity with fixed antennas beams was analysed in [7]. In [8], the performance of a real WCDMA network with 6-sector BSs and fixed antennas beams was evaluated under non-homogeneous network deployments. In [9], similar use cases as in [8] were investigated considering smart antennas.
In the last decade, OFDMA has been used in several cellular network and mobile broadband standards, including the downlink of the LTE and Mobile-WiMAX. Due to its different physical layer, the findings of [7]–[9] do not apply. In OFDMA networks, the performance gain of HOS with multiple antennas was evaluated in [10]. In [11], the HOS performance was compared with that of multi-user MIMO and network MIMO. In [12], this performance comparison was extended to include multi-user MIMO with 12 antennas per BS. Simulation results showed that HOS can achieve higher average user throughput than these MIMO techniques for some specific scenarios. Recently, in [13], the impact of antenna beamwidth on HOS performance was analysed. Moreover, in [14], a study of HOS performance in a LTE network using 3GPP compliant simulations was presented. In [15], a study of dynamic cell expansion with multiple sectors for energy efficiency improvement was presented, in which vertical sectorization was exploited.
The above research works indicate the potential of HOS, but only consider universal frequency reuse schemes and no inter-cell interference coordination techniques. As will be presented in Section V, HOS deployments with universal frequency reuse can lead to severe inter-cell interference and very high outage probability. In contrast, in OFDMA networks, fractional fre-quency reuse (FFR) schemes can be used to mitigate inter-cell interference, and have the potential to optimize the tradeoff between overall network and cell-edge performance [4], [19], [20]. The performance evaluation of HOS without interference
mitigation techniques (such as frequency reuse schemes) may not provide proper recommendations for HOS deployments. Thus, we suggest that these two technologies should be developed and analysed in conjunction.
In addition to the mentioned issues, the above evaluations of HOS performance in OFDMA networks rely on traditional simulation based approaches that have been used in LTE networks [21]. In order to have an effective evaluation of HOS deployments, a fast and effective analytical tool for system level performance evaluation of HOS deployments with FFR schemes in OFDMA networks is highly demanded. Such analytical tool can also help achieving the research target of supporting the reproducability of performance evaluations conducted by different researchers [34].
In this paper, in view of the aforementioned research prob-lems, we investigate HOS deployments with FFR schemes in OFDMA networks, and develop a novel statistical model to theoretically characterize their performance. The main contri-butions of this paper are summarized in the following:
• We have developed a unified and accurate statistical analytical model for the performance evaluation of HOS deployments with FFR schemes in OFDMA networks. In the proposed model, we concentrate on a strict FFR scheme [4], [19], [20], and apply the widely used Fenton-Wilkinson method to approximate the sum of log-normal distributed interferers as log-normal distributed random variables (RVs) [24]. We also extend the analytical model to correlated interferers [25]. The proposed model pro-vides a fast and effective tool for performance evaluation, and can be used to aid network planning and optimization procedures in HOS deployments. In the literature, many analytical models have been developed for mobile cellular networks including the increasingly popular stochastic geometry based models (e.g. [3], [5], [20], [22], [23], [30], [31]), but sector antenna radiation pattern and cor-related shadowing have not been taken into account. • We have investigated the impact of inter-cell interference
mitigation in HOS deployments with FFR schemes in OFDMA networks in terms of overall network throughput and user outage probability. We propose a spectrum effi-ciency based user classification method for FFR schemes that improves resource utilization and allocation fairness in HOS deployments.
• With both analytical and simulation evaluation ap-proaches, which provide cross verification and higher reli-ability, we have conducted a comprehensive performance evaluation of HOS deployments using an abstracted LTE link level model. The impacts of 3D antenna radiation pattern, FFR schemes and many other system parameters on the network performance (e.g. user signal quality, site throughput and outage probability) are considered. Different HOS, FFR and user classification combinations are compared. A diminishing performance gain with the number of antennas is observed. The numerical analy-sis of HOS deployments sheds some new light in this research area.
The rest of this paper is organized as follows. In Section II,
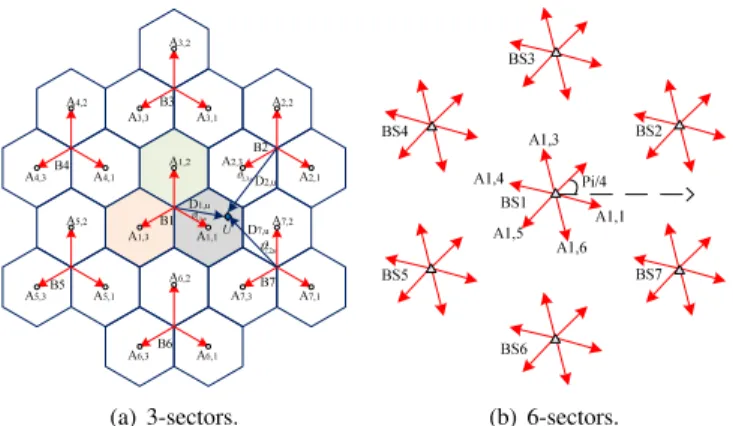
B1 B2 B7 B3 B4 B5 B6 U A1,1 D2,u D7,u D1,u u , 1 , 1 ϑ u ,2 , 7 ϑ u , 3 , 2 ϑ A1,2 A1,3 A6,1 A6,2 A6,3 A5,1 A5,2 A5,3 A4,1 A4,2 A4,3 A3,1 A3,2 A3,3 A2,1 A2,2 A2,3 A7,1 A7,2 A7,3 (a) 3-sectors. BS1 BS2 BS7 BS3 BS4 BS5 BS6 A1,1 A1,3 A1,5 Pi/4 A1,6 A1,4 (b) 6-sectors. Fig. 1. Examples of cellular network layouts.
the system model and assumptions are introduced. In Sec-tion III, various user classificaSec-tion methods for FFR schemes are presented. In Section IV, an analytical model is devel-oped for HOS performance analysis with and without FFR schemes. In Section V, the numerical results and discussions are presented. In Section VI, the conclusions are drawn.
II. SYSTEMMODEL
We consider the BS configurations with 3, 6 and 12 sectors. For the 3-sector BS configuration, a clover-leaf network layout is used1. It is important to note that the analytical model developed in this paper is general, and can also be used for higher order sectorization as well as other network deployment layouts.
Fig. 1(a) shows an example of the 3-sector BS hexagonal network layout with 1 tier of interfering BSs. For the 6-sector and 12-6-sector BS configurations, the BSs are placed at identical locations, but the main directions of the sector antennas are offset with respect to the 3-sector layout to avoid neighbouring sectors pointing each other. Fig. 1(b) shows an example of 6-sector BS network layout. It is important to note that the analytical model developed in this paper is general, and can also be used for higher order sectorization as well as other network deployment layouts.
Using these network layouts, let us consider a cellular network with Nsites sites equipped with one BS each, where
the ith BS (i ∈ [1, Nsites]) is located at Bi. The inter-site
distance is denoted byRISD.
The number of sectors per BS is denoted by Na, and as
indicated earlier, we concentrate our analyses on BS con-figurations with Na = 3, Na = 6 or Na = 12. The jth
sector of theith site is denoted byAi,j, wherei∈[1, Nsites]
and j ∈ [1, Na]. Let ϑi,j denote the horizontal angle of
the main radiation direction of sector Ai,j, which is set to (j−1)∗π/Na−ϑi,1for (j∈[2, Na]), withϑi,1=−π/6for
the 3-sectors andϑi,1=−π/12for the 6-sector and 12-sector
BS configurations, respectively.
Users are assumed to be uniformly distributed within each service area. Without loss of generality, we focus our analysis on the performance of users associated with sector A1,1,
1For the 3-sector BS case, the clover-leaf network layout was found to have
and assume that BSs are equipped with a round-robin sched-uler. We also consider a fully loaded network, in which the frequency resources allocated to each sector are fully used. Table 1 lists the main notations used in this paper.
A. Channel model and antenna radiation pattern
Since we consider a fully loaded network, we focus our studies on the transmission performance of one physical re-source block (PRB), which represents the basic time-frequency resource unit available for data transmission in LTE networks. Let us consider a general user u located at position Lu
with coordinates (xu,yu) inside sectorA1,1. LetDi,ube the
distance between BS i and user u, and ϑi,j,u be the angle
between the main radiation direction of sector Ai,j and user u, which can be calculated by basic geometric methods.
Let us now define the signal powerPi,j,u received by user ufrom sectorAi,j as
Pi,j,u=PtGPL(i, u)ψi,uGA(i, j, u), (1)
where Pt is the BS transmit power over a PRB, GPL(i, u)
is the path gain (loss) between BS i and user u,ψi,u is the
shadow fading between BS i and user u, and GA(i, j, u) is
the antenna gain between sectorAi,j and useru, For ease of
notation, we let Pr,i,j,u =PtGPL(i, u)GA(i, j, u) denote the
mean received power by user ufrom sectorAi,j.
The path gain (loss) GPL(d) models the propagation loss
between BS i and user u. The model specified in [6] for outdoor line-of-sight communications is used,
GPL(d) =−34.02−22log10(d) [dB]. (2)
wheredis the distance between BS iand useru.
The shadow fading ψi,u models the variability of the path loss between BS i and user u, which is assumed to follow a log-normal distribution with location value of 0 and scale value of σ [6]. Moreover, the shadow fading within sectors of a site is assumed to be fully correlated, while the inter-site shadow fading correlation is denoted by ρ.
The antenna gainGA(i, j, u)models the gain of the antenna
in the direction between sector Ai,j and useru,
GA(i, j, u) =GA,maxGA,h,v(ϑi,j,u, θi,j,u), (3)
whereGA,maxis the maximum antenna gain, andGA,h,v(ϑ, θ)
is the 3-dimensional antenna radiation pattern with horizontal angle ϑand vertical angleθ.
GA,h,v(ϑ, θ)is calculated using the model in [6] as
GdBA,h,v(ϑ, θ) = −min −1∗ GdBA,h(ϑ) +GdBA,v(θ) , GdBFront , GA,h,v(ϑ, θ) = 10G dB A,h,v(ϑ,θ)/10. (4) where GA,h(ϑi,j,u)and GA,v(θi,j,u)are the normalized
hor-izontal and vertical radiation pattern offsets of the sector antenna, and GdB
Front is the antenna front to back ratio.
Note thatGA,h(ϑi,j,u) andGA,v(θi,j,u)are calculated as
GdBA,h(ϑ) = −min 12( ϑ ϑ3dB )2,25 , (5) and GdBA,v(θ) =−min 12(θ−θdown θ3dB )2,20 , (6)
where ϑ3dB and θ3dB are the horizontal and vertical
half-power beamwidth (HPBW), andθdown is the down-tilt angle.
Taking into account the previous definitions, the signal to interference plus noise ratio (SINR) γu of user ulocated at (xu,yu) within sector A1,1 can be calculated as
γu = Su P j∈ΩIntra,u P1,j,u+ Nsites P i=2 P j∈ΩInter,u Pi,j,u+δ2 ,(7)
whereSu≡ Pi,j,uis the designated signal for useru,ΩIntra,u
and ΩInter,u are the set of IDs of intra-site and inter-site
interfering sectors with regard to user u, respectively, which are determined by the used frequency reuse scheme, andδ2 is
the noise power, which can be calculated as the product of the noise figure and the signal bandwidth. With the assumption of a fully loaded network, the downlink communication is generally interference limited, therefore the impact of noise is negligible and is not considered in this paper.
It is important to note thatPi,j,u is a log-normal variable,
and can be uniquely characterized by its mean and variance, which are denoted byPi,j,u andP[i,j,u, respectively.
III. USERCLASSIFICATION FORFRACTIONALFREQUENCY REUSESCHEMES
In this paper, we considered a strict FFR in this paper. How-ever, it is noted that the proposed user classification method and analytical model are not limited to the strict FFR scheme, but can work with other variants of FFR schemes, such as soft FFR schemes [4]. In the strict FFR, the available bandwidth (denoted asW) is divided into two sub-bands, cell-centre and cell-edge sub-bands, (the bandwidth of which are denoted as
Wc andWe, respectively), whereβ is the bandwidth partition
coefficient, i.e., Wc =βW andWe = (1−β)W. Moreover,
cell-centre sub-bands use a frequency reuse factor of 1 (IFR-1), while cell-edge sub-bands use a frequency reuse of factor 3 (IFR-3). An identical downlink transmit power is applied to both sub-bands.
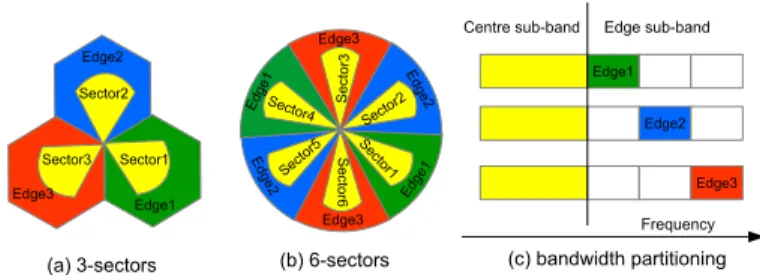
Fig. 2 shows an example of FFR bandwidth reuse for cell-centre and cell-edge in 3-sectors and 6-sectors configurations.
Fig. 2. Illustration of FFR bandwidth reuse with 3-sectors and 6-sectors configurations.
It is noted that the shapes of sector coverage shown in Fig. 2(a) and Fig. 2(b) are given for illustration only. The actual shapes are determined by many factors such as an-tenna directions, anan-tenna patterns and shadowing. With this bandwidth partitioning, cell-centre users can only access the
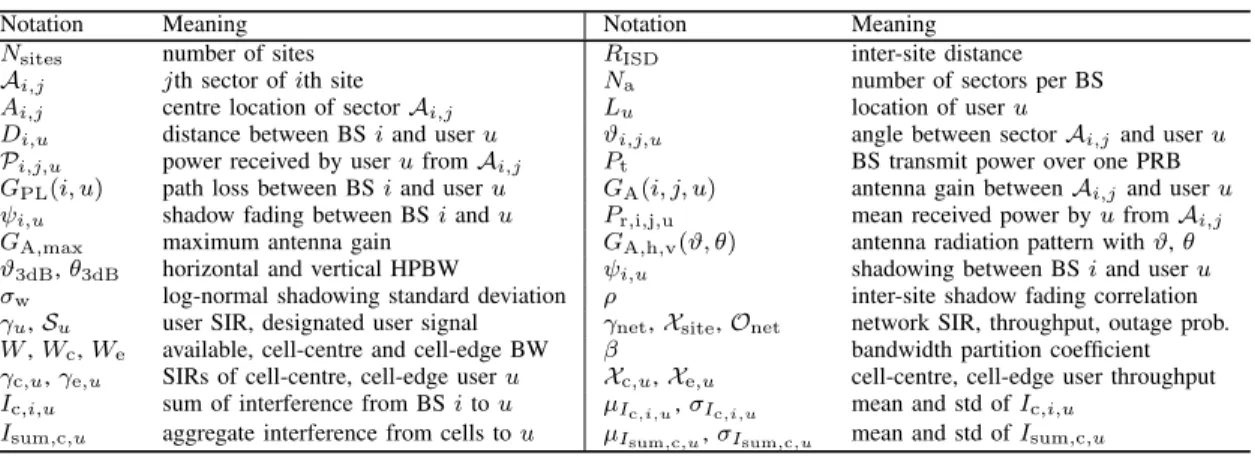
TABLE I NOTATIONS
Notation Meaning Notation Meaning
Nsites number of sites RISD inter-site distance
Ai,j jth sector ofith site Na number of sectors per BS
Ai,j centre location of sectorAi,j Lu location of useru
Di,u distance between BSiand useru ϑi,j,u angle between sectorAi,jand useru
Pi,j,u power received by userufromAi,j Pt BS transmit power over one PRB
GPL(i, u) path loss between BSiand useru GA(i, j, u) antenna gain betweenAi,jand useru
ψi,u shadow fading between BSiandu Pr,i,j,u mean received power byufromAi,j
GA,max maximum antenna gain GA,h,v(ϑ, θ) antenna radiation pattern withϑ,θ
ϑ3dB,θ3dB horizontal and vertical HPBW ψi,u shadowing between BSiand useru
σw log-normal shadowing standard deviation ρ inter-site shadow fading correlation
γu,Su user SIR, designated user signal γnet,Xsite,Onet network SIR, throughput, outage prob.
W,Wc,We available, cell-centre and cell-edge BW β bandwidth partition coefficient
γc,u,γe,u SIRs of cell-centre, cell-edge useru Xc,u,Xe,u cell-centre, cell-edge user throughput
Ic,i,u sum of interference from BSitou µIc,i,u,σIc,i,u mean and std ofIc,i,u
Isum,c,u aggregate interference from cells tou µIsum,c,u,σIsum,c,u mean and std ofIsum,c,u
cell-centre sub-bands and cell-edge users can only access the cell-edge sub-bands.
A. Distance-based user classification (UC-Dist) method
With the distance-based classification method, a user is classified as cell-centre user if its distance to the serving BS is less than a given distance threshold, i.e, αRISD/2, where
α is the so-called distance coefficient, 0≤α≤1; otherwise it is classified as cell-edge user. In the following, this user classification method is abbreviated as UC-Dist αmethod. It is noted that IFR-1 and IFR-3 schemes can be regarded as two specific cases of the UC-Dist αmethod, whereαis set to 1
and0, respectively.
This method however has some drawbacks.
• As user position information is required, this method may have limited application in real cellular networks. • For BSs with omni-directional antennas, a smaller
dis-tance between the serving BS and the user usually means better SIR and therefore improved spectrum efficiency. However, this is not always the case for BSs with sector antennas. TheUC-Distαmethod may thus result in a low spectrum efficiency when considering sector antennas. • Another potential issue is that the proportion of traffic
generated by the users in the centre and edge zones may quickly change in the time domain due to user mobility, traffic patterns, etc. This may lead to an unfair frequency resource sharing between cell-centre and cell-edge users.
B. RSS based user classification (UC-RSS) method
In [18], an alternative user classification method based on user relative RSS was proposed. With the RSS-based classification method, a user is classified as cell-centre user, if the received signal strength from the best serving cell is 3 dB higher than that received signal strength from the strongest neighbouring cell; otherwise it is classified as cell-edge user. In the following, this user classification method is abbreviated as UC-RSSαmethod.
The UC-RSS method solves the problems faced by the
UC-Dist α method when using sector antennas, but suffers from the same unfair frequency resource sharing and mobility issues.
C. Spectrum efficiency-based user classification (UC-Spe) methods
As both distance- and RSS-based methods may not be re-sponsive enough to cope with traffic fluctuations when having a fixed bandwidth partition for cell-centre and cell-edge users, we propose a spectrum efficiency-based user classification method for FFR schemes, with the following objectives:
1) To maximize spectrum efficiency of the entire network. 2) To maximize the resource allocation fairness between
cell-centre and cell-edge users.
3) To minimize the overhead, and enhance the flexibility. Within the cell-centre and cell-edge zones, various re-source partition and scheduling algorithms may be used. In the proposed user classification method, we first estimate the SIR and the throughput of users as both cell-centre and cell-edge users, and then decide which users should be classified as cell-centre and cell-edge users, by the following procedure.
Suppose there areNuser active users in sectorA1,1, and let
ΩcandΩe respectively denote the sets of centre and
cell-edge users after the prior user classification procedure com-pletes, andNc andNe respectively denote their cardinalities,
whereNuser=Nc+Ne. In order to achieve fairness, ideally
the number of users in each set should be proportional to the bandwidth of each sub-band, i.e.,
Wc
Nc
= We
Ne
, (8)
where Nc = dβNusere, as the number of users needs to be
an integer. It is noted that the users within a given group are assumed to have similar bandwidth requirements.
The proposed resource sharing criterion in (8) can be changed to achieve a given tradeoff between fair spectrum allocation and throughput with the introduction of a resource sharing control variablewc,e, which can be defined as
Wc
Nc
=wc,eWe Ne
, (9)
wherewc,e= 1 in this paper for the sake of simplicity.
Let γc,u and γe,u denote the SIRs of user uas cell-centre
the throughput that can be achieved by user u as cell-centre and cell-edge user, respectively. Moreover, let F(x)define a function to calculate the user capacity per unit of bandwidth based on the user SIR x (The proposed user classification method can work with different user capacity functions).
According to previous definitions and assuming a round robin scheduler, the user throughput as centre and cell-edge user can be calculated as
Xc,u = F(γc,u)Wc Nc , (10) Xe,u = F(γe,u)We 3Ne . (11)
Then, the site throughput can be calculated as the multipli-cation of the number of sectors (Na) and the sector throughput
from (13) Xsite = Na X u∈Ωc Xc,u+ X u∈Ωe Xe,u ! = Na " X u∈Ωc F(γc,u)Wc Nc + X u∈Ωe F(γe,u)We 3Ne # ≈ Na " W Nuser X u∈Ωc F(γc,u) + W 3Nuser X u∈Ωe F(γe,u) # (12) = NaW 3Nuser " X u∈Ωc 3F(γc,u) + X u∈Ωe F(γe,u) # . (13)
LetXc−e,ualso define a new variable referred to as
through-put difference that represents the difference betweenXc,uand
Xe,u for useru, which is calculated as
Xc−e,u=Xc,u− Xe,u. (14)
According to (13), in order to maximize Xsite, the users
with larger throughput difference should be chosen as cell-centre users with higher priority. We thus sort the set of users according to Xc−e,u for u= 1, ..., Nuser in decreasing order,
and then choose the firstNc users as cell centre-users and the
remainingNuser−Nc users as cell-edge users. As a result, we
avoid a fixed user to bandwidth mapping as in the UC-Dist
andUC-RSSmethods.
It is noted that in the above method, the actual mean SIR is used in the user throughput calculation. This method with accurate SIR is abbreviated as UC-Spe-Acc method. Algorithm 1 presents the pseudocode of the proposed UC-Spe-Acc method.
Algorithm 1User classification methodUC-Spe-Acc
Input: A set ΩU of users to be classified; Bandwidth partition coefficient β;
Output:A set Ωcofcenterusers and a setΩe ofedge user; 1 :Ωc=φ,Ωe=φ;
2: Calculate the expected number of cell-centre usersNcby (8). 3: Each useruestimatesγc,uandγe,u by measurement; 4: CalculateXc,u,Xe,u andXc−e,u foru∈ΩU; 5: Each userureportsXc−e,u to the serving BS.
6: The serving BS sortsXc−e,u (u∈ΩU) in decreasing order;
7: Add the first Nc users in the sorted set to the set of cell-centre usersΩc; add the remaining users to the set of cell-edge usersΩe. 8: Perform scheduling.
9: Return.
In order to simplify the SINR classification process, we propose an alternative user classification method in which an approximated SIR instead of an actual SIR is used. In this approximation, the RSS from the cell that generates the maximum interference to the user is used to calculate the approximated interference and SIR eγc,u and eγe,u of user u as a cell-centre and cell-edge user:
e γc,u = Pr,1,1,u Capp×max{P Na j=1Pr,i,j,u |i= 2, ..., Nsites} , (15) e γe,u = Pr,1,1,u
Capp×max{Pr,i,1,u| i= 1, ..., Nsites}
. (16)
In the above equations, the maximum single cell interference to user u is multiplied by a coefficient Capp to approximate
the overall network interference. After sampling the values in the range [1, 2.5] for coefficientCappin the studied scenarios,
we setCappto 1.5, and implement an alternative user
classifi-cation method following the procedure shown in Algorithm 1. This method with approximated SIR is abbreviated as UC-Spe-Appmethod. Note that the SIR approximation is used only in the user classification process. The actual SIR is used in the network performance evaluation by simulation and analytical approaches.
The spectrum efficiency user classification methods are viable. The core of the spectrum efficiency based user clas-sification method is on the measurement of SIR. Usually the SIR and throughput are dominated by a few close interfer-ing sectors/BSs. As specified by 3GPP UEs are required to periodically measure and report the reference signal received power from the neighbour cells for cell search and hand over purposes [1], they are readily available for the user classification process. The time resolution of the proposed classification method can be set as that used for user handover.
IV. ANALYTICALPERFORMANCEMODEL FOR FRACTIONALFREQUENCYREUSESCHEMES As indicated in Section II, we focus our analysis on the performance of users associated with sector A1,1, based on
which the overall network performance can be calculated. With the above user classification strategies, a user located anywhere within the service area of sectorA1,1can be classified as
cell-centre or cell-edge user.
In this section, we first derive a statistical model for deriving the SIR distribution of an individual userulocated at(xu, yu)
as a cell-centre user as well as a cell-edge user. With this model for individual users, we then calculate network performance in terms of network throughput and outage probabilities for different FFR schemes.
A. SIR distribution for a cell-centre user
As an IFR-1 scheme is applied in the cell-centre sub-band, a cell-centre user within sectorA1,1is subject to interference
from the sectors of BS 1 other than sector 1 as well as all sectors of all neighbouring cells. Therefore, for a cell-centre user uof sectorA1,1, we have the following expressions for
the sets of IDs of intra-site and inter-site interfering sectors
ΩIntra,u={j|2≤j≤Na}, (17)
ΩInter,u={j|1≤j ≤Na}. (18)
According to (7), the SIRγc,u of useruwithin sectorA1,1
as a cell-centre user can be calculated as
γc,u = Pr,1,1,uψ1,u P j∈ΩIntra,u Pr,1,j,uψ1,u+ Nsites P i=2 P j∈ΩInter,u Pr,i,j,uψi,u = Pr,1,1,uψ1,u Nsites P i=1 Ic,i,u , (19)
whereIc,i,u is the sum of the interference generated from the
different sectors of the ith BS to useru, i.e.,
Ic,i,u= P j∈ΩIntra,u Pr,1,j,uψ1,u, i= 1, P j∈ΩInter,u
Pr,i,j,uψi,u, i= 2, ..., Nsites.
(20)
Note thatIc,i,u is a log-normal RV as it has been assumed
that the shadow fading within sectors of a site is fully correlated in Section II.
Let µIc,i,u and σIc,i,u denote the mean and the standard deviation of the normal distribution associated with Ic,i,u,
respectively, which can be calculated by
µIc,i,u = ln Na P j=2 Pr,i,j,u ! i= 1, ln Na P j=1 Pr,i,j,u ! i= 2, ..., Nsites, (21) and σIc,i,u=σw. (22)
Let us also define two new variables.Y1,c,u=
PNa
j=2Pr,1,j,u Pr,1,1,u , andYsum,c,u, which is the interference from neighbouring cells
to signal ratio for cell-centre user u, i.e.,
Ysum,c,u=
Isum,c,u
Su
, (23)
whereIsum,c,uis the sum of the interference from the
neigh-bouring cells to cell-centre user u, and can be calculated as
Isum,c,u=P Nsites
i=2 Ic,i,u. It is important to note thatY1,c,u is
a deterministic variable, while Ysum,c,u is a RV.
Based on these two variables, the SIR γc,u for cell-centre
user uwithin sector A1,1 can be expressed as
γc,u=
1 Y1,c,u+Ysum,c,u
. (24)
In order to calculate the mean of γc,u, the sum of the
interferenceIsum,c,uof theNsites−1correlated neighbouring
cells to useruis approximated by another log-normal variable, where µIsum,c,u and σIsum,c,u denote the mean and standard deviation of the normal distribution associated with the log-normal approximation Isum,c,u, respectively. Then, we can
apply the method used in [26] to calculate the sum power of correlated log-normal RVs. The method has a lower complex-ity and still an acceptable accuracy compared to several other approximation methods [27]–[29]. According to such method,
µIsum,c,u can be calculated as
µIsum,c,u= log Nsites X i=1 eµIc,i,u+0.5σ 2 Ic,i,u ! −σ 2 Ic,i,u 2 , (25)
andσIsum,c,u can be calculated using (26).
σ2Isum,c,u = log " 1 + PARTA + PARTB Nsites X i=2 eµ 2 Ic,i,u+0.5σ 2 Ic,i,u 2 # , (26) PARTA ≡ Nsites X i=2 (eσ 2
Ic,i,u −1)e2µIc,i,u+σ
2 Ic,i,u, PARTB ≡ 2 Nsites−1 X i=2 Nsites X j=i+1
eµIc,i,u+0.5σI2c,i,ueµIc,j,u+0.5σ
2
Ic,j,u(eρσIc,i,uσIc,j,u −1).
With the approximation ofIsum,c,uas a log-normal variable
and becauseSu is also a log-normal variable,Ysum,c,uin the
form of (23) is also known to be a log-normal variable, where
µYsum,c,u and σYsum,c,u denote the mean and standard devia-tion of the normal distribudevia-tion associated with the lognormal variableYsum,c,u, respectively.
AsIsum,c,uandSuare correlated, letρIsum,S,c,udenote the correlation coefficient betweenIsum,c,uandSu. Then, we can
write that
µYsum,c,u=µIsum,c,u−ln(Pr,1,1,u), (27) σ2Y sum,c,u=σ 2 Isum,c,u+σ 2 w−2ρsum,1,c,uσIsum,c,uσw. (28) In this case, the only unknown variable to calculateµYsum,c,u
andσYsum,c,u isρIsum,S,c,u. We can use the method proposed
in [33] to calculateρsum,S,c,u ρIsum,S,c,u= 2[ln(ν)−(µIsum,c,u−µSu)]−(σ2 Isum,c,u+σ 2 w) 2σIsum,c,uσw , (29) ν = Nsites X i=2 eµSu+µIc,i,u+0.5(σ 2 w+σ2Isum,c,u+2ρσwσIsum,c,u). (30) After we have calculated the mean µYsum,c,u and standard deviation σYsum,c,u of the normal distribution associated with log-normal variable Ysum,c,u, the probability density function
of γc,u given by (24) can be determined accordingly. It is
noted that for a general log-normally distributed RVX, with parametersµXandσXbeing the mean and standard deviation of X’s natural logarithm, the probability density function (denoted by fX(x;µX, σX)) ofX can be expressed as
fX(x;µX, σX) = 1 xσX √ 2πe −(lnx−µX)2 2σ2 . (31)
Then, the mean ofγc,udenoted byγc,ufor cell-centre user ucan be calculated as γc,u = ∞ Z 0 1 (Y1,c,u+y)(yσYsum,c,u √ 2π)e −[ln(y)−µYsum,c,u]2 2σ2 Ysum,c,u (32)dy,
where γc,u can be obtained by simple numerical integration
tools according to (32).
Based on the previous derivations, the throughput Xc,u
that can be achieved by user u as a cell-centre user can be calculated by (10).
a) Outage probability: Let us now define outage proba-bility as the probaproba-bility that the instantaneous SIR of a user is less than a given threshold. Then, the outage probability Oc,u,γthr for a cell-centre user uwith a given SIR threshold
γthr can be calculated as Oc,u,γthr = Prob(γc,u< γthr) = Prob( 1 Y1,c,u+ Ysum,c,u < γthr) = ∞ Z Ythr,c,u 1 yσYsum,c,u √ 2πe −[ln(y)−µYsum,c,u]2 2σ2 Ysum,c,u dy = 1−Φ(ln(Ythr,c,u)−µYsum,c,u σYsum,c,u ), (33) where Ythr,c,u = γ1
thr −Y1,c,u and Φ(x) is the cumulative distribution function of the standard normal distribution.
B. SIR distribution for a cell-edge user
As an IFR-3 scheme is applied in the cell-edge sub-band, a cell-edge user within sector A1,1 is subject to interference
from a subset of sectors. Therefore, for a cell-edge user uof sectorA1,1, we have the following expressions for the sets of
IDs of intra-site and inter-site interfering sectors
ΩIntra,u={j|j= 3k+ 1,1≤k≤ b Na 3 c}, (34) ΩInter,u={j|j = 3k+ 1,0≤k≤ b Na 3 c}. (35)
Let γe,u denote the SIR of useruas a cell-edge user, and Ie,i,u denote the sum of the interference generated from the
different sectors of the ith BS to user u. It is important to note that apart from the expressions of the sets of IDs of the intra-site and inter-site interfering sectors for cell-centre and cell-edge users, the expressions of SIRγe,uandIe,i,u for
cell-edge users are the same as (19) and (20) for cell-centre users, respectively. Therefore, the same approach to compute the user SIR and other relevant performance metrics for cell-centre users can be readily applied for cell-edge users.
With Na < 4, the calculation of SIR γe,u of user u as a
cell-edge user can be simplified as
γe,u = Pr,1,1,uψ1,u Nsites P i=2 Pr,i,1,uψi,u = P1,1,u Nsites P i=2 Ie,i,u , (36)
whereIe,i,u is calculated as
Ie,i,u=Pr,i,1,uψi,u. (37)
µIe,i,u andσIe,i,u are the mean and standard deviation of the normal distribution associated with the log-normal variable
Ie,i,u, which are calculated as
µIe,i,u= ln Na X j=1 Pr,i,j,u , i= 2, ..., Nsites. (38) and σIe,i,u =σw. (39)
Let us now define Ysum,e,u as the sum interference from
neighbouring cells to signal ratio for cell-edge useru, i.e.,
Ysum,e,u= Isum,e,u Su = 1 γe,u , (40)
whereIsum,e,u is the sum of the interference from the
neigh-bouring cells to cell-edge user u, and can be calculated as
Isum,e,u = P Nsites
i=2 Ie,i,u. Then, as for cell-centre users in
the previous subsection, Isum,e,u can be approximated by a
log-normal RV whereµIsum,e,u andσIsum,e,u denote the mean and standard deviation of the normal distribution assocaited withIsum,e,u, respectively, which can be determined using the
same approach as for determining (25) and (26), respectively, With the approximation of Isum,e,u as a log-normal RV
and because Su is also a log-normal RV, Ysum,e,u and γe,u
are also known to be log-normal RVs. Let µYsum,e,u and σYsum,e,udenote the mean and standard deviation of the normal distribution associated withYsum,e,u, respectively, which can
be determined using the same approach as for determining (29) and (30), respectively.
Letµγe,u andσγe,u denote the mean and standard deviation of the normal distribution associated with the log-normal RV
γe,u. According to the properties of the log-normal RVs, we
can write thatµγe,u=−µYsum,e,u andσγe,u=σYsum,e,u. Then, the mean of γe,udenoted by γe,ufor cell-edge user ucan be
calculated as
γe,u= e
µγe,u+σ2γe,u/2. (41)
Based on the previous derivations, the throughputXe,uthat
can be achieved by useruas cell-edge user can be calculated using (11).
a) Outage probability: The outage probability Oe,u,γthr for a cell-edge useruwith a given SIR thresholdγthr can be
calculated as Oe,u,γthr = P rob(γe,u< γthr) = γthr Z 0 1 yσγe,u √ 2πe −[ln(y)−µγe,u]2 2σ2 γe,u dy = Φ ln(γ thr)−µγe,u σγe,u , (42)
where Φ(x) is the cumulative distribution function of the standard normal distribution.
C. System-level performance analysis
Due to the symmetry of the sector structure and the full load traffic assumption, it is expected that all sectors have very similar performances. Therefore, the analysis of a repre-sentative sector (say sectorA1,1) is sufficient for system-level
performance analysis.
In order to facilitate the analytical evaluation of the system-level performance, the whole sector A1,1 service area is
divided into segments with equal size of dres×dres m2 by
equally spaced horizontal and vertical lines. It is noted that the segmentation approach is only applied to the analytical model for theoretic analysis purpose. In the simulations, the users are randomly distributed following a uniform distribution. The segments are given IDs(k, l),kdenoting the row number and
l denoting the column number associated with the segments. Segment (0,0) corresponds to the top left segment. Let each segment with ID (k, l) be represented by its centre point (denoted byMk,l), which has a locationLMk,l. For modelling purpose, the users are randomly located at the centres of the segments with uniform distribution, and are associated to only one sector according to their received signal strength. For simplicity, we have assumed that users are uniformly distributed in the network, but the model can work with any other user distribution.
Let us recall that Ωc andΩe denote the sets of cell-centre
and cell-edge users in sector A1,1, respectively, where Nc
andNe denote their cardinality, respectively. As the locations
of users in sector A1,1 are known, the sets Ωc and Ωe can
be determined according to the user classification methods described in Section III. Specifically for the traditional IFR-1 scheme Ωe =φandNe = 0, while for the traditional IFR-3
scheme Ωc =φand Nc = 0. Then, we can approximate the
system-level performance as follows.
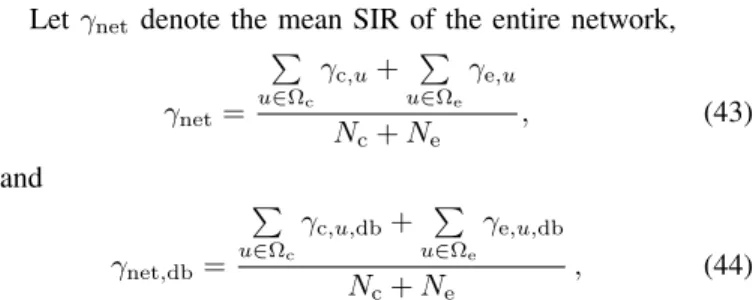
Let γnet denote the mean SIR of the entire network,
γnet= P u∈Ωc γc,u+ P u∈Ωe γe,u Nc+Ne , (43) and γnet,db= P u∈Ωc γc,u,db+ P u∈Ωe γe,u,db Nc+Ne , (44)
where γc,u and γe,u are computed by (19) and (36),
respec-tively.
Similarly, we can calculate the site throughputXsiteby (13)
and the outage probabilityOnet,γthrof the entire network with respect to a SIR outage threshold γthr by
Onet,γthr= P u∈Ωc Oc,u,γthr+ P u∈Ωe Oe,u,γthr Nc+Ne . (45) V. NUMERICALRESULTS A. System configurations
In total, twelve system configurations presented in Table II with 3, 6 and 12 sectors per BS are evaluated and com-pared, using the proposed analytical model as well as system-level simulations. Analytical results are obtained using Matlab
numerical tools, where simulation results are averaged over 2000 simulations runs. The corresponding bandwidth partition coefficientβ was set to 0.5, unless stated otherwise, meaning that cell-centre users benefit from 50% of the bandwidth. Table III presents the most relevant system parameters.
In the simulations, the users are uniformly distributed within the coverage area of sectorA1,1. The user density used in the
simulations is 0.0025 active user per square meter.
For the numerical evaluation, we use a spectral efficiency function F(x) which approximates an abstracted LTE link level model from the Vienna LTE link level Simulator [34], with 2x2 antenna mode, open loop spatial multiplexing (OLSM) and adaptive modulation and coding (AMC). The original LTE link-level model (presented in Fig. 9 of [34]) mapping channel SNR (dB) to spectral efficiency (bps/Hz) is approximated by the following spectral efficiency function:
F(x) = 7, x >40 dB 6 P i=0 cixi, −10≤x≤15 dB 0 x <−10 dB, (46)
where the function input xcorresponds to SIR value in dB, and the polynomial coefficientsci are determined by a Matlab curve fitting tool as 0.5935, 0.09151, 0.001567, 0.0001185, 1.8e-05, 1.0e-06, 1.3e-08, fori= 0,1, ...,6, respectively. The analytical model can be applied to work with other abstracted link level models.
B. Network performance
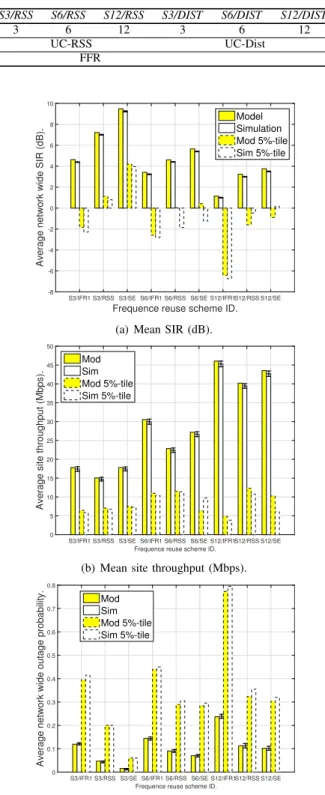
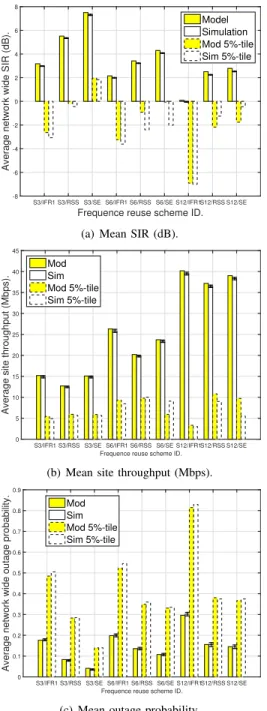
Figures 3 and Figures 4 show the network performance in terms of mean user SIR, mean site throughput and mean out-age probability, against the various presented system configu-rations forRISD= 500m andRISD= 1000m, respectively. In
the figure, the 5%-tile site throughput performance is shown. The 95% confidence intervals for mean user SIR, mean site throughput and mean outage probability are also presented. From these results, it can be observed that analytical results closely match system-level simulation results. In more detail, the average difference between analytical and system-level simulation results is less than 5%. This fact shows the accuracy of our proposed analytical model, one of the main contribution of this paper. This accuracy enables the use of this analytical tool as an effective method to predict network performance in a fast and reliable manner. For example, optimization tools that attempt to find a proper antenna orientation and downtilt in HOS deployments can use the proposed analytical model to quickly search over different candidate configurations and find the best performing one.
Table IV and Table V provide more detailed information about the mean site throughput and mean outage probability for the different system configurations, indicating the relative performance gains with respect to S3/IFR1. In Tables IV and V, the rows with labels ‘Mod’ and ‘Sim’ correspond to the results with path loss and shadowing fading only (modelled and simulated, respectively); while the rows with labels ’Sim-Small’ correspond to the results with path loss, shadowing fading and fast fading (simulated). The fast fading follows
TABLE II
SYSTEM CONFIGURATION NAMES AND DETAILS
Config. S3/IFR1 S6/IFR1 S12/IFR1 S3/SE S6/SE S12/SE S3/RSS S6/RSS S12/RSS S3/DIST S6/DIST S12/DIST
#. sectors 3 6 12 3 6 12 3 6 12 3 6 12
Classifica. N/A UC-Spe UC-RSS UC-Dist
Reuse IFR-1 FFR TABLE III SYSTEM SETTINGS Parameters Value Carrier frequency 2000 MHz Bandwidth 5 MHz
Number of sites Nsites= 19
Inter-site distance RISD= 500m, 1000 m
Number of sectors Na= 3, 6, 12
Transmit power 21.6 W Shadowing standard deviation 6 dB Shadow correlation ρ= 0.5
Antenna height 25 m
Max antenna gain (dBi) 15.5/19.8/22 (3/6/12 sec.) Antenna front to back ratio 25 dB
Horizontal HPBWϑ3dB 65°/ 33°/ 17° (3/6/12 sec.)
Antenna mode 2x2 antennas
Vertical HPBWθ3dB 11.5°/ 8.5°/ 8.5° (3/6/12 sec.)
Segment resolutiondres 10 m
Antenna downtiltθdown 10.38°/ 8.28°/ 8.28° (3/6/12 sec.)
User density (simulation) 0.0025 perm2
Outage thresholdγthr −5dB
Bandwidth partition coefficientβ [0, 0.1, ...,1]
a Rayleigh distribution with scale parameter set to 2/√π
to have a mean value of 1 for the Rayleigh distribution. It can be observed that there is a small difference between the throughput results obtained without and with fast fading under the investigated system settings, mainly due to the averaging over a large number of snapshots. There is a small increase in outage probability when fast fading is considered. As the fast fading impact is negligible in this scenario, fast fading is not considered in the simulations in the remaining of the paper.
Moreover, it is noted that mean deviation of mean site throughputs with UC-Spe-AccandUC-Spe-App methods was less than 1.4 % indicating that our approximation is accurate. As a consequence, results with UC-Spe-Acc method are not shown in this section for the sake of space.
a) Impact of the number of sectors per BS on system performance: If we compare the configurations with 3, 6 and 12 sectors per BS, it can be observed from Fig. 3 that:
• Average network SIR decreases with increasing number of sectors per BS. This is due to the larger inter-cell interference introduced by more sectors per BS.
• Average site throughput increases with increasing number of sectors per BS. This is due to the lager spatial reuse introduced by more sectors per BS, which outweighs the SIR decrease.
However, it is important to note that doubling the number of sectors per BS does not double the site throughput. Indeed, when we move from S3/IFR1 to S6/IFR1, the average site throughput increases by 71 %, while when we move from
S6/IFR1 to S12/IFR1, the average site throughput increases by 50 % (see Table IV for detail analysis of average site throughput gains). This indicates that there is a diminishing
Frequence reuse scheme ID. S3/IFR1 S3/RSS S3/SE S6/IFR1 S6/RSS S6/SE S12/IFR1S12/RSS S12/SE
Average network wide SIR (dB).
-8 -6 -4 -2 0 2 4 6 8 10 Model Simulation Mod 5%-tile Sim 5%-tile
(a) Mean SIR (dB).
Frequence reuse scheme ID.
S3/IFR1 S3/RSS S3/SE S6/IFR1 S6/RSS S6/SE S12/IFR1S12/RSS S12/SE
Average site throughput (Mbps).
0 5 10 15 20 25 30 35 40 45 50 Mod Sim Mod 5%-tile Sim 5%-tile
(b) Mean site throughput (Mbps).
Frequence reuse scheme ID.
S3/IFR1 S3/RSS S3/SE S6/IFR1 S6/RSS S6/SE S12/IFR1S12/RSS S12/SE
Average network wide outage probability.
0 0.1 0.2 0.3 0.4 0.5 0.6 0.7 0.8 Mod Sim Mod 5%-tile Sim 5%-tile
(c) Mean outage probability.
Fig. 3. Network wide performances with RISD = 500 m, bandwidth
coefficientβ=0.5.
performance gain with the increasing number of sectors per BS due to interference, and adding more sectors per BS may not always increase the average network throughput in a cost effective manner. Similar trends are observed for Fig. 4 with
RISD = 1000m, and the other user classification methods.
TABLE IV
MEAN SITE THROUGHPUT AND GAIN OVERS3/IFR1 Setting Throughput (Mbps) and gains overS3/IFR1(%)
RISD/β S3/IFR1 S3/RSS S3/SE S6/IFR1 S6/RSS S6/SE S12/IFR1 S12/RSS S12/SE
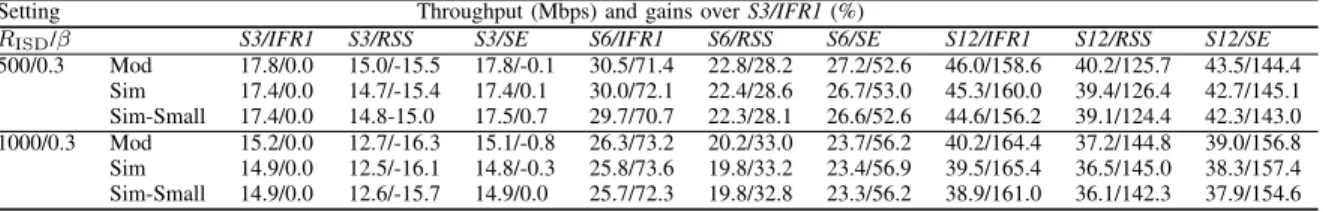
500/0.3 Mod 17.8/0.0 15.0/-15.5 17.8/-0.1 30.5/71.4 22.8/28.2 27.2/52.6 46.0/158.6 40.2/125.7 43.5/144.4 Sim 17.4/0.0 14.7/-15.4 17.4/0.1 30.0/72.1 22.4/28.6 26.7/53.0 45.3/160.0 39.4/126.4 42.7/145.1 Sim-Small 17.4/0.0 14.8-15.0 17.5/0.7 29.7/70.7 22.3/28.1 26.6/52.6 44.6/156.2 39.1/124.4 42.3/143.0 1000/0.3 Mod 15.2/0.0 12.7/-16.3 15.1/-0.8 26.3/73.2 20.2/33.0 23.7/56.2 40.2/164.4 37.2/144.8 39.0/156.8 Sim 14.9/0.0 12.5/-16.1 14.8/-0.3 25.8/73.6 19.8/33.2 23.4/56.9 39.5/165.4 36.5/145.0 38.3/157.4 Sim-Small 14.9/0.0 12.6/-15.7 14.9/0.0 25.7/72.3 19.8/32.8 23.3/56.2 38.9/161.0 36.1/142.3 37.9/154.6 TABLE V
MEAN OUTAGE PROBABILITY AND GAIN OVERS3/IFR1 Setting Outage probability and gains overS3/IFR1(%)
RISD/β S3/IFR1 S3/RSS S3/SE S6/IFR1 S6/RSS S6/SE S12/IFR1 S12/RSS S12/SE
500/0.3 Mod 0.12/0.0 0.05/-60.6 0.02/-87.0 0.14/21.2 0.09/-24.4 0.07/-41.2 0.24/98.7 0.11/-5.4 0.10/-14.3 Sim 0.12/0.0 0.04/-64.0 0.01/-89.5 0.14/18.9 0.09/-25.4 0.07/-42.0 0.24/97.6 0.11/-6.6 0.10/-15.5 Sim-Small 0.16/0.00 0.08/-52.04 0.03/-78.96 0.18/16.23 0.09/-42.34 0.07/-55.19 0.27/73.71 0.11/-27.87 0.10/-34.70 1000/0.3 Mod 0.18/0.0 0.08/-52.8 0.04/-76.6 0.20/12.5 0.14/-22.8 0.11/-39.0 0.30/68.0 0.16/-11.9 0.15/-17.7 Sim 0.18/0.0 0.08/-55.7 0.04/-80.1 0.20/11.7 0.14/-23.8 0.11/-39.7 0.30/69.1 0.16/-12.9 0.15/-18.7 Sim-Small 0.22/0.00 0.12/-44.83 0.07/-68.16 0.24/9.75 0.14/-37.83 0.11/-50.83 0.33/51.89 0.16/-28.97 0.15/-33.71
which can be an important solution to the above problem by achieving linear throughput gains while maintaining relatively low outage probability.
b) Impact of user classification methods on system per-formance: If we compare the configurations with different user classification methods, it can also be observed from Fig. 3 that: • Due to the lack of inter-cell interference coordination,
IFR1 provides the worst mean and 5%tile SIR per-formance, which translates to the largest mean outage probability. Indeed, IFR1 results in a high mean outage probability of 12% for the 3 sector case and 24% for the 12 sector case. As a note, it is interesting to observe that IFR1 outperforms RSS in terms of mean average throughput. This is because the mean throughput ofIFR1
is driven by its cell-centre users, which benefit from the larger available bandwidth in IFR1 than in RSS. However, the better inter-cell interference coordination of RSS results in a better 5%-tile throughput.
• Due to inter-cell interference coordination and the en-hanced user classification method, SE provides the best mean and 5%tile SIR performance, which is translated into the lowest mean outage probability.SEdecreases the mean outage probability with respect to RSS by around 73% for the 3 sector case and 22% for the 6 sector case. This shows the better fairness of the proposed user classification method. In SE, all users receive the same amount of bandwidth regardless of their positions, and as a by-product more users are classified as cell-edge users and thus benefit from inter-cell interference coordination. In terms of mean average throughput, SE significantly outperformsRSSwith gains of 19% for both 3 sector and 6 sector cases, at the expense of some slight degradation on 5%-tile throughput for the 6 and 12 sector cases. As mentioned before, since more users are classified as cell-edge users, the outage probability decreases, but also the 5%-tile throughput. Note that this trade-offs can be controlled by using the bandwidth partition coefficientβ, as it is shown in the next section.
The different system configurations with RISD = 1000m
follow the same trends, as shown in Fig. 4.
C. Impact of bandwidth partition on FFR performances
In the following, a study is performed to assess how the different system configurations may perform under different bandwidth partitions to cell-centre and cell-edge users. In order to do this, the bandwidth partition coefficient β is varied between 0 and 1 with a step size of 0.1, and the corresponding site throughput and resource allocation fairness are calculated. The widely used Jain’s fairness index is used to measure the resource allocation fairness [35]. Assume that there areNc
cell-centre users andNecell-edge users after running the user
classification method, which have been allocated a bandwidth
βWall and (1−β)Wall, respectively, and that the available
bandwidth in each band is equally shared among the existing users (i.e., round robin). Then, the resource allocation fairness can be calculated using Jain’s fairness index [35].ζ(β)can be calculated as: ζ(β) = N cβWall Nc +Ne(1−β)Wall Ne 2 (Nc+Ne) ( Nc βW all Nc 2 +Ne (1−β)W all Ne 2) = 1 (Nc+Ne) β2 Nc +(1−β) 2 Ne . (47)
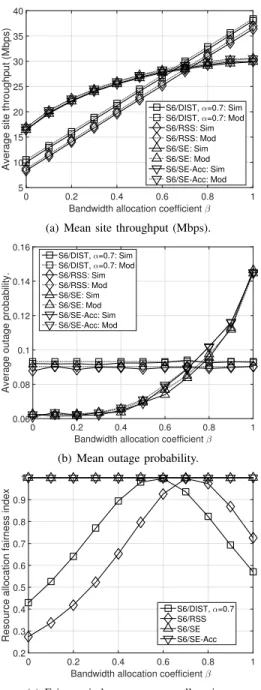
For this setup, Fig. 5(a) shows the site throughput resulting from system configurationS6/DISTwithα=0.7,S6/RSS,S6/SE
and S6/SE-Acc, against the bandwidth partition coefficientβ
for RISD = 500 m. Figure 5(b) presents the corresponding
outage probability, while Fig. 5(c) presents the corresponding resource allocation Jain’s fairness index. Both simulation and analytical results are presented for site throughput and outage probability, while only simulation results are presented for the fairness index for readability.
Frequence reuse scheme ID. S3/IFR1 S3/RSS S3/SE S6/IFR1 S6/RSS S6/SE S12/IFR1S12/RSS S12/SE
Average network wide SIR (dB).
-8 -6 -4 -2 0 2 4 6 8 Model Simulation Mod 5%-tile Sim 5%-tile
(a) Mean SIR (dB).
Frequence reuse scheme ID.
S3/IFR1 S3/RSS S3/SE S6/IFR1 S6/RSS S6/SE S12/IFR1S12/RSS S12/SE
Average site throughput (Mbps).
0 5 10 15 20 25 30 35 40 45 Mod Sim Mod 5%-tile Sim 5%-tile
(b) Mean site throughput (Mbps).
Frequence reuse scheme ID.
S3/IFR1 S3/RSS S3/SE S6/IFR1 S6/RSS S6/SE S12/IFR1S12/RSS S12/SE
Average network wide outage probability.
0 0.1 0.2 0.3 0.4 0.5 0.6 0.7 0.8 0.9 Mod Sim Mod 5%-tile Sim 5%-tile
(c) Mean outage probability.
Fig. 4. Network wide performances with RISD = 1000 m, bandwidth
coefficientβ=0.5.
First of all, it is important to note again that the analytical results closely match system-level simulation results, which demonstrates the accuracy of our analytical model.
In terms of the study, it is noted that S6/SE achieves the highest possible fairness index value for all bandwidth partition coefficientsβ, meaning that all users receive the same amount of bandwidth regardless of their positions and the bandwidth partition coefficient. This mitigates the impact of the user distribution and dynamics on the system performance. This was a design objective, which translates to a fairly comparable site throughput for all values ofβ. In more detail,
S6/SE maintains a relatively high network throughput, which monotonically and slowly increases with β. Looking at the extreme cases, if β = 0, all the bandwidth is cell-edge
bandwidth and all users are classified as cell-edge users. Thus the system suffers from resource muting. If β =1, all the bandwidth is cell-centre bandwidth and all users are classified as cell-centre users. Thus the system suffers from inter-cell interference. According to our results, β = 0.5 is a good operation point for this scenario, with close to the highest throughput and lowest outage probability.
In contrast, for S6/DIST and S6/RSS, since user classifi-cation is fixed and does not depend on β (but on distances and received signal strength, respectively), the fairness index significantly varies withβ. As a result, all users do not always receive the same amount of bandwidth in the scenario, and thus the user distribution and dynamics as well as the bandwidth partition have a significant impact on system performance. For example, with regard to user distribution, if at a given point in time there are no cell-edge users according to the
S6/DISTandS6/RSSuser classification methods, the cell-edge bandwidth would be unused. This is inefficient and does not occur with SE, which has the capability to classify a user as cell-centre or cell-edge user on the fly according to traffic conditions. With regard to bandwidth partitioning, it is also important to note that forS6/DIST andS6/RSS, as a result of the fix user classification, the larger theβ, the more resources are allocated to cell-centre users, and thus the larger is the resulting site throughput at the expense of a decreased cell-edge performance. As a result, the site throughputs ofS6/DIST
andS6/RSSmonotonically increase with β, at the expense of fairness. It is important to note that withβ= 0.6 the fairness indices of S6/RSS and S6/DIST are close to 1, and the site throughput ofS6/RSSandS6/DISTare similar to that ofS6/SE. However, the outage probabilities ofS6/RSSandS6/DISTare much higher.
VI. CONCLUSION
In this paper, HOS deployments have been considered as a cost-effective approach to improve network capacity, and their performances have been analysed in detail. Towards this objective, a novel statistical model has been presented to theoretically characterize the HOS deployment performance in conjunction with a strict FFR scheme in terms of user signal quality, site throughput and outage probability. Moreover, we have considered the impact of different user classification methods in the FFR scheme, and proposed a new spectrum efficiency-based user classification method that improves re-source utilization and allocation fairness. It is important to note that the proposed statistical model can be easily extended to work with different BS placements and user distribution, as well as scheduling techniques. Our studies show that the aver-age difference between analytical and system-level simulation results are less than 5% in terms of mean user SIR, mean site throughput, and mean outage probability, indicating a good accuracy of the proposed analytical model. In terms of mean site throughput, HSO provide a diminishing gain with the number of antennas due to inter-cell interference. Performance results also show that the proposed user classification method,
SE, outperforms the RSS method with gain of 19% for both 3-sectors and 6-sectors cases. Moreover, it decreases outage
Bandwidth allocation coefficient β
0 0.2 0.4 0.6 0.8 1
Average site throughput (Mbps)
5 10 15 20 25 30 35 40 S6/DIST, α=0.7: Sim S6/DIST, α=0.7: Mod S6/RSS: Sim S6/RSS: Mod S6/SE: Sim S6/SE: Mod S6/SE-Acc: Sim S6/SE-Acc: Mod
(a) Mean site throughput (Mbps).
Bandwidth allocation coefficient β 0 0.2 0.4 0.6 0.8 1
Average outage probability.
0.06 0.08 0.1 0.12 0.14 0.16 S6/DIST, α=0.7: Sim S6/DIST, α=0.7: Mod S6/RSS: Sim S6/RSS: Mod S6/SE: Sim S6/SE: Mod S6/SE-Acc: Sim S6/SE-Acc: Mod
(b) Mean outage probability.
Bandwidth allocation coefficient β
0 0.2 0.4 0.6 0.8 1
Resource allocation fairness index
0.2 0.3 0.4 0.5 0.6 0.7 0.8 0.9 1 S6/DIST, α=0.7 S6/RSS S6/SE S6/SE-Acc
(c) Fairness index on resource allocation.
Fig. 5. Network performance against bandwidth partition coefficient with
RISD= 500m.
probability with respect to the RSS method by around 73% for the 3 sector case and 22% for the 6 sector case. In the future, we are interested in investigating other FFR schemes and interference coordination schemes to HOS deployments. In addition we are interested in the investigation on the combination of azimuth and vertical sectorization to find out efficient settings to improve network performance.
ACKNOWLEDGEMENT
The authors would like to thank the anonymous reviewers for their constructive comments, which helped improve the quality of this paper.
REFERENCES
[1] H. Holma and A. Toskala, “LTE for UMTS: evolution to LTE-Advanced,”John Wiley & Sons Ltd, 20011.
[2] C. Wang et al, “Cellular architecture and key technologies for 5G wireless communication networks,” IEEE Commun. Mag., Vol. 52, No. 2, pp.122-130, Feb. 2014.
[3] N. Leeet al, “Spectral efficiency of dynamic coordinated beamforming: a stochastic geometry approach,” IEEE Trans. Wireless Commun., Vol. 14, No. 1, pp. 230-241, Jan. 2015.
[4] A.S. Hamzaet al, “A survey on inter-cell interference coordination tech-niques in OFDMA-based cellular networks,”IEEE Commun. Surveys & Tutorials, Vol. 15, No. 4, pp. 1642-1670, 2013.
[5] X. Zhang, M. Haenggi, “A Stochastic Geometry analysis of inter-cell interference coordination and intra-cell diversity,”IEEE Trans. Wireless Commun., Vol. 13, No. 12, pp. 6655-6669, Dec. 2014.
[6] 3GPP TR 36.814 V9.0.0, “Further advancements for E-UTRA physical layer aspects,” Technical Report, March 2010.
[7] J. Ylitalo and E. Tiirola “Performance evaluation of different antenna array approaches for 3G CDMA uplink,”in Proc. IEEE VTC’00, 2000. [8] B. Hagermanet al, “WCDMA 6-sector deployment- case study of a real
installed UMTS-FDD network,”in Proc. of IEEE VTC’06, 2006. [9] A. Osseiran and A. Logothetis, “Smart antennas in a WCDMA radio
network system: modeling and evaluations,”IEEE Trans. Antennas and Propagation, Vol. 54, No. 11, pp. 3302-3316, Nov. 2006.
[10] A. Osseiran, P. Skillermark and M. Olsson, “Multi-antenna SDMA in OFDM radio networks systems: modeling and evaluations,”in Proc. of IEEE PIMRC’07, 2007.
[11] H. Huanget al, “Increasing downlink cellular throughput with limited network MIMO coordination,” IEEE Trans. Wireless Commun., Vol. 8, No. 6, pp. 2983-2989, June 2009.
[12] H. Huanget al, “Increasing throughput in cellular networks with higher-order sectorization,” in Proc. Asilomar’10, 2010
[13] I. Riedel and G. Fettweis, “Increasing throughput and fairness in the downlink of cellular systems with N-fold sectorization,” in Proc. of IEEE GlobeCom’11, 2011.
[14] R. Joyce and L. Zhang, “Higher order horizontal sectorisation gains for a real 3GPP/HSPA+ network,” in Proc. of European Wireless, 2013. [15] W. Guo and T. O’Farrell, “Dynamic cell expansion with self-organizing
cooperation ”, IEEE Journal on Selected Areas in Commun., Vol.31, No. 5, pp. 851-860, April 2013.
[16] M. Sheikh,, and J. Lempiinen, “A flower tessellation for simulation purpose of cellular network with 12-sector sites,” IEEE Wireless Commun. Lett., Vol. 2, No. 3, pp. 279-282, June 2013.
[17] H. Claussen, “Efficient modelling of channel maps with correlated shadow fading in mobile radio systems,” in Proc. of IEEE PIMRC’05, September 2005.
[18] D. Lopez-Perez, H. Claussen, L. Ho, “Improved frequency reuse schemes with horizontal sector offset for LTE,” in Proc. of IEEE PIMRC’13, 2013.
[19] S. Ali, V. Leung, “Dynamic frequency allocation in fractional frequency reused OFDMA networks,” IEEE Trans. Wireless Commun., Vol. 8, No. 8, pp. 4286-4295, 2009.
[20] T. Novlan, R. Ganti, A. Ghosh, J. Andrews “Analytical evaluation of fractional frequency reuse for OFDMA cellular networks,”IEEE Trans. Wireless Commun., Vol. 10, No. 12, pp. 4294-4305, 2011.
[21] L. Chenet al, “System-level simulation methodology and platform for mobile cellular systems,” IEEE Commun. Mag., Vol. 49, No. 7, 2011. [22] F. Baccelli, A. Giovanidis, “A stochastic geometry framework for
analyzing pairwise-cooperative cellular networks,”IEEE Trans. Wireless Commun., Vol. 14, No. 2, pp. 794-808, Feb. 2015.
[23] T. Bai, R.W. Heath, “Coverage and rate analysis for millimeter-wave cellular networks,” IEEE Trans. Wireless Commun., Vol. 14, No. 2, pp. 1100-1114, Feb. 2015.
[24] L. Fenton, “The sum of log-normal probability distributions in scatter transmission systems,”IEEE Trans. Commun., Vol. 8, No. 1, pp. 57-67, March 1960.
[25] N. B. Mehta, A. F. Molisch, J. Wu and J. Zhang, ”Approximating the sum of sorrelated Lognormal or, Lognormal-Rice random variables,” In Proc. IEEE ICC’06, pp. 1605-1610, 2006,
[26] A. Safak, “Statistical analysis of the power sum of multiple correlated log-normal components,”IEEE Trans. Veh. Technol., Vol. 42, No. 1, pp. 58-61, Feb. 1993.
[27] S. Schwartz and Y. Yeh, “On the distribution function and moments of power sums with lognormal components,” Bell System Technology Journal, Vol. 61, No. 7, pp. 1441-1462, September 1982.
[28] A. Abu-Dayya and N. Beaulieu, “Outage probabilities in the presence of correlated lognormal interferers,IEEE Trans. Veh. Technol., Vol. 43, No. 1, pp. 164-173, Feb. 1994.
[29] N. Mehta, J. Wu, A. Molisch, J. Zhang “Approximating a sum of random variables with a Lognormal,” IEEE Trans. Wireless Commun., Vol. 6, No. 7, pp. 2690-2699, July 2007.
[30] T. Bonald and A. Proutiere, “Wireless downlink data channels: user performance and cell dimensioning,”In Proc. Mobicom’03, 2003. [31] J. Andrews, F. Baccelli, and R. Ganti, “A tractable approach to coverage
and rate in cellular networks,”IEEE Trans. Commun., Vol. 59, No. 11, pp. 3122-3134, Nov. 2011.
[32] Y. Cho, E. Oh, D. Hong, “A new modeling scenario and analysis of handoff algorithms in multisector systems with cochannel interference,” IEEE Trans. Veh. Technol., Vol. 58, No. 3, pp. 1407-1414, March 2009. [33] A. Ligeti, “Outage probability in the presence of correlated lognormal useful and interfering components,” IEEE Commun. Lett., Vol. 4, No. 1, pp. 15-17, Jan. 2000.
[34] Mehlfuhrer et al, “The Vienna LTE simulators - enabling reproducibility in wireless communications research,” EURASIP Journal on Advances in Signal Processing, pp.1-14, 2011:29, 2011.
[35] D. Chiu, R. Jain, “Analysis of the increase and decrease algorithms for congestion avoidance in computer networks,” Computer Networks and ISDN systems, Vol. 17, No. 10, pp. 1-14, 1989.
Dr Jianhua Heis a Lecturer at Aston University,
UK. He received his BSc and MSc degrees from Huazhong University of Science and Technology (HUST), China, and PhD degree from Nanyang Technological University, Singapore, in 1995, 1998 and 2002, respectively. Dr He was an Associate Pro-fessor of Department of Electronics and Information Engineering since 2001. He was with University of Bristol from 2004 to 2006 and with University of Essex in 2007. His main research interests include 5G and beyond technologies, machine to machine communications, Internet of things system and technologies (e.g. for small cities and intelligent transport) and big data analytics. He has authored or co-authored over 150 technical papers in major international journals and conferences. Dr He is a Senior Member of IEEE. He is editor/guest editor of a number of journals and TPC chair of several international conferences. He was TPC member of many international conferences including IEEE Globecom and IEEE ICC.
Dr Wenqing Cheng received the B.S. degree in
Telecommunication Engineering in 1985 and Ph.D. in Electronics and Information Engineering in 2005, both from Huazhong University of Science and Technology, Wuhan, China. She is currently a pro-fessor with the School of Electronic Information and Communications, Huazhong University of Science and Technology. Her research interests include mo-bile communications and wireless sensor networks, information system, e-Learning applications and etc.
Dr Zuoyin Tang is currently a Lecturer in the
School of Engineering and Applied Science, Aston University, UK. She obtained her PhD degree from University of Bath, UK, in 2008. She has authored and co-authored over 40 technical papers in major international journals and conferences. Dr Tang’s main research interests include resource manage-ment for cellular networks, Internet of things and wireless sensor networks.
Dr David Lopez-Perez is a Member of Technical
Staff at Nokia Bell Laboratories, and his main re-search interests are in HetNets, small cells, massive MIMO, unlicensed technologies interference and mobility management as well as network optimiza-tion and simulaoptimiza-tion. Prior to this, David earned his PhD in Wireless Networking from the University of Bedfordshire, UK in Apr. 11, and obtained his BSc and MSc degrees in Telecommunication from the Miguel Hernandez University, Spain in Sept. 03 & Sept. 06, respectively. David was Research Associate at King’s College London, UK from Aug. 10 to Dec. 11, carrying post-doctoral studies, and was with VODAFONE, Spain from Feb. 05 to Feb. 06, working in the area of network planning and optimization. David was also invited researcher at DOCOMO USA labs, CA in 2011, and CITI INSA, France in 2009. For his publications and patent contributions, David is a recipient of both the Bell Labs Alcatel-Lucent Award of Excellence and Certificate of Outstanding Achievement. He was also finalist for the Scientist of the Year prize in The Irish Laboratory Awards (2013, 2015). David was also awarded as PhD Marie-Curie Fellow in 2007 and Exemplary Reviewer for IEEE Communications Letters in 2011. David is author of the book ”Heterogeneous Cellular Networks: Theory, Simulation and Deployment” Cambridge University Press, 2012, and has published more than 80 book chapters, journal and conference papers, all in recognized venues, and filed more than 30 patents applications. David is or has been guest editor of a number of journals, e.g., IEEE JSAC, IEEE Comm. Mag., TPC member of top tier conferences, e.g., IEEE Globecom and IEEE ICC, and co-chair of a number of workshops.
Dr Holger Claussenis leader of Small Cells
Re-search Department at Bell Labs, Nokia with a team in Ireland and the US. In this role, he and his team are innovating in all areas related to future evolution, deployment, and operation of small cell networks to enable exponential growth in mobile data traffic. His research in this domain has been commercialized in Nokias (formerly Alcatel-Lucents) Small Cell product portfolio and continues to have significant impact. He received the 2014 World Technology Award in the individual category Communications Technologies for innovative work of the greatest likely long-term significance. Prior to this, Holger was head of the Autonomous Networks and Systems Research Department at Bell Labs Ireland, where he directed research in the area of self-managing networks to enable the first large scale femtocell deployments from 2009 onwards. Holger joined Bell Labs in 2004, where he began his research in the areas of network optimization, cellular architectures, and improving energy efficiency of networks. Holger received his Ph.D. degree in signal processing for digital communications from the University of Edinburgh, United Kingdom in 2004. He is author of more than 90 publications and 110 filed patent applications. He is Fellow of the World Technology Network, senior member of the IEEE, and member of the IET