Sharif University of Technology
Scientia Iranica
Transactions D: Computer Science & Engineering and Electrical Engineering www.sciencedirect.com
Research note
A no-reference low-complexity QoE measurement algorithm for
H.264 video transmission systems
P. Goudarzi
∗CyberSpace Research Institute (ex ITRC), Tehran, Iran
Received 27 June 2012; revised 21 December 2012; accepted 14 January 2013
KEYWORDS QoE; VQM; MOS; PCC; RMSE; SSIM.
Abstract Quality of Experience (QoE) measurement for transmitted video sequences over packet error prone channels is an inevitable necessity. Due to the intrinsic properties of packet error prone channels in imposing quality degradation on transmitted media and also, the costly and time-consuming nature of subjective quality measurement techniques, exact modeling of the impact of packet loss on measured video quality based on on-line objective measurement methods is an important task. In the current work, a low-complexity objective video quality measurement algorithm is developed by which by considering various factors that may affect video quality, we can estimate subjective video quality with acceptable accuracy. Then, the performance of the proposed objective algorithm is compared with popular objective SSIM/VQM techniques. The simulation results verify that the proposed algorithm has high level of accuracy. On the other hand, the proposed algorithm has low-complexity which makes it suitable for online implementation. Some important and related patents in the field of QoE measurements and monitoring in networks are investigated.
©2013 Sharif University of Technology. Production and hosting by Elsevier B.V.
1. Introduction
Generally, the Quality of Experience (QoE) measurement is performed using two methods: objective and subjective [1].
Essentially, three main types of quality metric presently exist, namely full-reference (FR), reduced reference (RR), and no-reference (NR or blind) [1]. Among these methods, the subjective FR method is the nearest to human perception, but for implementation, it needs some stringent prerequisites (testing environment, human factors, etc.) that are based on some ITU-T standards [2], which makes it a bad candidate for online deployment. No-reference video quality metrics as described in literature [3–8] are suitable for online (real-time) implementation, but they have lower accuracy in comparison with other metrics. In reduced reference (RR) quality estimation models, some feature data about the transmitted video sequence is sent to the receiver through a control channel.
∗Tel.: +98 21 84977351.
E-mail addresses:[email protected],[email protected].
Although the RR methods typically strike a good balance between complexity and accuracy, the need of another control channel is a restricting limitation because; it may not be available in all situations [9].
As QoE is related to customer experience, it needs customer feedback for evaluation. Subjective tests are time-consuming and need facilities for assessment. Additionally, the high payment price of these subjective tests makes it unsuitable for real-time video streaming applications.
In the current work, a low-complexity objective video quality measurement algorithm is developed, through which by considering various factors that may affect video quality, can estimate the subjective video quality with acceptable accuracy. The time-complexity of the proposed algorithm is low which makes it suitable for on-line implementation for no-reference quality estimation of live transmitted H.264 coded video sequences in the network.
The rest of the paper is organized as follows. In Section2, some related works have been investigated. In Section3, we have introduced different modules of the proposed measure-ment system. In Section4, the computational complexity of the proposed method is investigated. In Section5, some experimen-tal analysis is done to validate the proposed method and finally in Section6, some concluding remarks have been presented.
Peer review under responsibility of Sharif University of Technology.
1026-3098©2013 Sharif University of Technology. Production and hosting by Elsevier B.V.
doi:10.1016/j.scient.2013.02.021
Open access under CC BY-NC-ND license.
2. Related work
No-reference video quality estimation is an important and challenging task which must be considered an essential part of future interactive multimedia communication applications such as IPTV or online games.
Estimation of the exact perceived video quality in a no-reference on-line manner can be divided into two principal categories. In one category, media-layer parameters such as quantization parameter, and motion vector length, etc. are used for quality estimation. In another category, network-related parameters such as packet error rate, and frame error rate, etc. are adopted. Researchers have also tried to develop some relationship/mapping between the quality of experience and media/network-layer parameters. Also, for estimation of video quality, different measures/metrics can be used.
In [10], Eden proposed an algorithm for evaluation of the picture quality of H.264-coded video sequences. As a measure of picture quality the peak signal to noise ratio (PSNR) is used. While the computation of the PSNR usually considers a reference signal in comparison to a distorted video sequence, the proposed algorithm in [10] uses the coded transform coefficients to estimate the PSNR in a statistical manner.
In [11], Keimel et al. presents a no-reference metric for HDTV that uses features directly extracted from the H.264/AVC bitstream. They combine these features with the results from subjective tests using a data analysis approach with partial least squares regression to gain a prediction model for visual quality. For verification, they performed a cross validation. Their results show that the proposed no-reference metric outperforms other metrics and delivers a correlation between quality prediction and actual quality of 0.93.
Oelbaum et al. presents in [12] a no-reference video quality metric, which is based on a set of simple rules, which assigns a given video to one of four different content classes. They also propose an additional correction step for the visual quality value. The proposed metric is verified in a process, that includes visual quality values originating from subjective quality tests in combination with a cross validation approach. The presented metric significantly outperforms peak-signal-to-noise ratio as a visual quality estimator. The Pearson correlation between estimated visual quality values and subjective test results takes on values as high as 0.82 [12].
In [13], Valenzise et al. have proposed a maximum a posteriori estimation of the pattern of lost macroblocks, which assumes the knowledge of the decoded pixels only. This information can be used as input to a no-reference quality monitoring system, which produces an accurate estimate of the mean-square-error (MSE) distortion introduced by channel errors. The results of the proposed method are well correlated with the MSE distortion computed in full-reference mode, with a linear correlation coefficient equal to 0.9 at frame level and 0.98 at sequence level.
In [14], Kawano et al. have proposed a no reference QoE measurement system comprised of two training and test parts. In the training phase, they calculate the sensitivity of the low quality coded videos from some features such as blockiness, blurriness, edge and continuity etc. and rank these features using the Principal Component Analysis (PCA) method.
In [15], Rossholm et al. try to find a linear relationship between quality measurement techniques and media-layer metrics such as quantization parameter, bit per frame, the fraction of intra and inter frames, frame rate, and mean motion vector length etc.
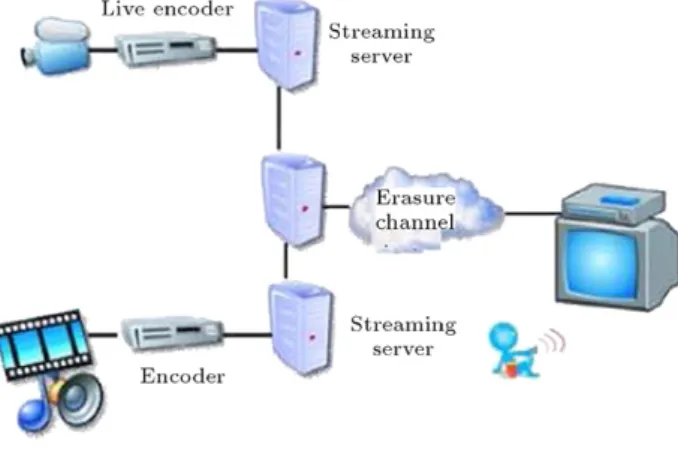
Figure 1: QoE measurement scenario.
In [16] a revised PSNR no-reference model is presented that estimates video quality using estimated DCT coefficients which are derived using Maximum Likelihood (ML) techniques.
In [17], the video quality is determined using parameters such as bit rate, zero length motion vectors in frame, ratio of motion vector length standard deviation to mean motion vector length in a frame, mean motion vector lengths and monotony of motion vector directions.
The proposed method uses a similar approach as [17] for quality estimation which is based on feature extraction techniques, but, the present work in this paper, adds more features in comparison with [17] to improve estimation accuracy.
In the current work, a similar quality estimation model like [17] has been adopted in which we have tried to consider more complete parameters in the proposed quality estimation model. Unlike [18], in the current work, we have proposed a more comprehensive nonlinear relationship between the quality and media layer parameters.
Moreover, unlike previous work, we have used both media-layer and network-based parameters in a comprehensive manner for quality estimation purpose.
3. Measurement system model
Consider a scenario which is depicted inFigure 1. In this scenario video content is transmitted by streaming servers through a packet error prone channel to the receiver. The packet error prone channel has been modeled in this work by the popular Gilbert–Eliot model [19]. Using this model, we can simulate channel conditions that arise for example in wireless flat or Rayleigh fading ones or the simpler case of packet error in the best-effort Internet. We assume that H.264 has been used for video encoding and proper transport-layer protocols (such as RTP/UDP) have been used for carrying user traffic. At the receiver side (before the Set Top Box), quality measurement experiments can be performed. For quality assessment purposes we first consider two simpler scenarios and then combine them in a complete scenario (which is named
case(c)).
Case(a)Video quality estimation in no-loss condition:
In this case, the single cause of quality degradation is due to encoders. This quality reduction depends on picture content, coder setting, frame or slice1dimensions, slice rate and bit rate.
Currently, we assume that slice rate and bit rate are known and also that the video is coded with a fixed quantization parameter. In this case one can estimate the video quality based on the video content. The extracted slice features are as follows:
1—Average length of the slice motion vectors:
MVLength
=
MV2x+
MV2y (1) MVavg=
N
i=1 M
j=1 MVLengthij M×
N.
(2)2—Length standard deviation of the motion vectors:
MVlengthstd
=
1 N×
M−
1
N
i=1 M
j=1
MVLengthij−
MVavg
2.
(3)3—Length entropy of the motion vectors: MVlengthpdf
=
hist
MVLength
(4) MVlengthentropy= −
k pklog(
pk) .
(5)4—Entropy in different directions of the motion vectors:
MVanglepdf
=
hist
2π
×
tan −1
MVy MVx
(6) MVangleentropy= −
k pklog(
pk) .
(7)5—Mean residue energy of the image:
RE
=
mean
residue2y
+
mean
residue2u
+
mean
residue2v
.
(8) For video QoE estimation, two training and test video sequences are used. At first, the model parameters are trained by the training videos using the regression method and then, the results are derived using the test videos. By considering video quality degradation behavior, it is concluded that quality degradation has an exponential relationship with the bit rate and image complexity. On the other hand, image residue energy has a multiplicative relationship with the quality. For deriving video quality and based on the mentioned facts we have:Q
=
a×
eb·SC×
ec·BR×
REd×
MVfavg×
MVglength std×
MVhlength entropy×
MV i angleentropy (9)where,a
,
b,
c,
d,
f,
g,
h,
iare constants that must be calculated by regression.SCis spatial complexity which is related to how much attention is required to detect and recognize objects by a person and to set relations among them [20].BRis the bit rate andREis the residue image energy. To use linear regression, we take a logarithm from(9):ln
(
Q)
=
ln(
a)
+
b·
SC+
c·
BR+
dln(
RE)
+
fln(
MVavg)
+
gln(
MVlengthstd)
+
hln(
MVlengthentropy)
+
iln(
MVangleentropy).
(10)By using training data, the constants are calculated and then can be used for the test data.
Case (b) Video quality estimation with packet loss ignoring encoder-induced distortion:
Figure 2: IDR frame initialization.
Assume that the image/frame dimension isW
×
XandEis a matrix which indicates the correct reception of the image blocks. E
=
a11· · ·
a1n... ... ...
am1· · ·
amn
(11) where:m
=
imagewidth(
in pixels)
imagesize
(
in pixels)
n
=
imagelength(
in pixels)
imagesize
(
in pixels)
.
Ehas the dimensions of a frame which creates by starting the video transmission and its elements are updated based on the next received information. The elements of the matrix represent quality degradation in the equivalent block in the video frame. These element values are assigned based on corrupted blocks and changed based on the motion vectors. Finally, the video quality estimation is based on this matrix. The initial value for received blocks is 0 and that of lost blocks is 1 (seeFigure 2).
In Figure 2, the initial assigned values to a degraded IDR frame with lost blocks are represented.
In situations in which the error is not in the IDR orIframes and are in thePframes, matrixEis replaced by the values of the previous frame histogram. In situations in which there is no motion, the concealed image is the same as the real one. So, the values of matrixEshould be reduced in such cases.
In this case, the error concealment algorithm works perfectly and without any errors, i.e. the reconstructed image is exactly the same as the lost one. The error concealment method is themotion compensated error concealmentmethod. In cases in which the error concealment method works efficiently, we can reduce the importance of incurred errors and so, we can reduce the values of the matrixE.
Error propagation is done in exactly the same manner as that used in the H.264 decoder for motion compensation. Based on the received motion vectors of future frames, the elements ofE
move to different places of this matrix:
Eif,j
=
Eif×−41+MVx,j×4+MVy
.
(12)In whichf is the frame number parameter.
Quality degradation in the frame is measured by averaging over the frame as follows:
Ef
=
1 W×
X W
i=1 X
j=1 Eif,j.
(13)Quality degradation calculation has two parts; quality degradation in the current frame and its impact on future frames. Assume that the quality degradation importance matrix
is represented by
δ
. This matrix cannot be defined for IDR frames because we have no information from the content of this frame and its previous one. ForIframes the importance matrix is defined as:δ
I(i,j)=
Average
MVf−1
×
c1×
Ii,j (14) where
MVf−1
is the mean motion vector length in the framewhich is before theI frame. Constantc1 is equal to 0.5, and Ii,j is the entropy of an estimated histogram for a 12
×
12window centered at blocki
,
j. Larger values of window size increase the overlap. Smaller values of window size results in lack of sufficient samples for histogram calculation. We have used the motion vectors of previous frames, because these are good indicators of the spatial features of the current frame.ForPframes, the importance matrix is defined as follows:
δ
P(i,j)=
Normalized(
I)
i,j×
MVi,j
+
c2×
Ii,j (15)where, Normalized
(
I)
is the normalized entropy matrix andc2is a constant and equals 0.3.
The constant parameters (such as c1 and c2) are chosen
heuristically. The simulation results in the performance com-parison section validate their choices. But, their selected values may not be necessarily optimal.
The video quality in the current frame, suffers from two types of error. One is information loss in the current frame and the other is information loss in the previous frames whose effects are visible in the current frame.
Considering these errors we write the error propagation relation as follows:
˜
E(f,i,j)= ˜
E(f−1,i,j)+
δ
i,j×
Efi,j+
c3×
MVi,j
not(
Efi,j)
E˜
(f−1,i,j) (16)where,E
˜
(f−1,i,j)is the propagated error until the previous frame.As described before, Eif,j is a matrix for the received frame and each element in this matrix is the indicator of a block in the current frame. It is a binary matrix. 0 means correct reception of the block info and 1 means loss. not
(
Eif,j)
is the logical not of the matrix.δ
i,j×
Eif,jindicates quality degradationfrom information loss in the current frame andc3
×
MVi,j
×
not
(
Eif,j)
E˜
(f−1,i,j) means quality degradation propagated fromthe previous frames to the current one:
˜
Ef=
m
i=1 n
j=1˜
E(f,i,j).
(17)Usually, the resulting errors from the lost packets have a burst nature in video. More time-complexity results in more quality degradation in such scenarios.
The Video Quality Metric (VQM) is developed by the institue for Telecommunication Science to provide an objective measurement for perceived video quality. It measures the perceptual effects of video impairment, including blurring, jerky/unnatural motion, global noise, block distortion and color distortion, and combines them into a single metric. The testing results show VQM has a high correlation with subjective video quality assessment and has been adopted by ANSI as an objective video quality standard. Based on this fact, we have adopted the VQM metric for testing the subjective performance of the proposed method.
The proposed method in this work has a high correlation with the VQM as a well-known full-reference quality metric.
Table 1: Time complexities.
Part Equation# Complexity
No-loss 2 O(MN) 3 O(MN) 4, 5 O(MN)+O(K1) 6, 7 O(MN)+O(K1) – O(MNW2)+O(K2) 8 O(MN) Loss 12, 13 O(MN) 14 O(MNW2) 15 O(MNW2) 16 O(MN) 17 O(MN)
The main strength of the proposed method in comparison with the VQM is its no-reference nature and its ability in real-time implementation due to its low complexity.
In order to compare the results with the VQM, we must re-scale the relations.
˜
Escaled= ˜
Emax(vqm)×
1−
e−α· ˜Ef/(bpMB)
(18) where,α
is a coefficient for controlling the slope of the quality decay graph, andbpMBis the mean bit value for each macroblock. For lower quality videos, bpMB is low and for higher quality videos it must be high because the graph must rise with lower speed.Exponential and multiplicative models are more generic than additive models. These models also do include the additive model. In a wide range of bitrates (from low to high), system behavior is nonlinear and this motivates the use of these nonlinear models.
Case(c) Video quality estimation with packet loss considering encoder-induced distortion:
Quality degradation during information reception may be from information loss or from the encoder part. To consider quality degradation from the encoder, we change the previous equation as follows:
˜
Escaled
=
offset+
(
E˜
max(vqm)−
offset)
×
1
−
e−α· ˜Ef/(bpMB)
.
(19)Eq.(19)represents the joint quality degradation effect from the network loss and the encoder.offset shows the encoder effect and 1
−
e−α· ˜Ef/(bpMB)shows the network loss effect.In the case of no network-related error, we haveE
˜
f=
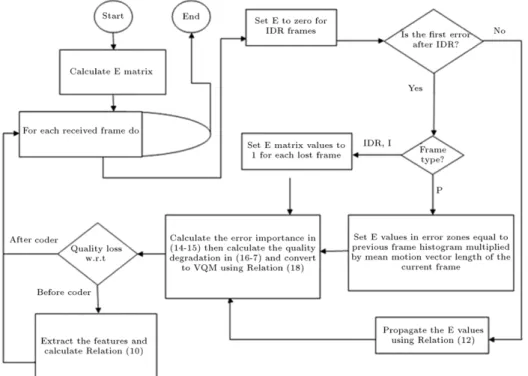
0. offset is calculated based on (9) and linear regression. The parameter is calculated by training with some test sequences.The flowchart of the proposed algorithm is depicted in
Figure 3.
4. Implementation complexity
In this section, we have tried to analyze the computational complexity of the proposed no-reference quality evaluation method.
The time-complexity of the different parts of the proposed algorithm is depicted inTable 1. In this table,M and N are frame dimensionsW is the histogram window size,K1 and
K2 are the number of histogram bars. Relations which are not mentioned inTable 1have zero complexity. The overall time-complexity of the proposed quality measurement algorithm is
O
(
MNW2)
+
O(
K2)
. This reveals the suitability of the proposed algorithm in real-time implementations.Figure 3: Flowchart of the proposed algorithm.
5. Performance comparison
For evaluating the accuracy of the proposed algorithm we have performed the following steps.
1—LIVE data base [21] has been used because of its popularity in the video quality assessment community. The video sequences are selected in a wide range based on textural complexity and scene activity. Two subsets which correspond to test and training are selected from the database. The database used in this part of the research consists of 10 video sequences 7 of which are used for training and the remaining 3 for test purposes. We have tried to select these three sequences to be in a wide range of contextual/temporal complexities. So, the
Akiyo,ForemanandStefansequences have been selected. After training, the regression parameter vector in Eq.(10)has been calculated as follows:
(
a b c d f g h i)
=
(
0.
1 1.
2 0.
2 0.
3 1.
1 2.
3 4 3.
4).
2—VQM and SSIM metrics have been used for the evaluating the performance of proposed objective algorithm.
For performance comparison with VQM and Structural Similarity (SSIM), we have used MSU software [22].
3—Two popular Pearson Correlation Coefficient (PCC) and Root Mean Square Error (RMSE) measures have been used to compare the correlation of the proposed objective algorithm with VQM and SSIM.
The PCC is defined as follows:
PCC
=
N
i=1
Xi− ¯
X
×
Yi− ¯
Y
N
i=1
Xi− ¯
X
2×
N
i=1
Yi− ¯
Y
2 (20)whereXirepresents the real Mean Opinion Score (MOS) which
is estimated by VQM or SSIM andX
¯
is its average value,Yiis theMOS value resulted from the proposed algorithm andY
¯
is its average.Nis the total number of test sequences.The precision of the proposed objective algorithm is estimated by the RMSE measure. The difference between the real MOS estimated by VQM or SSIM and the MOS value resulted from the proposed objective algorithm is the estimation error.
iis the number of test video sequences. The prediction error is calculated as follows:
Perror(i)
=
MOSvqm/SSIM(i)−
MOSpredicted(i)=
Xi−
Yi.
(21)Then, RMSE can be calculated as:
RMSE
=
1 N N
i=1 P2 error(i).
(22)Close to 1 values of the PCC and close to 0 values of the RMSE means that the proposed objective algorithm can estimate with a good precision the objective VQM/SSIM metrics.
We have used the JM coder [23] for H.264 video encoding. The coder parameters are listed inTable 2. The video resolution is set to 768
×
432.Using 7 test sequences and a linear regression method the fixed parameters of the algorithm are calculated.
In all real systems using regression learning models (as in the current work), system parameters are trained before practical use. In simple systems, the parameters are updated after viewing the new samples and taking user feedback. In our proposal, we have assumed that there is not any user feedback. In the presence of end-user feedback, the reinforcement learning method is the best learning solution which we have mentioned as an open issue for future research. In our method, the system parameters are trained before use and so, there is no need to update the parameters after a scene change.
The paper in [24], measures the video QoE for videos with CIF (352
×
288) resolution and for bitrates 200 kbps, 300 kbps and 400 kbps. Considering the video resolution in our workTable 2: JM coder parameters. Parameter Value ProfileIDC Extended QPISlice 28 MEDistortionFPel SSE NumberReferenceSlices 1 PSliceSearch8×16 Disable PSliceSearch4×8 Disable SP slices Disable
Error Resilience: SliceMode Fixed #mb in slice
EnableIDRGOP Enable DisableSubpelME Enable MEDistortionQPel SSE PSliceSearch16×8 Disable LevelIDC 30 QPPSlice 28 MEDistortionHPel SSE PSliceSearch16×16 Disable PSliceSearch8×8 Disable PSliceSearch4×4 Enable WeightedPrediction Disable
RD Optimization Low complexity mode
NumberBSlices 0
Deblocking filter Disable
RateControlEnable Enable
PSliceSearch8×4 Disable
(768
×
432) and the nonlinear property of the problem the paper in [24] cannot have better results in comparison with the proposed method in the current work. Furthermore, the authors in [24], assume that one slice is lost in each GOP but in our method, any number of slices can be lost in each GOP.The paper in [25] assumes a constant bit rate but in the current work we consider a diverse range of possible bitrates.
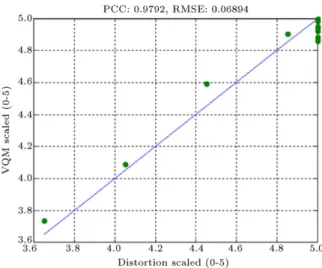
InFigures 4–9the performance of the proposed objective QoE measurement algorithm is compared with the objective VQM metric. The resulting PCC and RMSE results are listed in
Table 3. InFigure 4, the proposed algorithm is compared with VQM in a no packet loss condition, and we have calculated PCC and RMSE to be 0.99181 and 0.12475 respectively. It can be verified that good correlation exists between the estimated objective quality of the proposed algorithm in (19)and the objective VQM metric.
For more comprehensive evaluation, we have compared the performance of the proposed no reference algorithm with the popular full reference SSIM method. For simulation of this part, we have considered a better resolution of 800
×
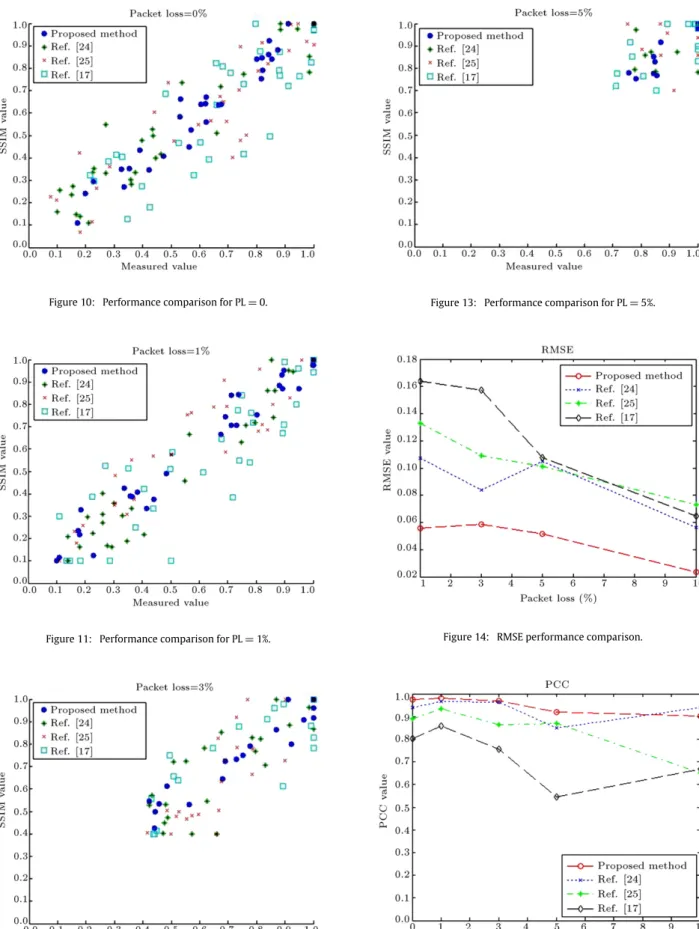
600. The database used in this part consists of 20 video sequences among which 10 are used for training and the remaining 10 are used for test purposes.InFigures 10–13, the performance of the proposed algorithm is compared with [17,24,25] in terms of SSIM. It can be verified that good correlation exists between the estimated objective quality of the proposed algorithm in(19)and the objective SSIM metric.
The SSIM is defined as follows [26]:
SSIM
=
2µ
xµ
y+
(
0.
01L)
2
2σ
xy+
(
0.
03L)
2
µ
2 x+
µ
2y+
(
0.
01L)
2
σ
2 x+
σ
y2+
(
0.
03L)
2
(23)where,
µ
x, µ
y, σ
x2, σ
y2are the average and variance ofxandyrespectively.
σ
xyis covariance ofxandy, andLis the dynamicrange of the pixel values.
The results are depicted for packet losses 0%, 1% and 3% in
Figures 10–13respectively. As can be verified in these figures, the proposed no-reference method can estimate the accurate
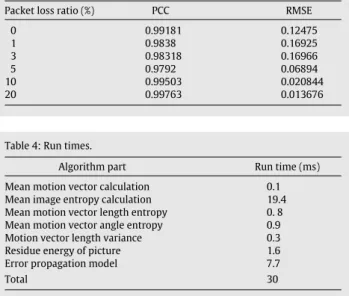
Table 3: PCC and RMSE for different packet loss ratios.
Packet loss ratio (%) PCC RMSE
0 0.99181 0.12475 1 0.9838 0.16925 3 0.98318 0.16966 5 0.9792 0.06894 10 0.99503 0.020844 20 0.99763 0.013676
Table 4: Run times.
Algorithm part Run time (ms)
Mean motion vector calculation 0.1
Mean image entropy calculation 19.4
Mean motion vector length entropy 0. 8
Mean motion vector angle entropy 0.9
Motion vector length variance 0.3
Residue energy of picture 1.6
Error propagation model 7.7
Total 30
SSIM method with good accuracy. The reason why this packet loss range is selected is due to its popularity in wire-line packet erasure channels.
FromFigures 4–13it can be verified that even in the high packet error ratios, there exists good correlation between the proposed objective algorithm and those of objective VQM and SSIM.
The resulting PCC and RMSE results are depicted in
Figures 14–15.
It can be concluded from this Figures 14–15 that the proposed algorithm has superior PCC and RMSE performance in comparison with traditional [17,24,25] methods.
For sketching these figures, we have repeated the results 3 times and averaged them for the video bit rates which correspond to different YPSNR quality levels from 30 dB, 35 dB and 40 dB.
For running the proposed algorithm, we have used MATLAB 10 on a 2.2 GHz Core2D CPU.
InTable 4, the required running time for different parts of the proposed algorithm is presented. Based on this table, the maximum calculation time in the proposed method, is devoted to calculating the mean picture entropy.
The total running time of the algorithm is 30 ms. Compared with the total running time of the similar approach in [17] which is calculated to be about 55 ms, it can be concluded that the proposed algorithm benefits from lower computational complexity in comparison with similar approaches.
6. Concluding remarks
Quality of experience measurement of a transmitted video sequence in packet error prone networks is a challenging and important issue in the research networking community. Many researchers have worked on finding an appropriate mapping function between the quality of service and quality of experience parameters. Many inventions are registered in this field which focus on the design and development of appropriate apparatus for QoE estimation in communication networks and some of which were investigated in this paper. Future work in this area can be performed in multiple dimensions. One important area is developing the QoE measurement/estimation methods for cloud video applications. Another important one
Figure 4: System performance for PL=0.
Figure 5: System performance for PL=1%.
Figure 6: System performance for PL=3%.
Figure 7: System performance for PL=5%.
Figure 8: System performance for PL=10%.
Figure 10: Performance comparison for PL=0.
Figure 11: Performance comparison for PL=1%.
Figure 12: Performance comparison for PL=3%.
Figure 13: Performance comparison for PL=5%.
Figure 14: RMSE performance comparison.
is developing cognitive quality measurement systems that can cooperate with network operators for improving the perceived QoE. Designing no-reference QoE estimation methods to be as close as possible to user perception is still another open research area. Finally, the application of artificial intelligence methods instead of the linear regression (such as machine learning [27]) for QoE estimation can be suggested for future research.
Acknowledgment
The authors thank the ITRC for its financial support of this research via grant number 8932352.
References
[1] Winkler, S.,Digital Video Quality: Vision Models and Metrics, John Wiley & Sons, Hoboken, NJ (2005).
[2] ITU-T. ‘‘Subjective audiovisual quality assessment methods for multime-dia applications,’’ ITU-T Recommendation, p. 911 (1998).
[3] Neri, A., Carli, M., Montenovo, M. and Comi, F. ‘‘No reference quality assessment of Internet multimedia services,’’Proceedings of the 14th European Signal Processing Conference, EUSIPCO 2006,EURASIP, Florence, pp. 1–5, 4–8 September (2006).
[4] Calyam, P., Ekicio, E., Lee, C.-G., Haffner, M. and Howes, N. ‘‘A ‘GAP-model’ based framework for online VVoIP QoE measurement’’,Journal of Communications and Networks, 9, pp. 446–456 (2007).
[5] Tang, H., Duan, L. and Li, J. ‘‘A performance monitoring architecture for IP videoconferencing’’, InProceedings of the IEEE Workshop on IP Operations and Management, pp. 48–54, IEEE Press, Piscataway, NJ (2004).
[6] Marziliano, P., Dufaux, F., Winkler, S. and Ebrahimi, T. ‘‘A no reference perceptual blur metric’’, InProceedings of the 2002 IEEE International Conference on Image Processing, Rochester, NY, 22–25 September 2002, 3, ICIP 2002, pp. 57–60, IEEE Press, Piscataway, NJ (2002).
[7] Massidda, F., Giusto, D. and Perra, C. ‘‘No reference video quality estimation based on human visual system for 2.5/3G devices,’’Proceedings of the SPIE, SPIE, San Jose, CA,17 January 2005, 5666, pp. 168–179 (2005).
[8] Fiedler, M., Hossfeld, T. and Tran-Gia, P. ‘‘A generic quantitative relationship between quality of experience and quality of service’’,IEEE Network, 24(2), pp. 36–41 (2010).
[9] Li, S. and Ngan, K. ‘‘Reduced-reference video quality assessment of compressed video sequences’’,IEEE Transactions on Circuits and Systems for Video Technology, 22(10), pp. 1441–1456 (2012).
[10] Eden, A. ‘‘No-reference estimation of the coding PSNR for H.264-coded sequences’’,IEEE Transactions on Consumer Electronics, 53(2), pp. 667–674 (2007).
[11] Keimel, C., Klimpke, M., Habigt, J. and Diepold, K. ‘‘No-reference video quality metric for HDTV based on H.264/AVC bitstream features’’,IEEE ICIP (2011).
[12] Oelbaum, T., Keimel, C. and Diepold, K. ‘‘Rule-based no-reference video quality evaluation using additionally coded videos’’, IEEE Journal on Selected Areas in Communications, 3(2), pp. 294–303 (2009).
[13] Valenzise, G., Magni, S., Tagliasacchi, M. and Tubaro, S. ‘‘No-reference pixel video quality monitoring of channel-induced distortion’’,IEEE Transactions on Circuits and Systems for Video Technology, 22(4), pp. 605–618 (2012). [14] Kawano, T., Yamagishi, K., Watanabe, K. and Okamoto, J. ‘‘No reference
video-quality-assessment model for video streaming services,’’2010 18th International Packet Video Workshop, PV, pp. 158–164, 13–14 December (2010).
[15] Rossholm, A. and Lovstroem, B. ‘‘A new low complex reference free video quality predictor,’’IEEE 10th Workshop on Multimedia Signal Processing, 2008, pp. 765–768, 8–10 October (2008).
[16] Brandaõ, T. and Queluz, M.P. ‘‘No-reference quality assessment of H.264/AVC encoded video’’,IEEE Transactions on Circuits and Systems for Video Technology, 20(11), pp. 1437–1447 (2010).
[17] Ries, M., Nemethova, O. and Rupp, M. ‘‘Motion based reference-free quality estimation for H.264/AVC video streaming,’’Proceedings of the 2nd International Symposium on Wireless Pervasive Computing, ISWPC, pp. 355–359, February (2007).
[18] Watanabe, K., Yamagishi, K., Okamoto, J. and Takahashi, A. ‘‘Proposal of new QoE assessment approach for quality management of IPTV services,’’ 15th IEEE International Conference on Image Processing, ICIP(2008). [19] Haßlinger, G. and Hohlfeld, O. ‘‘The gilbert-elliott model for packet loss in
real time services on the Internet’’,MMB 2008, pp. 269–286.
[20] Ralescu, A. and Shanaham, J. ‘‘Perceptual organization for inferring object boundaries in an image’’,Pattern Recognition, 32, pp. 1923–1933 (1999). [21] ‘‘LIVE Video Quality Database’’, [online] Available from: http://www.
utexas.edu/ece/research/live/vqdatabase/.
[22] ‘‘MSU software’’, [online] Available from: http://www.its.bldrdoc.gov/ resources/video-quality-research/software.aspx.
[23] ‘‘JM coder’’, [online] Available from:http://iphome.hhi.de/suehring/tml/. [24] Lin, T.-L., Kanumuri, S., Zhi, Y., Poole, D., Cosman, P. and Reibman, A. ‘‘A
versatile model for packet loss visibility and its application to packet prioritization’’,IEEE Transactions on Image Processing, 19(3), pp. 722–735 (2010).
[25] Wang, Y., Lin, T.-L. and Cosman, P.C. ‘‘Network-based model for video packet importance considering both compression artifacts and packet losses,’’IEEE Globecom(2010).
[26] Wang, Z., Bovik, A.C., Sheikh, H.R. and Simoncelli, E.P. ‘‘Image quality assessment: from error visibility to structural similarity’’,IEEE Transactions on Image Processing, 13(4), pp. 600–612 (2004).
[27] Lian, H. ‘‘No-reference video quality measurement with support vector regression’’,International Journal of Neural Systems, 19(6), pp. 457–464 (2009).
Pejman Goudarziwas born in Shiraz, Iran, in 1972. He received a B.S. degree in Electronics from Sharif University of Technology, Tehran, Iran, in 1995, and M.S. and Ph.D. degrees in Communications and Electrical Engineering from Isfahan University of Technology, Iran, in 1998 and 2004, respectively. Dr. Goudarzi is currently faculty member in the Research Institute for ICT (ITRC). His main research intersts include: wireless video communication, next generation networks, distributed rate allocation algorithms and congestion control in data networks.