15B.3
RADAR-BASED RAINFALL NOWCASTING AT EUROPEAN SCALE: LONG-TERM
EVALUATION AND PERFORMANCE ASSESSMENT
Marc Berenguer*, Daniel Sempere-Torres
Centre de Recerca Aplicada en Hidrometeorologia, Universitat Politècnica de Catalunya
(BarcelonaTech), Barcelona, Spain
1.
INTRODUCTION
Precipitation is the triggering agent of natural
hazards that have very serious impacts on people’s life
and goods (i.e. floods, debris flows, landslides…), which
require very high-resolution rainfall forecasts to improve
the capability of issuing alerts with enough anticipation.
Germann et al. (2006) and Berenguer et al.
(2012)
showed that the use of Continental radar mosaics allows
clear improvement in the performance of nowcasting
techniques based on the extrapolation of radar
observations, providing reasonable forecasts for lead
times up to 6 hours using NEXRAD observations over
the central-eastern Continental US. Also, Berenguer et
al.
(2012) found that, on average, radar-based
nowcasting outperformed radar data assimilating
models for 2–4 h after initialization, and models not
assimilating radar data for up to 5 h after initialization.
Recently, the EUMETNET programme OPERA
(Matthews et al.
,
2011) has succeeded in operationally
generating a European precipitation map in real time
from the National radar networks in Europe, with the
resolution of radar measurements (2x2 km
2and every
15 minutes). This product fulfills the requirements of
many applications involved in anticipating
precipitation-induced hazards (for instance, in decision-making in
Civil Protection agencies). This study analyzes the skill
of very short-term rainfall forecasts generated from the
Continental OPERA precipitation maps, to what
constitutes the first application of these maps for rainfall
nowcasting at European scale.
2.
DATASET AND NOWCASTING ALGORITHM
Input data of this study are the Continental radar
mosaics generated from the National radar networks in
Europe within the EUMETNET programme OPERA.
These benefit from the quality control performed at the
European Radar Data Centre (Odyssey). The data used
here were collected between 01 June 2012 and 31 May
2013 and 8-hour rainfall forecast were generated
operationally every 15 minutes.
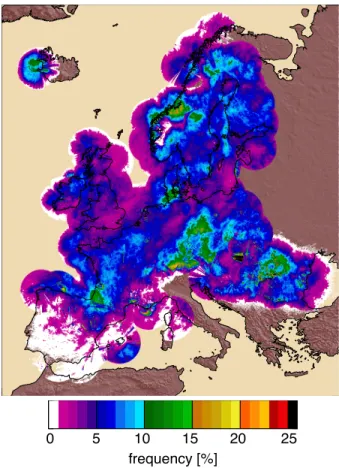
Figure 1 shows the map of the frequency of
observed reflectivity values exceeding 10 dBZ for the
month of June 2013. This map illustrates the high detail
of the precipitation field at European scale.
*Corresponding author address
: Marc Berenguer,
CRAHI-UPC,
Barcelona
(Spain).
Phone:
(+34)
934054195; email: [email protected]
For example, it shows the lack of precipitation over
the Southern part of the Iberian Peninsula, or that in the
Eastern Alps, some areas had precipitation for more
than 15% of the time (extreme flooding occurred in
south and east Germany, Czech Republic and Austria at
the beginning of June). The Figure also shows the
coverage of the network, which decreases with distance
in the edges of the network (as shown by the lower
frequency values). On the other hand, the Figure also
evidences areas with reduced radar coverage due to the
orography over the main mountain ranges (e.g. over the
Alps or in the area between Sweden and Norway), and
shows some artifacts (such as systematic ground and
sea clutter or interferences) that will need to be further
taken care in future versions of the quality control
process.
Fig. 1. Frequency of radar echoes exceeding 10 dBZ during the month of June 2013.
The nowcasting technique used in this work is the
same as used by Berenguer et al. (2011), and it has
been adapted to run on OPERA mosaics. The motion of
0
5
10
15
20
25
the precipitation field (one example is shown in Fig. 2.)
is estimated from recent observations at a resolution of
50 km and interpolated to the grid resolution. Finally,
precipitation nowcasts are obtained by advecting the
most recent mosaic with a semi-Lagrangian backward
scheme.
Fig. 2. Motion field of precipitation estimated on 25 June 2012 at 04:00 UTC.
3.
RESULTS
Figure 3 shows the mean correlation between rainfall
nowcasts
and
observations
[calculated
without
subtracting the mean, as proposed by Germann et al.
(2006)] as a function of the lead time for the entire
analysis period. The decorrelation time (or life time)
was used by Germann et al. (2006) to assess the
performance of the algorithm in different precipitation
events. The average lifetime for the analyzed period (01
June 2012 to 31 May 2013) has been found to be
around 5.2 hours over the entire domain for the
analyzed period.
This value is very similar to those reported by
Germann et al. (2006) and Berenguer et al. (2012) for
long-term evaluation of radar-based nowcasts over
North America.
Fig. 3. Average correlation between observations and forecasts as a function of leadtime for the period 01 June 2012 to 31 May 2013.
4.
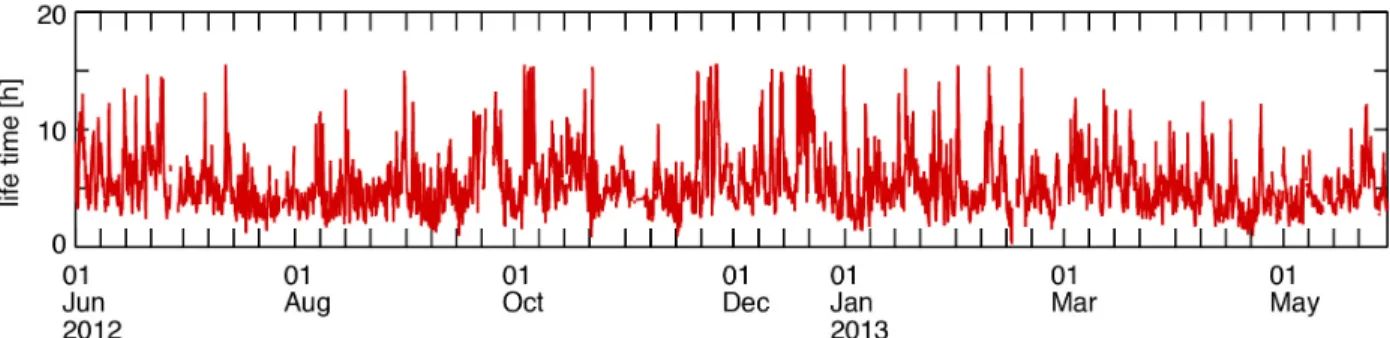
VARIABILITY IN SPACE AND TIME
However, there is a major variability of the
performance of extrapolation-based nowcasting. In this
sense, the evolution of lifetime during the analyzed
period (Fig. 4) shows significant variability with values
ranging from 2 to 15 hours (the latter mostly coinciding
with large-scale long-lasting precipitation systems).
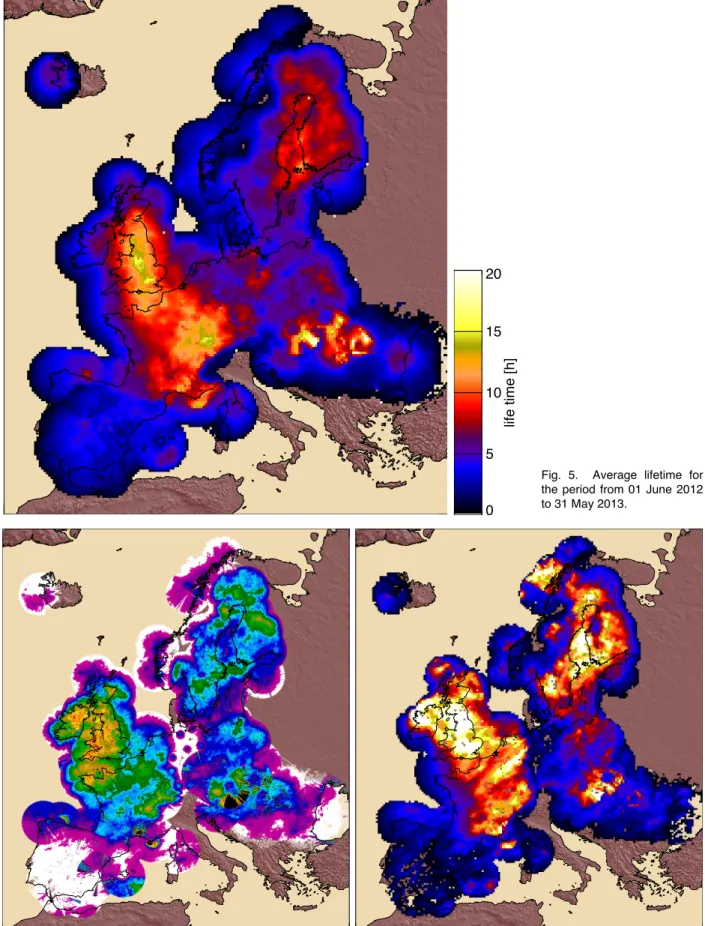
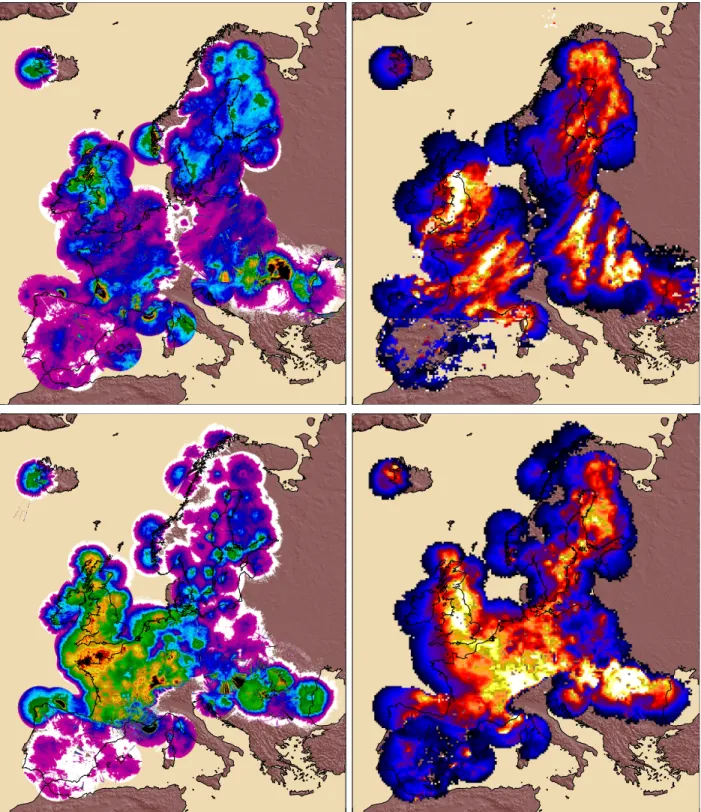
Also, the performance of nowcasting is variable over
the OPERA domain. This can be seen in Fig. 5, which
shows the poor performance near the Western edges of
the OPERA network, where the Atlantic systems cannot
be forecasted due to the lack of observations.
The highest lifetime values are obtained over France
and Great Britain (with values exceeding 10 hours) and
over the Northeastern Baltic and Finland. These regions
benefit from good coverage of the OPERA network and
from the better predictability of the precipitation systems
affecting them.
Fig. 4. Time series of lifetime computed from precipitation nowcasts during the period from 01 June 2012 to 31 May 2013.
0 2 4 6 8 leadtime [h] 0.0 0.2 0.4 0.6 0.8 1.0 correlation [ ] life time: 5.2 h
Fig. 5. Average lifetime for the period from 01 June 2012 to 31 May 2013.
Fig. 6. Frequency of radar echoes exceeding 10 dBZ (left) and average lifetime (right) for the month of June 2012.
0
5
10
15
20
life time [h]
Fig. 8. Same as Fig. 6 but for March 2013.
Also, there seems to be some degree of
correspondence between the frequency of precipitation
and the quality of the nowcasts (expressed in terms of
the lifetime): better skill is obtained in the areas where
precipitation occurred more frequently. This can be
observed in Figs. 6-8 for the months of June,
September, December 2012, and March 2013.
5.
NOWCASTING-NWP COMPARISON
A first comparison of the performance of nowcasting
with that of the rainfall forecasts obtained with the
Numerical Weather Prediction model HIRLAM (as run
operationally at the Finnish Meteorological Institute) is
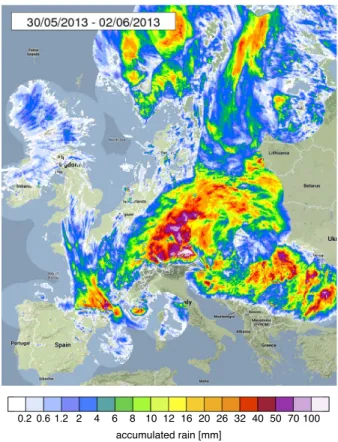
presented for the event of 01-02 June 2013 (the
radar-based rainfall accumulation for the entire event is shown
in Fig. 9). Fig. 10 shows the correlation between rainfall
forecasts and OPERA rainfall accumulations. In the
Figure it can be seen that the model needs about 2
hours to start generating rainfall. Beyond the third hour,
the correlation takes a relatively constant value of
around 0.45 for up to around 36 hours. On the other
hand, nowcasts show a very high correlation with rainfall
observations, decreasing with leadtime. For this
particular case, the different nowcasting runs performed
better than NWP for around 4-5 hours.
Fig. 9. Rainfall accumulation estimated from OPERA mosaics corresponding to the period 30 May to 02 June 2013.
0.2 0.6 1.2 2 4 6 8 10 12 16 20 26 32 40 50 70 100 accumulated rain [mm]
Fig. 10. Correlation between OPERA observations and rainfall forecasts obtained with the HIRLAM run corresponding to 01 June 2013 at 00:00 UTC (dashed blue line), and with the analyzed nowcasting system run on 01 June 2013 at 00:00, 08:00, 16:00 UTC and on 02 June 2013 at 00:00, 08:00 UTC (red lines).
6.
CONCLUSION
This paper examines the performance of an
algorithm for rainfall nowcasting at European scale
using the radar mosaics generated within the
EUMETNET programme OPERA during the period from
June 2012 to May 2013.The study shows a mean
decorrelation time of around 5.2 hours [similar to those
reported by Germann et al. (2006) and Berenguer et al.
(2012) over North America]; however, significant time
and space variability of the performance of the algorithm
has also been found, with the best performances
achieved in the areas most affected by precipitation,
especially in the Great Britain and northern part of
France, and in the Baltic region.
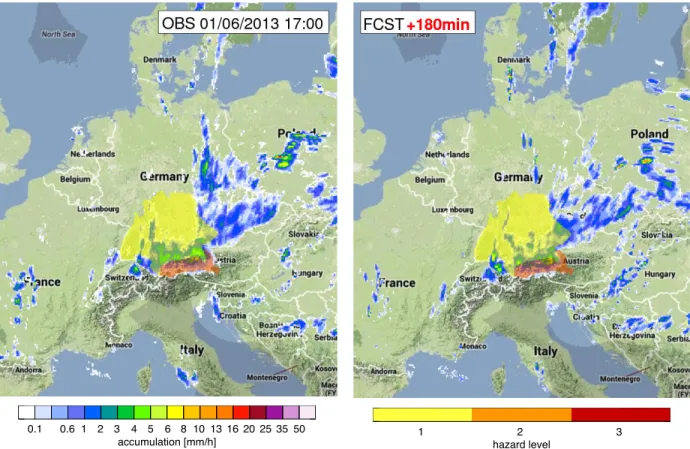
Fig. 11. Hazard level overplotted on hourly rainfall accumulations for 01 June 2013 at 17:00 obtained from radar observations (left), and from 3-hour rainfall forecasts (right).