Open Access
Methodology article
Triple-target microarray experiments: a novel experimental
strategy
Thorsten Forster*
1, Yael Costa
2, Douglas Roy
1, Howard J Cooke
2and
Klio Maratou
2Address: 1Scottish Centre for Genomic Technology and Informatics, University of Edinburgh, The Chancellor's Building, College of Medicine, 49
Little France Crescent, Edinburgh, EH16 4SB, UK and 2MRC Human Genetics Unit, The Department of Chromosome Biology, Western General
Hospital, Crewe Road, Edinburgh, EH4 2XU, UK
Email: Thorsten Forster* - [email protected]; Yael Costa - [email protected]; Douglas Roy - [email protected]; Howard J Cooke - [email protected]; Klio Maratou - [email protected]
* Corresponding author
Abstract
Background: High-throughput, parallel gene expression analysis by means of microarray technology has become a widely used technique in recent years. There are currently two main dye-labelling strategies for microarray studies based on custom-spotted cDNA or oligonucleotides arrays: (I) Dye-labelling of a single target sample with a particular dye, followed by subsequent hybridisation to a single microarray slide, (II) Dye-labelling of two different target samples with two different dyes, followed by subsequent co-hybridisation to a single microarray slide. The two dyes most frequently used for either method are Cy3 and Cy5. We propose and evaluate a novel experiment set-up utilising three differently labelled targets co-hybridised to one microarray slide. In addition to Cy3 and Cy5, this incorporates Alexa 594 as a third dye-label. We evaluate this approach in line with current data processing and analysis techniques for microarrays, and run separate analyses on Alexa 594 used in single-target, dual-target and the intended triple-target experiment set-ups (a total of 18 microarray slides). We follow this by pointing out practical applications and suitable analysis methods, and conclude that triple-target microarray experiments can add value to microarray research by reducing material costs for arrays and related processes, and by increasing the number of options for pragmatic experiment design.
Results: The addition of Alexa 594 as a dye-label for an additional – third – target sample works within the framework of more commonplace Cy5/Cy3 labelled target sample combinations. Standard normalisation methods are still applicable, and the resulting data can be expected to allow identification of expression differences in a biological experiment, given sufficient levels of biological replication (as is necessary for most microarray experiments).
Conclusion: The use of three dye-labelled target samples can be a valuable addition to the standard repertoire of microarray experiment designs. The method enables direct comparison between two experimental populations as well as measuring these two populations in relation to a third reference sample, allowing comparisons within the slide and across slides. These benefits are only offset by the added level of consideration required in the experimental design and data processing of a triple-target study design. Common methods for data processing and analysis are still applicable, but there is scope for the development of custom models for triple-target data. In summary, we do not consider the triple-target approach to be a new standard, but a valuable addition to the existing microarray study toolkit.
Published: 10 February 2004
BMC Genomics 2004, 5:13
Received: 22 December 2003 Accepted: 10 February 2004 This article is available from: http://www.biomedcentral.com/1471-2164/5/13
© 2004 Forster et al; licensee BioMed Central Ltd. This is an Open Access article: verbatim copying and redistribution of this article are permitted in all media for any purpose, provided this notice is preserved along with the article's original URL.
platform that enables research on whole genomes, thereby helping to increase our understanding of the reg-ulation of biological systems. All variations of this tech-nique involve the deposition of a large number of probe sequences (e.g. oligonucleotides, cDNA) – representing a whole genome or subsets thereof – in a regular grid-like array on a physical substrate, usually a glass slide for cus-tom spotted arrays. Microarray studies are costly in terms of equipment, consumables and time, therefore careful design and replication are particularly important if the resulting experiment is to be maximally informative. As opposed to high-density arrays like Affymetrix (probes produced in-situ in a process resembling lithography), standard experiments using spotted arrays on glass slides usually involve the co-hybridisation of two differently labelled targets to one slide. This is normally referred to as dual-target or dual-dye arrays. In such a cDNA microarray dual-target experiment, it is usually the fluorescent dyes Cy5 and Cy3 that are used in tandem. One of the dyes is used to label an experimental target sample, the other to label a reference or control sample. After measuring the fluorescence of each dye-label channel separately, the scan images are processed and this results in a numerical value of abundance (often termed expression) of this gene in the experimental sample and the reference sample. The
relative abundance of each gene is usually presented as the
log-ratio of these two values, and used as the measure of gene expression for an array. There are practical issues concerning this experimental approach, in that con-straints on the number of arrays processed and/or the amount of RNA available can have a detrimental effect on the experimental design [1].
We have introduced a third dye-label (Alexa 594) in an attempt to improve on such practical limitations without sacrificing data quality. This novel experimental strategy was specifically developed to investigate, using cDNA microarrays, the changes in gene expression patterns dur-ing the normal development of spermatogenesis in wild type mouse, and in parallel, in a known fertility mutant
(Dazl-null mouse) [2]. We envisage this approach to be
useful in similar complex multi-factorial experiments, e.g., time-series data with comparisons between different genotypes, or cancer studies where comparisons are required both in a single patient (e.g. before and after therapy) and across a population of patients. In each case, the benefit lies in producing more than one on-chip meas-urement of relative expression. For example, using a com-mon reference sample in combination with a test sample
of type A and type B on one array allows a direct
compari-son of the relative gene expression levels in both test sam-ples, without having to compare relative expression values from two or more dual-target arrays containing only a
ref-replication, this considerably reduces the number of arrays required for a microarray study without having to reduce the complexity of the biology under study. There have been previous publications [3,4] investigating the use of three dye-labels per microarray, but it must be stressed here that the third dye was used to label the probes rather than a third target sample. This is a different objective to the one described here, and, due to the manipulation of the actual array platform, has larger requirements in terms of repeat array hybridisations. To avoid confusion between these different concepts and aims, we refer to the approach described in this paper as "triple-target" rather than "triple-dye".
In this paper, we report on the methodology and evalua-tion of using three dye-labelled target samples per array, specifically Cy3, Cy5 and Alexa 594.
Results and Discussion
In order to assess both the use of Alexa 594 in combina-tion with the other two dyes and the use of Alexa 594 by itself or in combination with only one of the other dyes, three separate analyses were performed. The first is based on the analysis of arrays which have been co-hybridised with three differently labelled target samples, with n = 5 arrays. The second analysis is based on arrays which have been co-hybridised with only two of the available three dye-labels, with n = 2 arrays for each of the three possible dye-label combinations. The third analysis involves arrays that have been hybridised with only one dye-labelled tar-get sample, with n = 3 arrays for Alexa594, n = 2 arrays for Cy5 and n = 2 arrays for Cy3. The only difference imposed on these three analyses was the use of a different print-run of slides for the single-target analysis. There was one con-sistent pool of target sample material for all hybridisa-tions and labellings. QuantArray software was used to convert the images to numerical data, and all interpreta-tion of data is done on these numerical data. The param-eter values for the QuantArray algorithm were chosen based on manufacturer recommendations and kept con-sistent for all arrays and dye-label samples. Any choice of algorithm and parameter values results in some level of observed discrepancy between image and numerical pres-entation of the image (e.g. background estimates). Where such differences are apparent, they have been pointed out in the evaluation.
Triple-target self hybridisations
For dual-target experiments, any setup involving one sam-ple dye-labelled with both dyes and hybridised to one
array is referred to as self-to-self hybridisation, and in
hybridisations. The theoretical outcome of any self-to-self experiment is clear: absolute expression values for genes should be identical across array dye-label channels. Simi-larly, relative expression value for every gene should be 1 (or 0 on a log scale), independent of the dye-label combi-nation in question. Evaluation of the validity of adding a third dye-labelled sample therefore consists of testing to which degree this theoretical outcome is true, and if it is different to outcomes from standard dual-target arrays. In practice, the ideal theoretical outcome is normally not achieved in experimental data, due to factors like differ-ences in RNA extraction, dye-label incorporation, hybrid-isation quality, slide quality and scanning parameters etc., all of which increase variance in the data [5]. To minimise dye-label incorporation differences, aminoallyl labelling has been used, which results in higher labelling efficiency and improved incorporation of the different dyes com-pared to the direct labelling method [6-8]. Normalisation algorithms have been devised to further limit the effect of such sources of variation, and as a result, any self-to-self hybridisation should then approximate the ideal out-come. In the following section this statement is evaluated. A first investigation of the expression values obtained from the three individual samples on an array (Fig. 1, Table 1) shows that, across all probes on an array, Cy3 and Alexa594 share similar average expression and spread of values before applying any normalisation methods. Cy5 labelled samples appear to have a greater spread of data values, with differences apparent in the lower signal inten-sities. This may be caused by dye-label incorporation dif-ferences, which are known to occur in most common Cy5/Cy3 dual-target experiments. These differences are not evident for Cy3/Alexa594 combinations here. Before normalisation, log-ratios for pair-wise sample compari-sons on the arrays are therefore showing slightly greater variance for those combinations that involve Cy5 (Fig. 2a), in addition to global differences that systematically move the ratios away from zero 0. Subsequent location and scale normalisation reduces these systematic differ-ences and results in very comparable data distributions, all gene probes on an array contained in the InterQuartileRange having logratios within the interval [+0.25; -0.25] (Fig. 2b).
The sample-to-sample differences for all three samples on an array were also assessed by visualising their standard deviation in relation to the average level of expression, both calculated across all gene-probes in a dye-label chan-nel (Fig. 3). Due to the limitation of only having three dye-label observations per gene per array, the calculation
of the relative standard deviation is not a statistically
relevant procedure, and influenced by outlier values. Here it only serves as a global quality indicator. Nonetheless,
expression levels of a gene on an array is occurring at lower levels of expression. The majority of medium and high expressed genes have a relative standard deviation <0.05 even before applying normalisation methods. A common visualisation method for dual-target arrays is the MA plot (in a similar version often referred to as R-I plot), which combines information about the log-ratio of a gene probe with its expression level, and this is also used as the basis for a LoWeSS normalisation. A standard dual-target array will obviously have only one such plot, whereas a triple-target array increases the number of pos-sible sample-combinations on the array to 3. In a real bio-logical experiment, the interest may be focused on only two of these, but for the purpose of this evaluation we examine all possible relationships (Fig. 4). All five arrays show reproducible patterns of dependence or non-dependence of the log-ratio on the log-intensity. The dye-incorporation differences discussed above are clearly visi-ble for the standard Cy5/Cy3 combination as well as for the Cy5/Alexa594 combination. The relationship between Cy3 and Alexa594 is equally reproducible, but, in contrast to the other two pairings, there is no evidence of pro-nounced differences between the two labels at low expres-sion levels. After removing systematic linear and non-linear differences between any two dye-labelled samples, the resulting log-ratios for all dye-label combinations are centred around 0 (Fig. 5). Since the LoWeSS normalisa-tion needs to apply a greater change to log-ratios involv-ing Cy5, at least at lower levels of signal intensity, it could be surmised that the corrected log-ratios from the Cy3/ Alexa combination will be associated with less introduced bias.
Dual-target self hybridisations
Whereas triple-target self hybridisations are ideal for test-ing the validity of addtest-ing a third dye-labelled sample on an array, to further evaluate Alexa 594, we performed dual-target self hybridisations. Such an experiment allows a) to examine the effect of the new dye-label Alexa594 without the presence of a third dye-labelled sample (which may have unknown effects), and b) to examine a standard dual-target experiment in the same system as is used for the triple-target hybridisations. The third scan for each array was still performed although no material had been hybridised for this dye. In theory, this blank channel should produce no signal values, and deviations from this show potential "signal bleed" from one dye-label (or rather, the laser frequency it is scanned at) to another. Limitations of target sample material and printed arrays did not allow for the inclusion of more than two arrays per dual-target combination, which limits the statistical interpretability of these results. However, for the purposes of this study, they serve as supporting evidence and s x/
should identify gross problems with the inclusions of a third dye.
All arrays confirm the results obtained from analysis I: Cy5 is associated with more gene probes values in the low
expression range (Fig. 6). The dependence of log-ratio on log-intensity of a gene probe is also consistent with the tri-ple-target arrays, in that the use of Cy5 with either of the other two dyes leads to non-linear effects (Fig. 7). A posi-tive aspect of Cy5 are the very small signal values close to
Triple-target: data before normalisation
Figure 1
Triple-target: data before normalisation Each panel shows the data distribution for 5 individual samples (one per array) for a particular dye-label. Array names are numbered 1–5. Samples labelled with Cy5 have a wider distribution and generally lower centre than the other two channels, with high consistency across the 5 replicate arrays.
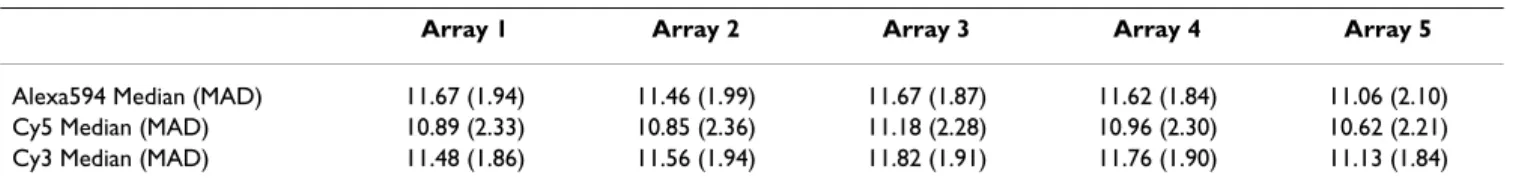
Table 1: Summary of individual dye-label samples (dye-channels)
Array 1 Array 2 Array 3 Array 4 Array 5
Alexa594 Median (MAD) 11.67 (1.94) 11.46 (1.99) 11.67 (1.87) 11.62 (1.84) 11.06 (2.10)
Cy5 Median (MAD) 10.89 (2.33) 10.85 (2.36) 11.18 (2.28) 10.96 (2.30) 10.62 (2.21)
Cy3 Median (MAD) 11.48 (1.86) 11.56 (1.94) 11.82 (1.91) 11.76 (1.90) 11.13 (1.84)
Median and median absolute deviation for log-transformed absolute expression values of individual samples (i.e. dye-label channels), prior to normalisation. 0 5 10 15 log2( s ignal )
prior to normalisation
Alexa594 Cy5 Cy3
1 2 3 4 5 1 2 3 4 5 1 2 3 4 5
Triple-target: Log-ratio data
Figure 2
Triple-target: Log-ratio data (A) Each panel shows the data distribution for 5 log-ratios of a particular dye-label combina-tion within an array before normalisacombina-tion. Triple-self hybridisacombina-tion log-ratios for all genes and dye-label combinacombina-tions should theoretically be centred on 0. Log-ratios involving the Cy5 labelled sample clearly show a larger log-ratio error and global shift away from 0 than the pairing of Cy3/Alexa594. This is consistent for all 5 replicate arrays. (B) Log-ratio distributions after removal of systematic global effects (dye-label incorporation, hybridisation quality, scan settings) by means of LoWeSS normal-isation followed by a median absolute deviation adjustment of scale. Interpreted globally (across all genes on an array), log-ratio distributions are now directly comparable across all arrays and dye-label combinations.
-6 -4 -2 0 2 log2( ra ti o) prior to normalisation
Cy5/Cy3 Cy5/Alexa Cy3/Alexa
Array: 1 2 3 4 5 1 2 3 4 5 1 2 3 4 5 Log 2 (ratio):
A
-4 -2 0 2 4 log2(ratio) Log 2 (ratio):Cy5/Cy3 Cy5/Alexa Cy3/Alexa
Array: 1 2 3 4 5 1 2 3 4 5 1 2 3 4 5
zero when it is the blank channel, which cannot be said for Alexa594 and Cy3, both of which result in low level signal values even if no sample has been hybridised to the array with the corresponding dye-label. This is probably an indication of the relative closeness of the dye-labels in the light frequency spectrum, leading for example to fluo-rescence of the Cy3 channel when the array is subjected with the laser frequency corresponding to Alexa594. How-ever, the level of signal obtained from these blank chan-nels is small in proportion to the hybridised chanchan-nels, with linear slopes between 0.02 and 0.03 and intercept signal values between 52 and 115. Given the assumption that this effect is also present in the triple-target hybridisa-tion, it does not present itself as a large or non-systematic problem. It does not cause signal interpretation problems
that are greater than those created by using two dyes with a non-linear relationship (i.e. Cy5 vs. Cy3) at comparable low levels of expression.
Single-target hybridisations
The hybridisation of only one dye-labelled sample to an array allows a closer investigation of signal "bleeding" from one dye-labelled sample to another, as described above. For this analysis, spike controls were included for all three dye-labels to allow calibration between channels, and their relation to the other gene probes on the array is shown in figure 8. Visual inspection of the images obtained from this experiment revealed that there is some visible signal bleeding between Alexa594 and Cy3, as well as between Alexa594 and Cy5. However, the results of this
Triple-target: data consistency between dyes
Figure 3
Triple-target: data consistency between dyes Relative standard deviation (or CV) of 3 values (one per dye-label) for each gene on an array plotted against the mean, showing intensity dependent variation of signal between the three dye-labels. Reproducibility of gene values across dye-labels begins to brake down at a low signal intensity of about 500. However, the last panel provides information about the distribution of CV values for each array, and it is evident that the majority of all genes on an array fall below 0.05 even before applying any normalisation methods.
Mean CV 2 4 6 8 10 12 14 16 0.0 0 .2 0.4 0 .6 0.8 1 .0 Mean CV 2 4 6 8 10 12 14 16 0.0 0 .2 0.4 0 .6 0.8 1 .0 Mean CV 2 4 6 8 10 12 14 16 0.0 0 .2 0.4 0 .6 0.8 1 .0 Mean CV 2 4 6 8 10 12 14 16 0.0 0 .2 0.4 0 .6 0.8 1 .0 Mean CV 2 4 6 8 10 12 14 16 0.0 0 .2 0.4 0 .6 0.8 1 .0 0.0 0 .2 0.4 0 .6 0.8 s20 s19 s18 s17 s10
Distribution of CV values per array
Mean Mean Mean
Mean Mean
Array: 1 2 3 4 5
CV CV CV
visual inspection differ from the numerical analysis, where Cy5 also has a similar level of bleed into the other channels (see below). This is most likely due to the image conversion algorithm interpreting pixels and features dif-ferently from the human eye. Although the number of replicates is not sufficient to draw statistical conclusions, the results are supporting those of the dual-target hybrid-isations. If Alexa594 is the hybridised sample, there is lit-tle to no signal present if scanning the blank Cy5 channel, whereas the scan for the blank Cy3 channel is resulting in consistent, but low levels of signal values (Fig. 9). The
same is true where Cy3 is the hybridised sample: the blank Cy5 channel exhibits little to no signal, Alexa594 results in a low level of signal values. However, the current stand-ard situation of dual-target hybridisations involving the combination of Cy5 and Cy3 appears to be subject to the same problem, as indicated by the single-target hybridisa-tion with Cy5. The scans for the two blank channels Alexa594 and Cy3 have a low level of signal of the same relative proportion as the blank channels in the other sin-gle-target and dual-target hybridisations. This would seem to show that it is not just the relative closeness of Cy3 and
Triple-target: MA plots before normalisation
Figure 4
Triple-target: MA plots before normalisation MA plots are a commonly used visualisation tool to show global trends in dual-target hybridisation data. Instead of only one possible combination per array, we have included the other two dye-label pairs. The X axis represents the intensity level, the Y axis the corresponding expression ratio for a gene between the two selected channels. A clustering of data points around the horizontal line is the theoretical result of any self-to-self hybridisation. A local scatterplot smoother function (LoWeSS) is fitted to the data to show global trends and to provide an intensity-depend-ent correction function to remove any bends in the global trend and adjust it so that the global trend approximates the theo-retical ideal. A bend in the global trend indicates that the log2-ratio differs with intensity level. This graph clearly shows that log2-ratios involving Cy5 have non-linear intensity-dependent trends which require normalisation, whereas the combination
Cy3/Alexa594 is already closer to ideal prior to normalisation.
10 15 20 25 30 35 5 5 10 15 20 25 30 35 5 10 15 20 25 30 35 10 15 20 25 30 35 5 5 10 15 20 25 30 35 5 10 15 20 25 30 35 10 15 20 25 30 35 5 5 10 15 20 25 30 35 5 10 15 20 25 30 35 10 15 20 25 30 35 5 5 10 15 20 25 30 35 5 10 15 20 25 30 35 10 15 20 25 30 35 5 5 10 15 20 25 30 35 5 10 15 20 25 30 35 0 -10 5 10 0 -10 5 10 0 -10 5 10 0 -10 5 10 0 -10 5 10 0 -10 5 10 0 -10 5 10 0 -10 5 10 0 -10 5 10 0 -10 5 10 0 -10 5 10 0 -10 5 10 0 -10 5 10 0 -10 5 10 0 -10 5 10 Cy5/Cy3 on array 1 Cy5/Cy3 on array 2 Cy5/Cy3 on array 3 Cy5/Cy3 on array 4 Cy5/Cy3 on array 5 Cy5/Alexa on array 1 Cy5/Alexa on array 2 Cy5/Alexa on array 3 Cy5/Alexa on array 4 Cy5/Alexa on array 5 Cy3/Alexa on array 1 Cy3/Alexa on array 2 Cy3/Alexa on array 3 Cy3/Alexa on array 4 Cy3/Alexa on array 5
Alexa594 in the light emission spectrum which results in signal bleeding to the other channel. The blank Cy5 chan-nel in a Cy3-labelled single-target hybridisation remains unaffected by signal bleeding, whereas in the reverse situ-ation the blank Cy3 channels is affected and shows some signal. In all of the above cases of signal bleed into other channels, this occurs at the intensity level around the detection threshold.
Evaluation of combined self hybridisation results
In order to provide quantitative indicators in addition to the graphical evaluation, tables 2 and 3 present compara-tive estimates of centrality and spread for log-ratios obtained from triple-self and self-to-self arrays after nor-malisation. There is good agreement in those estimates
between the triple-self and self-self arrays for each of the three combinations of dye-label log-ratios. The theoretical centre of the log-ratio distributions is 0, and this value is approximately met by the majority of gene probes on the array, with only small differences between the different dye-label combinations. The combination of Cy5/Cy3 is marginally worse in its approximation of the theoretical ideal, and this is likely to be the result of the LoWeSS normalisation having to make greater adjustments to low expressed genes.
In light of the triple-, dual- and single-target hybridisation experiments carried out, it is clear that the addition of Alexa 594 does not introduce negative effects that are not already present or smaller than in the commonly used
Triple-target: MA plots after normalisation
Figure 5
Triple-target: MA plots after normalisation Log-ratios for triple-target hybridisations after performing LoWeSS and MAD scale normalisation. All log2-ratios are now centred closely around 0, with a small amount of variance remaining at lower expression levels. Only individual outliers remain, and these are usually irrelevant if an experiment is replicated to a sufficient degree. 10 15 20 25 30 35 5 5 10 15 20 25 30 35 5 10 15 20 25 30 35 10 15 20 25 30 35 5 5 10 15 20 25 30 35 5 10 15 20 25 30 35 10 15 20 25 30 35 5 5 10 15 20 25 30 35 5 10 15 20 25 30 35 10 15 20 25 30 35 5 5 10 15 20 25 30 35 5 10 15 20 25 30 35 10 15 20 25 30 35 5 5 10 15 20 25 30 35 5 10 15 20 25 30 35 0 -10 5 10 0 -10 5 10 0 -10 5 10 0 -10 5 10 0 -10 5 10 0 -10 5 10 0 -10 5 10 0 -10 5 10 0 -10 5 10 0 -10 5 10 0 -10 5 10 0 -10 5 10 0 -10 5 10 0 -10 5 10 0 -10 5 10 Cy5/Cy3 on array 1 Cy5/Cy3 on array 2 Cy5/Cy3 on array 3 Cy5/Cy3 on array 4 Cy5/Cy3 on array 5 Cy5/Alexa on array 1 Cy5/Alexa on array 2 Cy5/Alexa on array 3 Cy5/Alexa on array 4 Cy5/Alexa on array 5 Cy3/Alexa on array 1 Cy3/Alexa on array 2 Cy3/Alexa on array 3 Cy3/Alexa on array 4 Cy3/Alexa on array 5
combination of Cy5 and Cy3. The triple-self hybridisa-tions have shown that, for low levels of signal, there is less inherent difference between Cy3 and Alexa 594 than there is between Cy5 and Cy3. The problem of differential dye-label incorporation in traditional dual-target Cy5/Cy3 hybridisations seems largely due to Cy5, at least where low-level signal values are concerned. Co-hybridisation of Cy3/Alexa594 does not present this problem and in theory does not require a non-linear approach to normal-isation (although there is no harm in using it). A non-linear normalisation like LoWeSS will make more of a numerical adjustment at this level of expression for the Cy5/Cy3 combination. However, following a successful normalisation, all three dye-label combinations have
comparable log-ratio data, with only minor differences between them (tables 2 and 3). In cases where low levels of signal are relevant to the question under study, these different levels of noise/error in the low expression regions must be accounted for in the usual way by biolog-ical replication of the experiment.
With the dual- and single-target hybridisations, we inves-tigated the issue of inherent signal bleeding between channels. The outcome of these has shown that in any hybridisations with Cy3 or Alexa 594, Cy5 will not suffer from this problem. On the other hand, both Cy3 and Alexa 594 will present this problem in any hybridisation involving Cy5. Although to our knowledge this has not
Dual-target: data before normalisation
Figure 6
Dual-target: data before normalisation For all dual-target hybridisations, these box-plots show the signal distributions across all genes for each individual dye-label sample. The non-hybridised "blank" dye-label channel has also been scanned and processed, in order to assess the effect of signal bleeding from one dye-label to another. The only truly blank scan is Cy5 for the Cy3/Alexa594 co-hybridisations. Co-hybridisations of the standard Cy5/Cy3 and new Cy5/Alexa594 dye-labels leads to small, but detectable levels of signal in the blank scan. Regarding spread of data, the dual-target hybridisation are identical to the results of the triple-target hybridisations, with a wider distribution and lower average of signal for Cy5.
0 5 10 15 0 5 10 15 0 5 10 15
Alexa594 Cy5 Cy3
Array: 1 2 1 2 1 2
Alexa594 Cy5 Cy3
Array: 3 4 3 4 3 4
Alexa594 Cy5 Cy3
Array: 5 6 5 6 5 6
Cy3+Cy5 labelled samples Alexa+Cy5 labelled samples
been investigated before, it may therefore be present in most 'standard' experiments with Cy5/Cy3 dual-target hybridisations. Our data do not show that this is either a serious or a non-systematic problem. It usually occurs below or at the safe detection level of an array (as identi-fied by negative control probes, data not shown), and contributes only a small amount of signal to one channel which is corrected together with other systematic dye-label and hybridisation differences during the normalisa-tion procedure.
Experimental design issues
The ability to directly compare two target samples to a third condition (be it treatment or reference) on one array
is of potentially great use for experiments that include multiple factors. However, such an approach also requires good planning of logistics and analysis. It is important to consider which dye is used to label a particular biological target, the logistics of using dye-labelling kits, and the allocation of dye-labelled samples to particular arrays [9,10]. Simple reference designs can be extended to include a third-dye label in a straightforward manner. However, loop-designs will require a larger extent of plan-ning to identify all necessary target sample combinations, with an inherent property of being inflexible in terms of adding more conditions/arrays or removing individual arrays due to hybridisation failure.
Dual-target: MA plots before/after normalisation
Figure 7
Dual-target: MA plots before/after normalisation (A) MA plots for each combination of dye-labelled samples in the dual-target arrays. The number of replicated experiments here is smaller (n = 2 arrays for each dye-label combination), but the trends are confirming that the performance of the dye-labels is very similar in the absence of a third dye-label on the array. All dual-target hybridisations involving Cy5 dye have higher levels of error in the log-ratios towards the lower end of the expres-sion spectrum. The combination Cy3/Alexa594 shows none or only small levels of this effect. (B) After LoWeSS and MAD scale normalisation, log-ratios for all dual-target combinations are broadly similar.
10 15 20 25 30 35 5 0 -10 5 10 0 -10 5 10 0 -10 5 10 0 -10 5 10 0 -10 5 10 Cy5/Cy3 on array 1 Cy5/Alexa on array 4 Cy5/Cy3 on array 2 Cy3/Alexa on array 5 Cy5/Alexa on array 3 Cy3/Alexa on array 6 0 -10 5 10 10 15 20 25 30 35 5 5 10 15 20 25 30 35 10 15 20 25 30 35 5 5 10 15 20 25 30 35 5 10 15 20 25 30 35 10 15 20 25 30 35 5 0 -10 5 10 0 -10 5 10 0 -10 5 10 0 -10 5 10 0 -10 5 10 Cy5/Cy3 on array 1 Cy5/Alexa on array 4 Cy5/Cy3 on array 2 Cy3/Alexa on array 5 Cy5/Alexa on array 3 Cy3/Alexa on array 6 0 -10 5 10 10 15 20 25 30 35 5 5 10 15 20 25 30 35 10 15 20 25 30 35 5 5 10 15 20 25 30 35 5 10 15 20 25 30 35
A
B
Dye-swap arrays also require consideration, since it is pos-sible to only perform a dye-swap on two of the samples, or on all three. For our study of mouse spermatogenesis [2], Cy3 and Cy5 dye-swaps were only performed on the
target samples of interest (wild type and Dazl-null mouse,
from different developmental time-points), while the ref-erence sample was always labelled with Alexa 594. This partial swap design was chosen to reduce the number of slides, cutting costs and time. To increase the reliability of the data, an extra level of replication was added by repeat-ing this process with a second independent pool of mice.
Although it could be argued that residual colour bias is introduced because the reference sample was not dye-swapped, in our experimental design this was not critical. The main focus of the experiment is on the relative changes in sample expression across the six developmen-tal time-points and not in comparison to the reference.
Data processing and analysis issues
With respect to data normalisation and analysis, current software packages or analysis modules are geared towards the analysis of single- or dual-dye experiments, providing
Single-target: spike controls in single-target arrays
Figure 8
Single-target: spike controls in single-target arrays Each panel shows the relation of spiked control probes (present for each dye-label) to other gene-probes on an array. Markers connected by lines indicate mean intensity level of genes on an array, corresponding markers not connected by lines indicate the mean of only the spiked control probes on the array. Spikes should be present at similar levels in all channels, although only one channel has been hybridised. As expected, spikes remain constant across all dye-labelled samples and blank channels. Normalisation constants based on the spike controls subset are small for all dye-label channels, and the variable hybridisation quality of the Cy3 arrays exceeds the adjustments that would be made by applying a subset normalisation. The consistency between the array replicates is still of sufficient degree to conclude that all single-target hybridisations result in small but measurable levels of signal for at least one of the two supposedly blank dye-label channels. Alexa hybridisations Cy5 hybridisations Cy3 hybridisations Array 1 2 3 1 2 1 2 16 12 8 4 0 16 12 8 4 0 16 12 8 4 0 Array Array Alexa594 Cy5 (blank channel) Cy3 (blank channel) Spikes: markers only
Alexa594 (blank channel) Cy5
Cy3 (blank channel) Spikes: markers only
Alexa594 (blank channel) Cy5 (blank channel) Cy3
Spikes: markers only
Log 2 (signal) Log 2 (signal) Log 2 (signal)
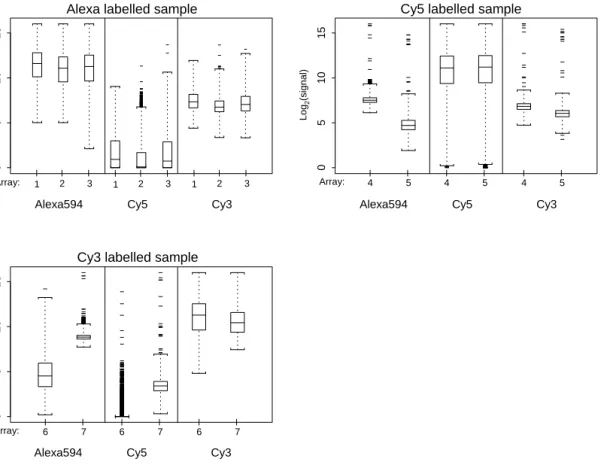
Single-target: data before normalisation
Figure 9
Single-target: data before normalisation For all single-target hybridisations, these boxplots show the signal distributions across all genes for each individual dye-label sample, before normalisation. Only one sample per array has been hybridised, but the other two scans on the "blank" channels were still performed at their respective wave-lengths. Similar to the dual-target hybridisations, the data suggest that dye-labelling with Alexa594 will result in a small but noticeable signal in the Cy3 signal wavelength, Cy3 will result in a similarly small signal in the Alexa594 wavelength. However, dye-labelling with Cy5 also leads to quantifiable levels of signal in the other two channels. This is not visible in the array images themselves, but quantification of false-colour images by eye will inherently be different from algorithm-based quantification.
Table 2: By-Gene medians and median absolute deviation
Triple-self hybridisations Median (MAD) Self-self hybridisations Median (MAD)
Cy5 / Cy3 0.024 (0.141) 0.0153 (0.0943)
Cy5 / Alexa594 0.013 (0.170) 0.0066 (0.1609)
Cy3 / Alexa594 -0.001 (0.145) 0.0068 (0.1486)
For each gene on the array, the median and median absolute deviation (MAD) of a particular log-ratio (e.g. Cy5/Cy3) across the 5 arrays * 2 spot replicates per array (effective n = 10) was obtained. The median value of all genes' median log-ratios and all genes' MAD is the basis of the estimate in this table. The effective n for the self-self hybridisations was 2 arrays per dye-label combination * 2 spot replicates per array = 4 measurements.
0 5 10 15 0 5 10 15 0 5 10 15
Alexa594 Cy5 Cy3 Array:
Alexa594 Cy5 Cy3
Array: 4 5 4 5 4 5
Alexa594 Cy5 Cy3
Array: 6 7 6 7 6 7
Alexa labelled sample Cy5 labelled sample
Cy3 labelled sample
1 2 3 1 2 3 1 2 3 Log 2 (signal) Log 2 (signal) Log 2 (signal)
little facility to deal effectively with three samples per array. Although either working around these problems or customising analyses could be time-consuming, in the practical application of the triple-target method we found that data processing works well if the triple-target results are split into two files; file one contains the signal and background measurements of the wild type and the refer-ence sample, and file two contains the signal and
back-ground measurements of the Dazl knock-out and the
same reference sample.
For the purposes of this paper, we have used existing methods for normalisation and visualisation. If triple-tar-get approaches are to be used on a regular basis, there is scope for developing statistical models that include all three dye-labels rather than multiple pair-wise combina-tions. This also applies to visualisation techniques. Natu-rally, assumptions applying to dual-hybridisation experiments still apply to our approach. The majority of genes in all samples need to be biologically unaffected by an experimental condition in order to allow global normalisation methods to be applied. Where this assump-tion is not met, control probes on the array are a necessity.
Discussion
In summary, there has been no evidence that the inclu-sion of Alexa594 as a third dye-label causes additional noise or unexpected results in the data. We used a theoret-ically well-controlled system of replicated triple-self hybridisations to evaluate any effect this addition may have on the expression of gene probes on an array. In con-junction with Cy5 and Cy3, this dye has shown similar levels of inherent quality of labelling and subsequent data acquisition. Standard normalisation methods work as well as they do for single- or dual-dye experiments, and the resulting data can be expected to allow identification of expression differences in a biological experiment, given sufficient levels of biological replication (as is necessary for most microarray experiments). We consider this novel triple-target hybridisation strategy to be useful for the analysis of complex multifactorial experiments. As such, it provides an additional option to the current choice of array experimental designs. On a solely technical basis there is little reason not to include a third dye-label
(although we have to limit this conclusion to Alexa594) for two-factorial experiments, the only prerequisite being a working laboratory protocol for using three dyes and good planning of logistics. Triple-target hybridisations can be performed within the same technological frame-work as current conventional approaches and, since they perform more than one absolute or relative gene expres-sion assay per array, constitute a possible solution to prac-tical constraints of finance, logistics or availability of biological sample material in the design of an experiment.
Conclusions
The use of triple-target microarray experiments is a valid addition to the experiment design toolbox. Although the method adds complexity to the experiment planning stage and the later data handling, this is offset by the benefits for studies where there are multiple experimental factors to consider, for example a combined time-series and treat-ment study. We limit this conclusion to the dye-labels and combination of biological system (adult mouse testes) and platform (custom spotted mouse array) used for this proof of concept, although in theory the same approach is usable in other experiments. We have developed in-house standards for the specifics of using three dye-labels for microarrays, but this may have to be adapted by other researchers working on different systems. Given further and more widespread use of the triple-target approach, it may prove a valuable tool that can be standardised for multiple biological systems and dye-labels.
Methods
Microarray preparation
An in-house created, subtracted and normalised adult mouse testis cDNA library consisting of 5,225 clones with an average insert size of 500 base pairs, plus 118 negative control (buffer spots) and 32 positive control spots, was deposited in duplicate (resulting in 10,750 individual fea-tures) onto glass slides. All were produced to the same standards and coated with poly-L-lysine according to a protocol available online at http://cmgm.stanford.edu/ pbrown/protocols/1_slides.html. A detailed description of the probe cDNA library generation and characterisa-tion, along with the microarray construccharacterisa-tion, is provided elsewhere [2]. In total, 18 arrays were used in this study.
Triple-self hybridisations Median pooled (MAD pooled) Self-self hybridisations Median pooled (MAD pooled)
Cy5 / Cy3 0.013 (0.3196) 0.014 (0.2028)
Cy5 / Alexa594 0.0112 (0.2508) 0.012 (0.2977)
Cy3 / Alexa594 -0.0029 (0.2594) 0.005 (0.2495)
Rather than summarising log-ratios on a per-gene basis first, log-ratios for each dye-label combination were pooled across all genes and arrays, median and MAD were then used to provide estimates for centrality and spread.
self hybridisations and 7 arrays for single-target hybridisa-tions. Target samples for all hybridisations were drawn from one pool of adult mouse testes RNA.
Tissue collection, labelling and hybridisation
Male C57BL/6 mice were housed under standard
condi-tions and fed ad libitum. Testes were removed,
immedi-ately frozen in liquid nitrogen and stored at -70°C until used for RNA extraction. Total RNA was isolated from individual adult mouse whole testes using Tri Reagent (Sigma, St. Louis, MO, USA), according to the manufac-turer's instructions. RNA quality was confirmed by spec-trophotometry, using an Ultrospec 3000 pro UV spectrophotometer (Amersham Biosciences, Freiburg, Germany) and denaturing gel electrophoresis. Array hybridisations were performed using Alexa Fluor 594 car-boxylic acid succinimidyl ester (Molecular Probes, Leiden, the Netherlands), and the Cy3- and Cy5-Monofunctional Reactive dyes (Amersham Pharmacia Biotech, Bucking-hamshire, UK). The three dyes were selected for their sep-arate spectral spacing to avoid cross-talk problems during image acquisition (Cy3 excitation 543 nm, emission 570 nm; Cy5 excitation 633 nm, emission 670 nm; Alexa 594 excitation 594 nm, emission 614 nm) and were captured by separate lasers using a ScanArray 4000 confocal laser
scanner (Packard BioScience). 15 µg of mRNA were
ami-noallyl labelled and resuspended in 27% deionised
For-mamide; 2.7 x SSC; 0.68%SDS, containing 8 µg of poly
dA(40–60) (Amersham Pharmacia Biotech,
Buckingham-shire, UK), 10 µg of yeast t-RNA (Sigma, Saint Louis,
Mis-souri, USA) and 4 µg of Cot-1 mouse DNA (Invitrogen,
Carlsbad, CA, USA). Hybridisation was carried out at 50°C for ~16 h in a humid CMT-Hybridisation chamber (Corning, Acton, MA, USA). Slides were washed for 15 min at 55°C with 2x SSC, 0.2% SDS, followed by 10 min at room temperature with 2x SSC and 10 min at room temperature with 0.2x SSC.
Image processing Image acquisition
Image files on all arrays were collected with a ScanArray 4000 scanner (Packard BioScience, Billerica, MA, USA). Multiple scans constituting a series of parameter settings were performed for each array and dye-label channel in order to allow for subsequent selection of the dataset best representing the array (i.e. a large dynamic range of data values without saturation of relevant spots)[11].
Image conversion
QuantArray microarray analysis software (version 3.0; Packard Bioscience) was used for quantification of scan images. Existing in-house standards and long-term experi-ence with this software enabled us to obtain a good
fine tuning for grid alignment added. Specifically, the cho-sen quantitation method was "Fixed Circle", since in our experience, the "Adaptive" method performs less well for the spot morphology on this array type. Background
under this method was estimated using the 5th to 55th
per-centile pixel intensities, signal was estimated using the
45th to 95th percentile; in both cases output quantification
was "Mean Intensity". No further filters or corrections were applied within QuantArray. This generates a
numer-ical dataset containing intensity values Ii and background
values Bi for each gene per array and channel. Data
trans-formation, LoWeSS normalisation, MAD (Median Absolute Deviation) scaling, visualisation and computa-tion of CVs, log-ratios and other statistics following on from here were performed using custom R http://www.r-project.org scripts.
Background noise
The numerical raw data obtained were evaluated for back-ground noise effects by means of 'signal maps' based on QuantArray signal and background values displayed by location on the array (data not shown). No background spatial effects were evident after application of the chosen QuantArray image processing algorithm. As a consequence, no additional data manipulation in form of a signal intensity correction was carried out.
Filtering
Any values Ii < 1 or Ii < Bi (see image conversion) were
removed from the dataset in order to facilitate analysis for the triple-self hybridisations. Note that for experiments on real biological systems it is recommended to follow more specific filtering procedures which determine suita-ble detection-thresholds or spot quality scores [12,13].
Normalisation
Microarray data are subject to data variation from other sources than the biological difference of interest between test samples. Hybridisation conditions, dye-label proper-ties, RNA extraction process etc. are such sources of varia-tion, and normalisation of data adjusts for these and is a required step. For this validation experiment, current methods for location and scale normalisations of log-ratio values were used [14-16]. Location normalisation meth-ods like LoWeSS are used to (non-linearly) normalise log ratios within an array, additional methods for normalisa-tion of scale are used to compare log-ratios across multi-ple arrays.
Log-ratio location normalisation
dye-label channels. The LoWeSS function estimating the
dependence of log-ratio y on log-intensity x for a given
array is denoted by y(ij) .
yij = log2 (Aij / Bij)
xij = log2 (Aij * Bij)
NLRij = yij - y(xi)
For the triple-target self-hybridisation arrays this method was used for three dye-label combinations per array: Cy5/ Cy3, C5/Alexa594 and Cy3/Alexa594.
Log-ratio scale normalisation
Median Average Deviation (MAD)
NLRij denotes the already location normalised log-ratios
for the jth spot on the ith array. SLRij denotes the scale
nor-malised log-ratios.
MADi = medianj (| NLRij - medianj (NLRij) |)
Data analysis
Three separate analyses were performed, one for the triple-target hybridisations, one for the dual-triple-target self-hybridisations and one for single-target self-hybridisations. They were performed on dye-label channels, i.e. data for each differently labelled sample on an array, and on ratio data, i.e. the relative values between two such dye-label
channels. Analyses were carried out on log2-transformed
intensities and ratios. In addition to graphical output for evaluation of data distributions and global effects of vari-ation, pooled and by-gene medians and median average distances (MAD) were computed for all log-ratios of inter-est across the replicate arrays, i.e. Cy5 vs. Alexa594, Cy3 vs. Alexa594 and Cy5 vs. Cy3.
Data availability
A complete MIAME-compliant catalogue of this data, including a complete listing of annotated gene content and clone sequences for this microarray, together with all raw and normalized expression measurement files, will be made available at the MRC Human Genetics Unit web site http://www.hgu.mrc.ac.uk/Research/Cooke/germ
line.html. Experimental data will also be made available on the EBI ArrayExpress database http://www.ebi.ac.uk/ arrayexpress.
TF performed data analysis and drafted the manuscript. YC carried out most of the laboratory work required for producing arrays and target samples. DR and HC provided the technology platform (array production and laboratory procedures) and advice relating to it, KM conceived of and planned the experiment implemented in the biological paper, produced the extensive clone library used for the arrays, performed all hybridisations and arrays scans and drafted parts of this manuscript.
Additional material
Acknowledgements
We thank Mary Taggart and Robert M. Speed who assisted us in sample col-lection. We are grateful to Klemens Vierlinger, Elisabet Gudmundsdottir and Alan Ross of the Scottish Centre for Genomic Technology and Infor-matics for their help on printing the microarrays. This research was funded by the UK Medical Research Council.
References
1. Yang YH, Speed T: Design issues for cDNA microarray experiments.Nat Rev Genet 2002, 3:579-588.
2. Maratou K, Forster T, Costa Y, Taggart M, Speed R, Ireland J, Teague P, Roy D, Cooke HJ: Expression profiling of the developing tes-tis in wild type and Dazl knockout mice.Mol Reprod Dev 2004,
67:26-54.
3. Hessner MJ, Wang X, Khan S, Meyer L, Schlicht M, Tackes J, Datta MW, Jacob HJ, Ghosh S: Use of a three-color cDNA microarray platform to measure and control support-bound probe for SLRij=NLRij MADi I i 1I MADi
=
∏
/( / )
Additional File 1
Tab-delimited ASCII data file. Column 1 refers to the sequential spot number in the original Quantarray output file. Columns 2–5 determine the spot position on the array by meta-row, meta-column, row and col-umn. Column 6 is the name of the gene probe (this is a text field and needs to be specified as such when importing into other software). Col-umns 7–8 indicate the precise center of the spot on the array. All subse-quent columns contain the raw data, s20 etc is the number of the slide, followed by the dye used for this column. In the manuscript, these have been numbered sequentially. An additional 'BG' indicates background measurements. Columns are arranged by slides, i.e. all three dye-label channels and corresponding background measurements are in adjacent columns.
Click here for file
[http://www.biomedcentral.com/content/supplementary/1471-2164-5-13-S1.txt]
Additional File 2
Tab-delimited ASCII data file. Description identical to additional file 1. Click here for file
[http://www.biomedcentral.com/content/supplementary/1471-2164-5-13-S2.txt]
Additional File 3
Tab-delimited ASCII data file. Description identical to additional file 1. Click here for file
[http://www.biomedcentral.com/content/supplementary/1471-2164-5-13-S3.txt]
Publish with BioMed Central and every scientist can read your work free of charge "BioMed Central will be the most significant development for disseminating the results of biomedical researc h in our lifetime."
Sir Paul Nurse, Cancer Research UK
Your research papers will be:
available free of charge to the entire biomedical community peer reviewed and published immediately upon acceptance cited in PubMed and archived on PubMed Central yours — you keep the copyright
Submit your manuscript here:
http://www.biomedcentral.com/info/publishing_adv.asp
BioMedcentral 4. Hessner MJ, Wang X, Hulse K, Meyer L, Wu Y, Nye S, Guo SW,
Ghosh S: Three color cDNA microarrays: quantitative assess-ment through the use of fluorescein-labeled probes.Nucleic Acids Res 2003, 31:e14.
5. Schuchhardt J, Beule D, Malik A, Wolski E, Eickhoff H, Lehrach H, Herzel H: Normalization strategies for cDNA microarrays.
Nucleic Acids Res 2000, 28:e47.
6. Yu J, Othman MI, Farjo R, Zareparsi S, MacNee SP, Yoshida S, Swa-roop A: Evaluation and optimization of procedures for target labeling and hybridization of cDNA microarrays.Mol Vis 2002,
8:130-137.
7. Richter A, Schwager C, Hentze S, Ansorge W, Hentze MW, Muck-enthaler M: Comparison of fluorescent tag DNA labeling methods used for expression analysis by DNA microarrays.
Biotechniques 2002, 33:620-630.
8. t'Hoen PAC, de Kort F, van Ommen GJB, den Dunnen JT: Fluores-cent labelling of cRNA for microarray applications.Nucleic Acids Res 2003, 31:e20.
9. Kerr K, Churchill G: Statistical design and the analysis of gene expression microarray data.Genet Res 2001, 77:123-128. 10. Churchill G: Fundamentals of experimental design for cDNA
microarrays.Nat Genet 2002, Suppl 32:490-495.
11. Forster T, Roy D, Ghazal P: Experiments using microarray tech-nology: limitations and standard operating procedures. J Endocrinol 2003, 178:195-204.
12. Wang X, Hessner MJ, Wu Y, Pati N, Ghosh S: Quantitative quality control in microarray experiments and the application in data filtering, normalization and false positive rate prediction.Bioinformatics 2003, 19:1341-1347.
13. Kooperberg C, Fazzio TG, Delrow JJ, Tsukiyama T: Improved back-ground correction for spotted DNA microarrays.J Comput Biol
2002, 9:55-66.
14. Quackenbush J: Microarray data normalization and transformation.Nat Genet 2002, Suppl 32:496-501.
15. Yang IV, Chen E, Hassemann JP, Liang W, Frank BC, Wang S, Sharov V, Saeed AI, White J, Li J, Lee NH, Yeatman TJ, Quackenbush J:
Within the fold: assessing differential expression measures and reproducibility in microarray assays.Genome Biol 2002,
3:0062.1-0062.12.
16. Yang YH, Dudoit S, Luu P, Lin DM, Peng V, Ngai J, Speed TP: Nor-malization for cDNA microarray data: a robust composite method addressing single and multiple slide systematic variation.Nucleic Acids Res 2002, 30:e15.