University of Nebraska - Lincoln
DigitalCommons@University of Nebraska - Lincoln
Final Reports & Technical Briefs from Mid-America
Transportation Center Mid-America Transportation Center
2013
Evaluation of J-turn Intersection Design
Performance in Missouri, Final Report
Praveen Edara Ph.D., P.E., PTOEUniversity of Missouri-Columbia
Carlos Sun Ph.D., P.E., JD
University of Missouri-Columbia
Sawyer Breslow
University of Missouri-Columbia
Follow this and additional works at:http://digitalcommons.unl.edu/matcreports Part of theCivil Engineering Commons
Edara, Praveen Ph.D., P.E., PTOE; Sun, Carlos Ph.D., P.E., JD; and Breslow, Sawyer, "Evaluation of J-turn Intersection Design Performance in Missouri, Final Report" (2013).Final Reports & Technical Briefs from Mid-America Transportation Center. 69.
®
The contents of this report reflect the views of the authors, who are responsible for the facts and the accuracy of the
Evaluation of J-turn Intersection Design
Performance in Missouri, Final Report
Report # MATC-MU: 179
Final Report
Praveen Edara, Ph.D., P.E., PTOE
Associate Professor
Department of Civil Engineering
University of Missouri-Columbia
Carlos Sun, Ph.D., P.E., JD
Associate Professor
Sawyer Breslow
Graduate Research Assistant
2013
A Coopertative Research Project sponsored by
U.S. Department of Tranportation-Research, Innovation and
Technology Innovation Administration
Evaluation of J-turn Intersection Design Performance in Missouri Final Report
Praveen Edara, Ph.D., P.E., PTOE Associate Professor
Department of Civil Engineering University of Missouri-Columbia
Sawyer Breslow
Graduate Research Assistant Department of Civil Engineering University of Missouri-Columbia
Carlos Sun, Ph.D., P.E., JD Associate Professor
Department of Civil Engineering University of Missouri-Columbia
A Report on Research Sponsored by Mid-America Transportation Center
ii
Technical Report Documentation Page
1. Report No. 25-1121-0003-179
2. Government Accession No. 3. Recipient's Catalog No.
4. Title and Subtitle
Evaluation of J-turn Intersection Design Performance in Missouri
5. Report Date December 2013
6. Performing Organization Code
7. Author(s)
Edara, P., Sun, C., Breslow, S.
8. Performing Organization Report No. 25-1121-0003-179
9. Performing Organization Name and Address Mid-America Transportation Center
2200 Vine Street PO Box 830851 Lincoln, NE 68583-0851
10. Work Unit No. (TRAIS)
11. Contract or Grant No.
12. Sponsoring Agency Name and Address
Research and Innovative Technology Administration 1200 New Jersey Ave., SE
Washington, D.C. 20590
13. Type of Report and Period Covered July 2012 – December 2013
14. Sponsoring Agency Code MATC TRB RiP No. 1250775 15. Supplementary Notes
16. Abstract
Research shows that a high percentage of crashes that take place on high-speed rural expressways occur at intersections with minor roads. One low-cost alternative design for improving the safety of at-grade intersections on such expressways is the J-turn. In the last few years, the Missouri Department of Transportation has converted some two-way stop controlled (TWSC) intersections into J-turns. This study evaluated the effectiveness of the J-turn intersection design in Missouri utilizing field studies, a public survey, crash analysis, and traffic conflict analysis. The field studies collected detailed video data at a J-turn site and a control site. The crash analysis included a statistically rigorous empirical Bayes before-after safety evaluation of five J-turn sites in Missouri. The J-turn design resulted in a 34.8% reduction in crash frequency for all crashes and a 53.7% reduction in crash frequency for all injury and fatal crashes. Both reductions were significant at the 95% confidence level. Annual disabling injury crashes and minor injury crashes decreased by 86% and 50%, respectively. None of the five sites exhibited a fatal crash following J-turn implementation. This five-site analysis showed that annual right angle crashes decreased from 6.3 to 1.3, a 80% reduction. One of the most severe crash types, the left turn, right angle crash, was completely eliminated by the J-turn. One conflict measure, average time to collision, was found to be four times higher at the J-turn site compared to the control TWSC site among minor road turning vehicles, indicating greater safety at the J-turn site. The average wait time at the J-turn site was half the wait time at the control site, while the average travel time at the J-turn site was approximately one minute greater than at the TWSC site. When the public was surveyed regarding trip time perceptions resulting from the J-turn, the majority said there was no adverse effect. A high percentage of minor road left turning and through movements at the J-turn site merged into the travel lanes within the first 400 feet of the acceleration lane. Public opinion regarding the J-turn at US 63 and Deer Park Rd was mixed. Frequent concerns raised by respondents included difficulty merging following the U-turn, improper use of acceleration and deceleration lanes, insufficient U-turn radius to accommodate large vehicles, and driver confusion.
17. Key Words
J-turns, RCUT, Superstreet, Alternative intersection designs
18. Distribution Statement 19. Security Classif. (of this report)
Unclassified
20. Security Classif. (of this page) Unclassified
21. No. of Pages 79
Table of Contents
Table of Contents ... iii
List of Figures ... iv
List of Tables ... v
Acknowledgments... vi
Disclaimer ... vii
Chapter 1 Introduction ... 1
Chapter 2 Literature Review ... 5
2.1. Operational Measures ... 5
2.2. Safety Measures ... 6
2.3. Design Guidance ... 8
2.4. Public Opinion Survey ... 9
Chapter 3 Methodology ... 11
3.1 Introduction ... 11
3.1.1 Field Studies... 12
3.1.1.1 Operational Measures ... 23
3.1.1.2 Safety Measures ... 27
3.1.1.3 Public opinion survey of the J-turn on US 63 ... 43
Chapter 4 Results ... 50
4.1 Introduction ... 50
4.1.1 Operational Measures ... 50
4.1.1.1 Travel Times ... 50
4.1.1.2 Wait times for minor road left turn vehicles ... 53
4.1.1.3 Acceleration Lane Use ... 55
4.1.1.4 Operational Measures Summary ... 59
4.1.2 Safety Measures ... 60
4.1.2.1 Time to collision ... 60
4.1.2.2 Gap acceptance ... 62
4.1.2.3 Crash Analysis ... 64
4.1.3 Survey Analysis ... 69
Chapter 5 Summary and Conclusions ... 75
List of Figures
Figure 1.1 Schematic of TWSC intersection ... 2
Figure 1.2 Schematic of J-turn intersection ... 3
Figure 3.1 Map showing locations of treatment and control sites. (Google 2013) 13
Figure 3.2 Control site location, US 63 and E. Calvert Hill Rd/E. Hinton Rd. ... 14
Figure 3.3 US 63 and Deer Park Rd./Rte. AB before J-turn implementation... 15
Figure 3.4 Entire J-turn segment at US 63 and Deer Park Rd./Rte. AB (Google 2013) ... 16
Figure 3.5 U-turn north of Deer Park Rd. (Google 2013) ... 17
Figure 3.6 US 63 and Deer Park Rd. J-turn intersection (Google 2013) ... 17
Figure 3.7 U-turn south of Deer Park Rd. (Google 2013) ... 18
Figure 3.8 Location of cameras, radars, and delineators at the J-turn site ... 20
Figure 3.9 Location of cameras, radars, and delineators at the control site ... 22
Figure 3.10 Time stamp at which vehicle arrives on the minor road (tt1) ... 24
Figure 3.11 Time stamp at which vehicle completes its movement (tt2) ... 25
Figure 3.12 Merging vehicle from the acceleration lane (camera 1) ... 28
Figure 3.13 Trailing vehicle on major road approaching the intersection (camera 2) ... 29
Figure 3.14 Time of minor road vehicle’s 1st merge ... 31
Figure 3.15 Time of major road vehicle’s arrival at minor road vehicle’s 1st merge point ... 31
Figure 3.16 Time of minor road vehicle’s 2nd merge ... 32
Figure 3.17 Time of major road vehicle’s arrival at minor road vehicle’s 2nd merge point ... 33
Figure 3.18Public opinion survey of the J-turn on US 63 ... 46
Figure 4.1 Cumulative distribution of travel times of major road left turns 51
Figure 4.2 Cumulative distribution of travel times of minor road left turns... 53
Figure 4.3 Cumulative distribution of wait times for minor road left turns ... 54
Figure 4.4 Right turn acceleration lane usage ... 56
Figure 4.5 U-turn acceleration lane usage ... 57
Figure 4.6 Measurements of lengths of acceleration and deceleration lanes at the J-turn site on US 63 and Deer Park Rd. ... 58
Figure 4.7 Time to collision for J-turn and TWSC sites on US 63 ... 61
Figure 4.8 Cumulative distribution of accepted time gaps for minor road left turns ... 63
Figure 4.9 Annual crash frequency by severity before and after J-turn (sum of all 9 sites) ... 65
List of Tables
Table 2.1 Summary of sample questions and responses from Hummer et al. (2010) ... 10
Table 3.1 Data collection information 19
Table 3.2 Characteristics of the J-turn sites included in the safety evaluation ... 35
Table 3.3 SPF Coefficients for Three- and Four-Leg Intersections with Minor-Road Stop Control for Total and Fatal-and-Injury Crashes (HSM, 2010). ... 40
Table 4.1 Travel time statistics for major road left turns 51
Table 4.2 Travel time statistics for minor road left turns ... 53
Table 4.3 Descriptive statistics of TTC measure ... 62
Table 4.4 Empirical Bayes-based before-after comparison of crashes ... 67
Table 4.5 Empirical Bayes-based before-after comparison of injury crashes ... 68
Table 4.6 Demographic information of survey respondents ... 70
Table 4.7 Responses to survey questions with Yes/No choices ... 71
Table 4.8 Responses to survey questions with five choices ... 72
Acknowledgments
The authors are thankful for the assistance provided by MoDOT staff John Miller, Mike Curtit, Jon Nelson, Nicole Hood, Trent Brooks, and Sally Oxenhandler for coordinating field data collection sites, providing design plans, and survey outreach. Additional thanks to Joseph Rickman and Leo Cologna for providing information on J-turns in the southwest district. The authors wish to acknowledge the contributions of Henry Brown, Kyoungmin Nam, Kevin
Koines, Zhongyuan Zhu, Igor Claus, and Andrew Robertson, who helped with data collection, as well as Kevin Koines, Tim Cope, Boris Claros, and Zach Osman, who assisted with the data processing and analysis.
Disclaimer
The contents of this report reflect the views of the authors, who are responsible for the facts and the accuracy of the information presented herein. This document is disseminated under the sponsorship of the U.S. Department of Transportation’s University Transportation Centers Program, in the interest of information exchange. The U.S. Government assumes no liability for the contents or use thereof.
Abstract
Research shows that a high percentage of crashes that take place on high-speed rural expressways occur at intersections with minor roads. One low-cost alternative design for improving the safety of at-grade intersections on such expressways is the J-turn. In the last few years, the Missouri Department of Transportation has converted some two-way stop controlled (TWSC) intersections into J-turns. This study evaluated the effectiveness of the J-turn
intersection design in Missouri utilizing field studies, a public survey, crash analysis, and traffic conflict analysis. The field studies collected detailed video data at a J-turn site and a control site. The crash analysis included a statistically rigorous empirical Bayes before-after safety evaluation of five J-turn sites in Missouri. The J-turn design resulted in a 34.8% reduction in crash
frequency for all crashes and a 53.7% reduction in crash frequency for all injury and fatal crashes. Both reductions were significant at the 95% confidence level. Annual disabling injury crashes and minor injury crashes decreased by 86% and 50%, respectively. None of the five sites exhibited a fatal crash following J-turn implementation. This five-site analysis showed that annual right angle crashes decreased from 6.3 to 1.3, a 80% reduction. One of the most severe crash types, the left turn, right angle crash, was completely eliminated by the J-turn. One conflict measure, average time to collision, was found to be four times higher at the J-turn site compared to the control TWSC site among minor road turning vehicles, indicating greater safety at the J-turn site. The average wait time at the J-J-turn site was half the wait time at the control site, while the average travel time at the J-turn site was approximately one minute greater than at the TWSC site. When the public was surveyed regarding trip time perceptions resulting from the J-turn, the majority said there was no adverse effect. A high percentage of minor road left turning and through movements at the J-turn site merged into the travel lanes within the first 400 feet of the acceleration lane. Public opinion regarding the J-turn at US 63 and Deer Park Rd was mixed.
Frequent concerns raised by respondents included difficulty merging following the U-turn, improper use of acceleration and deceleration lanes, insufficient U-turn radius to accommodate large vehicles, and driver confusion.
Chapter 1 Introduction
A large number of crashes occurring on high-speed rural expressways occur at their intersections with minor roads (Maze et al. 2010). The majority of crashes occurring at
intersections are right-angle crashes resulting from turning movements. For example, Maze et al. (2010) reported the proportion of right-angle crashes at rural high-speed expressways in
Minnesota (57%), Utah (69%), and Iowa (52%). Clearly, the issue of right-angle crashes is of concern to Midwestern states, since this crash type exhibits an elevated percentage of fatal and serious injuries, while rural expressways are a major component of the roadway network in these states. As a result, state departments of transportation (DOTs) are looking for ways to improve safety at at-grade intersections on rural expressway corridors. The NCHRP 650 report (Maze et al. 2010) presents three treatment strategies for DOTs to consider toward eliminating or reducing right-angle crashes on rural expressways. These strategies include: 1) the use of alternative designs, such as J-turns and offset T-intersections, that have fewer conflict points and less severe conflicts as a replacement for conventional two-way stop control (TWSC) intersections, 2) improving intersection sight distance and advice on gap selection for minor road traffic, and 3) cautioning the traffic on both minor and major roads of the upcoming intersection.
At a TWSC intersection on a four-lane divided highway, vehicles accessing the major highway from the minor road can make a left turn or through movement at the intersection by crossing the major road movements. Highways with high volumes or high speeds may make these movements unsafe to execute, and cause long delays. On the other hand, in a J-turn design, vehicles accessing the major highway from the minor road make a right turning movement and then use a U-turn at a downstream location. The major road vehicles accessing the minor road via a left turning movement may or may not have to use the U-turn for their movements. One
variation of the J-turn design allows for major road turning movements to occur at the intersection, but still requires the minor road movements to use the U-turn. An example of a TWSC and a J-turn intersection are shown in figures 1.1 and 1.2, respectively. Figure 1.1 represents the left-turning movement from the minor road at the TWSC intersection. Figure 1.2 represents the left-turning movement from the minor road at the J-turn intersection.
Figure 1.2 Schematic of J-turn intersection
The safety of the J-turn design stems from the elimination of severe high-risk conflict points. A conflict point occurs whenever there is the possibility for two vehicles to occupy the same position. According to NCHRP 650 (Maze et al. 2010), a TWSC intersection has 42 conflict points, while a J-turn intersection has 24 conflict points. Not only does the J-turn have fewer total conflict points, but it eliminates the most severe forms of conflict, i.e., crossing conflicts that result in right-angle crashes.
In the last few years, the Missouri Department of Transportation (MoDOT) has converted some TWSC intersections on high-speed, four-lane divided highways into J-turns. Despite their increased use in Missouri, the safety and mobility effects of J-turns have not been investigated and documented. This research project attempted to address the effectiveness of the J-turn design in Missouri. Specifically, the following objectives were accomplished in this project:
1) Field studies were conducted to collect video data of traffic movements at a J-turn site, and safety and mobility performance measures were analyzed. The analysis focused on several safety and operational performance measures, including conflicts, time to collision, travel times,
and wait times. The J-turn study site was located on a four-lane divided highway on US 63 at Deer Park Road, nine miles south of Columbia, Missouri. The annual average daily traffic at this location was 27,321 vehicles. The J-turn was opened to traffic in October, 2012. Prior to that time, the intersection operated as a TWSC intersection.
2) A traveler survey obtained the perceptions of travelers traversing the J-turn on US 63 and Deer Park Road. The survey focused on obtaining qualitative information on both mobility and safety.
3) Crash analysis was conducted using all J-turn sites in Missouri for which sufficient after-installation period crash data was available. Four additional J-turn sites were included in the crash analysis. Two crash analysis methods were utilized. First, a simple before-and-after comparison of crash data based on severity was conducted. The second approach used the empirical Bayes method to account for regression to the mean. The empirical Bayes approach is favored by the Highway Safety Manual (AASHTO 2010). A crash modification factor value was also computed for a J-turn intersection on a four-lane divided high-speed rural highway.
This report presents the results of the performance measurement of J-turns using video data, a traveler survey, and crash analysis. The report is organized as follows:
A review of relevant literature is presented in chapter 2. The study methodology,
including field studies, survey creation, and crash analysis, are discussed in chapter 3. The results are presented and discussed in chapter 4, and conclusions are drawn in chapter 5.
Chapter 2 Literature Review
Existing literature pertaining to the design and evaluation of J-turn intersections was reviewed. The review focused on four areas: 1) operational performance measures, 2) safety performance measures, 3) design guidance, and 4) a public opinion survey.
2.1 Operational Measures
Inman and Haas (2012) conducted an evaluation of a restricted crossing U-turn (RCUT) design in Maryland; the RCUT and Superstreet designs are alternative names for the J-turn design. The authors conducted field observations of an RCUT intersection on a rural, four-lane divided highway. Both mobility and safety performance measures were extracted from the field data. Mobility measures included travel times and acceleration lane usage. Safety measures included conflict analysis and weaving behavior. Since field data were not available for the pre-RCUT period, a control site along the same corridor was used for comparison. A control site was also utilized in the present study. Evaluated operational measures consisted of travel times and acceleration lane usage. Average travel times for the conventional intersection were 19 seconds and 28 seconds for through and left-turn movements from the minor road, respectively. The average travel times for the RCUT intersection were 83 seconds and 80 seconds for through and left-turning movements, respectively. Thus, the additional travel time at the RCUT intersection was approximately one minute higher than at the control intersection. This increase in travel time was due to the additional 4,000 ft. traversed to complete the movement. The travel times
included wait times for gaps in the through traffic. There was also little to no wait time for a gap in traffic, creating a reduction in wait time in comparison to the TWSC without an acceleration lane (Inman and Haas 2012).
The extent of the utilization of the acceleration lanes by the right turning vehicles from minor road and the U-turn vehicles were also extracted from field data. The intent of studying acceleration lane usage was to justify its necessity for future designs. If traffic volumes on the major road are low, minor road vehicles can merge directly into the travel lanes, thus, not necessitating an acceleration lane. To determine acceleration lane usage, the acceleration lane was divided into five merging zones for vehicles making a right turn from the minor road, and three merging zones for vehicles accessing the major road from the U-turn acceleration lane (Inman and Haas 2012). The analysis found that acceleration lanes were being used by a majority of vehicles; thus, both the U-turn and right turn acceleration lanes were required for future
RCUT designs in Maryland.
A study by Hummer et al. (2010) evaluated benefits of the Superstreet design in North Carolina. The operational analysis was conducted for signalized Superstreet designs only, while the statistical analysis of crashes was performed for unsignalized Superstreet designs. The analysis focused on measuring travel times using GPS units installed in probe vehicles. The probe vehicles were driven several times during a 90-minute period. This procedure differed from the Inman and Haas (2012) study, which derived travel times by processing the trajectories of vehicles recorded on video. The sample size of travel time measurements obtained via video processing was higher than that obtained by the probe vehicle measurement technique. However, probe vehicles were intended only to provide average travel times, while the processing of trajectories from video data is time consuming.
2.2 Safety Measures
J-empirical analysis of crashes before and after J-turn installation. Inman and Haas (2012) reported using lag as a conflict measure in lieu of the time to collision measure. Lag is the time difference between the arrival of a merging vehicle and the arrival of the following vehicle on the mainline at the same crossing point. If the following vehicle does not change speed, i.e., neither
accelerates nor decelerates, lag is the same as the time to collision. Time to collision (TTC) is another conflict measure used to study intersection safety (MacCarley 2011). TTC is defined as the time it takes for a collision between two vehicles to occur if the vehicles do not take an evasive action. The equation for computing TTC was presented in MacCarley (2011). Higher TTC values indicate safer conditions.
Crash analysis was reported in Hummer et al. (2010) and Inman and Haas (2012). Both studies conducted two levels of crash analysis—a simple before-and-after comparison of crash frequency for different severities and a more thorough empirical Bayes (EB) method
recommended by the Highway Safety Manual (HSM 2010). The EB method for assessing the safety effectiveness of a treatment is documented in chapter nine of the HSM. Chapter 11 of the HSM discusses the predictive method for rural multilane highways. The crash modification factors applied to the predicted crash frequency are discussed in chapter 14 of the HSM. The EB method, prediction models, and associated crash modification factors and calibration factors are discussed in section 3 of the current report.
Crash analysis using the EB method revealed a 44% reduction in total crash frequency for J-turns in Maryland (Inman and Haas 2012) and a 27.2% reduction in North Carolina. In terms of reduction in crash severity, Maryland J-turns witnessed 70% and 42% reductions in fatalities and injury crashes, respectively. In North Carolina, J-turns resulted in a 51% reduction in fatal and injury crashes.
2.3 Design Guidance
Existing guidance on the J-turn design was reviewed. The AASHTO Green Book (AASHTO 2011) does not contain guidance specific to the J-turn intersection, but provides general design guidance that may apply to the J-turn. Chapter 9 of the Green Book presents design guidance for intersections. Auxiliary lane guidelines for intersections can be used as a starting point to develop design standards for acceleration and deceleration lanes in a J-turn intersection design. The recommended minimum lane width for auxiliary lanes is 10 ft., but it is desirable to have the same width as the adjacent through lanes. A shoulder next to the auxiliary lane must have a minimum width of 6 ft., and it is desirable to keep it the same width as the shoulder next to the through lanes. Other design factors for auxiliary lanes are subject to change based on varying traffic conditions pertaining to speed, volumes, truck percentage, capacity, highway classification, right-of-way availability, maintenance, and frequency of intersections (AASHTO 2011).
The use of deceleration lanes could be considered when designing J-turn intersections. The design requirements for deceleration lanes at intersections are also provided in chapter 9 of the Green Book. These requirements may be considered as the minimum requirements for deceleration lanes at a J-turn. The recommended design requirements for the deceleration lane are shown in Table 9-22 on page 9-126 of the Green Book (AASHTO 2011). For example, a deceleration lane length of 820 ft. is recommended for a design speed of 70 mph (AASHTO 2011).
The Green Book provides additional considerations for determining deceleration lane lengths bases on expected maximum queues and storage, number of turning vehicles, and
Green Book, as is guidance on the location and design of U-turn median openings, in section 9.9.4; additionally, Table 9-30 on page 9-166 discusses recommended median widths based on the design vehicle. The suggested distance for the U-turn is 660 ft. from the main intersection, and does not vary with the speed limit (AASHTO 2011).
The Alternative Intersections and Interchanges Informational Report (FHWA 2009) provides additional information on the crossover spacing for J-turns. It reports that the minimum spacing between the main intersection and crossover in Michigan is 660 ± 100 ft., similar to the AASHTO guidance for median U-turns. In North Carolina the crossover spacing value is 800 ft.
Guidance on acceleration lanes is available in chapter 10, “Interchanges,” of the Green Book. Although J-turns are typically built on multilane highways, not freeways, the only
guidance available for acceleration lanes in the Green Book is for those provided at interchanges. Table 10-3 on page 10-110 of the Green Book shows acceleration lane lengths for various design speeds. For example, for vehicles to accelerate from stop condition to a design speed of 75 mph, the necessary length of the acceleration lane is 1,620 ft. (AASHTO 2011).
2.4 Public Opinion Survey
The opinions of travelers who navigate a J-turn are essential toward understanding how the design is being used, and to reveal any perceived safety or operational concerns. Despite the importance of J-turns, only a few studies have conducted surveys to obtain the opinions of travelers. Hummer et al. (2010) was one of the few studies that conducted a survey of residents living near a J-turn site who drove the J-turn on a regular basis. A household mail survey focused on navigation, travel time, and safety measures. A summary of the main findings for
unsignalized superstreet intersections is presented in table 2.1. Similar questions and concepts were applied to the survey used for the Missouri J-turn on US 63. As shown in table 2.1, drivers
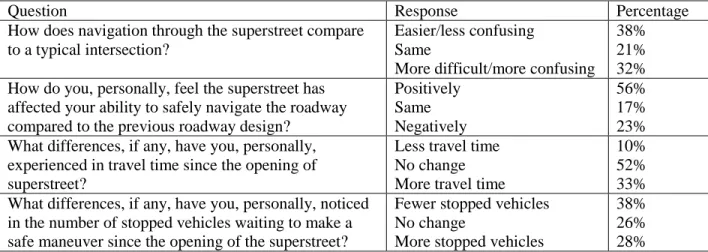
in Hummer et al. were divided in terms of the question regarding navigation, but drivers felt safer with the J-turn by a margin of over two-to-one. Over half of the respondents did not sense a change in travel time, but a third did believe the travel time was longer.
Table 2.1 Summary of sample questions and responses from Hummer et al. (2010)
Question Response Percentage
How does navigation through the superstreet compare to a typical intersection?
Easier/less confusing Same
More difficult/more confusing
38% 21% 32% How do you, personally, feel the superstreet has
affected your ability to safely navigate the roadway compared to the previous roadway design?
Positively Same Negatively 56% 17% 23% What differences, if any, have you, personally,
experienced in travel time since the opening of superstreet?
Less travel time No change More travel time
10% 52% 33% What differences, if any, have you, personally, noticed
in the number of stopped vehicles waiting to make a safe maneuver since the opening of the superstreet?
Fewer stopped vehicles No change
More stopped vehicles
38% 26% 28%
Chapter 3 Methodology 3.1 Introduction
This section discusses the field study procedures and computation of performance measures for the current study. Three main procedures utilized in this project included: 1) original data collection through field studies to measure performance, 2) before-after analysis of crash data at multiple J-turn sites in Missouri, and 3) a survey of motorists. Field studies were conducted at a J-turn site on US 63 and Deer Park Rd, and at a control site with a two-way stop control, also on US 63 at Calvert Hill Rd. These two locations were recommended by the Missouri DOT technical review panel for the project, since both locations shared similar
operational and geometric characteristics. Several safety and operational performance measures were computed from the field data. The set of measures included: time to collision (TTC), time to intersection (TTI), gap acceptance (GA), travel times (TT), wait times (WT), and acceleration lane usage. The conflict measures, TTC, TTI, and GA, are a unique contribution of this study, as they have not been used in the evaluation of J-turns in previous research. These measures
expanded upon the use of the lag conflict measure in Inman and Haas (2012). The field studies were carefully designed to ensure that data required for each measure were collected. For example, the number of video cameras, speed guns, their positioning, and orientations were all carefully determined. The details of the field studies are presented in section 3.1.1.
The safety effects of J-turns were also assessed using crash data. Five J-turn sites in Missouri were included in the analysis. The before-after analysis of crashes using the empirical Bayes method is discussed in section 3.1.1.2.4.
A public opinion survey was conducted to obtain the perceptions of motorists who have driven the J-turn site on US 63 and Deer Park Rd. The survey was carefully designed to obtain
information on driving behavior, driver confusion, and driver perceptions of operational and safety effects of the J-turn. The survey design, deployment, and analysis of responses are presented in section 3.1.1.3.
3.1.1 Field Studies
The project timeline did not allow for the collection of data from the period preceding the installation of the J-turn at the US 63 and Deer Park Rd. intersection. Thus, a control site on the same US 63 highway corridor was selected for comparison. This control site approach is similar to that of previous studies, including Inman and Haas (2012). The control site was the
intersection of Calvert Hill Rd/Hinton Rd and US 63, which operated as a traditional two-way stop control (TWSC) intersection. This site, recommended by MoDOT, was chosen due to its similarity to the treatment site in terms of geometry, access to services, and driving population. Both sites occurred on a four lane divided highway with a speed limit of 70 mph. The treatment site, US 63 at Deer Park Rd, also operated as a two-way stop control prior to the J-turn treatment. The AADT for the J-turn site was 27,321, and 17,217 for the control site. A map of the treatment and control intersections is shown in figure 3.1. In the figure, location A is the J-turn site, and location B is the TWSC control site. Between these intersections lies the urban city of Columbia, Missouri. Figure 3.2 displays the TWSC intersection that was used as the control site. The green arrows show the left turn paths of the minor road to the major highway. Figure 3.3 displays the TWSC intersection at the treatment site before J-turn implementation. The figure also shows the construction of the new southbound US 63 lanes in the middle, which were unopened to traffic.
Figure 3.2 Control site location, US 63 and E. Calvert Hill Rd/E. Hinton Rd (Google 2013)
E. Calvert Hill Rd.
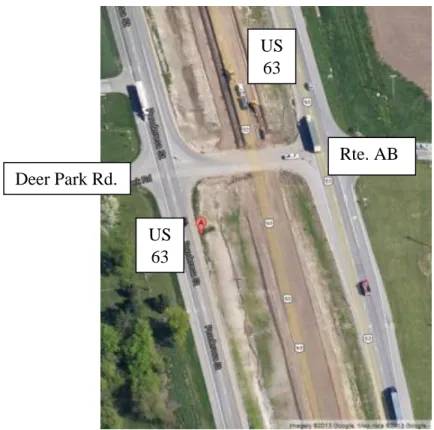
Figure 3.3 US 63 and Deer Park Rd./Rte. AB before J-turn implementation (Google 2013)
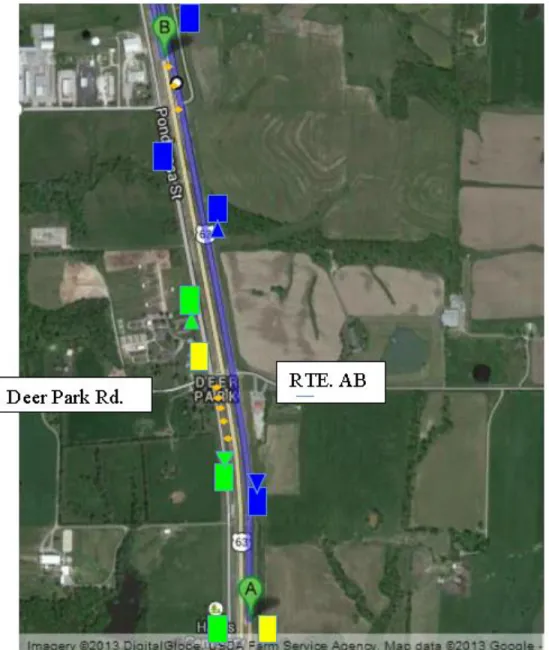
Figure 3.4 shows the overall segment of the J-turn, and figures 3.5-3.7 show the
individual components. Figure 3.4 shows the footprint of the entire J-turn intersection covering both U-turns and the main intersection; in the figure, point A is the location of the U-turn south of Deer Park Rd, and point B is the location of the U-turn north of Deer Park Rd. The green arrows show the left turn paths from the minor road to the major highway via a U-turn in both directions. Figure 3.5 is a close up view of the U-turn at point B; the figure shows a deceleration lane before the U-turn and an acceleration lane after the U-turn. Figure 3.6 is the main
intersection at Deer Park Rd after J-turn implementation; the figure shows that no median crossovers are permitted. Figure 3.7 is a close up of the U-turn at point A; the figure is similar to figure 3.5, and shows both deceleration and acceleration lanes.
Rte. AB Deer Park Rd. US 63 US 63
Figure 3.5 U-turn north of Deer Park Rd (Google 2013)
Figure 3.7 U-turn south of Deer Park Rd. (Google 2013)
The J-turn intersection was opened to traffic in October of 2012. Video data was collected at the treatment and control sites in November, 2012 and May, 2013. The duration of video data used for each performance measure is shown in table 3.1; as illustrated in the table, the critical peak hour time periods were collected.
Table 3.1 Data collection information
Measure Location Time Collected Date Collected
Travel time J-turn and Control AM peak (7 am-9 am),
PM peak (4 pm-6 pm)
November 2012
Wait time J-turn and Control AM peak (7 am-9 am) November 2012
Acceleration lane usage
J-turn AM peak (7 am-9 am),
PM peak (4 pm-6 pm)
November 2012, May 2013
TTC J-turn and Control AM peak (7 am-9 am) May 2013
Gap Acceptance J-turn and Control AM peak (7 am-9 am),
PM peak (5 pm-7 pm)
November 2012, May 2013
The locations of cameras, speed radars, and delineators at the J-turn site are shown in figure 3.8. The green rectangles in the figure represent the cameras that collected data relevant to TTC and acceleration lane use. The green triangles next to the green rectangles represent the radar guns used to collect speeds for TTC for Deer Park Rd. The yellow rectangles represent cameras that were used to collect travel times from Deer Park Rd. The blue rectangles represent cameras that were used to collect TTC for Rte. AB. The blue triangles represent the radar guns used to collect speeds for the TTC measures from Rte. AB. The orange diamonds represent the delineators used to mark the acceleration lanes.
For the J-turn site, the following equipment was utilized. To collect TTC data, three cameras and two radars were used for both directions. To collect travel time data, two cameras were used to capture the origin and destination of each turning manuever. To collect acceleartion lane data, one camera was used for each direction.
For the control site, the following equipment was used. To collect travel times, one camera was used. To collect TTC data, one camera and one radar gun were used in each direction. Wait time data for both sites were extrapolated from the travel time video data.
Figure 3.9 (next page) shows the locations of cameras and radars at the control site. The red rectangle represents the camera that was used to capture travel times and wait times. The yellow rectangles and triangles represent the cameras and radars that were used to capture data needed for the TTC measure.
3.1.1.1 Operational Measures
Data was collected for three operational measures: travel times, wait times, and
acceleration lane use. The computations of these measures from video data are discussed next. 3.1.1.1.1 Travel Times (TT)
The travel times of vehicles turning left from the major road to the minor road were measured for the J-turn and TWSC. For TWSC, travel time included the wait time at the intersection and the time taken to cross two lanes on the mainline. For the J-turn, travel time included the time taken to traverse the distance between the intersection and the U-turn, and the time taken to traverse the distance between the U-turn and the minor road. Due to the additional distance traversed in the J-turn, travel times were expected to be greater than at the TWSC. Travel times were also measured for vehicles turning left from the minor road to the major road at both the J-turn and TWSC sites. The green arrows shown in figure 3.2 and 3.4 clearly contrast the left turn paths taken by the minor to major road left turn vehicles in the J-turn versus the TWSC.
A video camera was set up at the control site intersection, as shown in figure 3.9. The camera is represented by a red rectangle. The view captured all movements in and out of the intersection, and captured the variables needed to calculate TT. The following equation was used to calculate the TT measure:
TT = tt2-tt1 (3.1) where,
tt1 - time at which the vehicle arrives at the intersection;
tt2 – time at which the vehicle completes its turning movement.
This equation was used to collect travel times for left turn movements from the minor road to the major road and from the major road to the minor road. In figure 3.10, the white van shown sitting at the stop sign is attempting to make a left turning maneuver from the minor road to the major road. When the vehicle arrived at the stop sign, the time stamp, shown as 8:04:04, was recorded as the value of tt1. Figure 3.11 displays the screenshot at the point at which the
white van has completed its left turning maneuver. The time stamp shown as 8:04:18 was recorded as the value of tt2. Using equation 3.1, the value for travel time can be computed: tt2 –
Figure 3.11 Time stamp at which vehicle completes its movement (tt2)
Collecting video data at the J-turn location required a larger viewing area and multiple camera locations to obtain the necessary timestamps tt1 and tt2. Travel times were collected for
the left turn movements from the major and minor roads. The travel time values collected for both maneuvers differed from the control due to the geometry of the alternative J-turn design. For the left turning maneuver from the minor road to the major road, vehicles must turn right then access a U-turn downstream to complete the movement. Similarly, the left turning
movement from the major road must continue past the intersection and utilize the downstream U-turn, travel in the opposite direction, then turn right into the minor road.
3.1.1.1.2 Wait Times (WT)
Wait times (WT) represent the amount of time a vehicle must wait before initiating a turning movement. The J-turn site had an acceleration lane for minor road turning movements, thus reducing vehicle wait time. Wait times were obtained for the left turning movements from
the minor road. Unlike the analysis for the travel time measure, the wait time measure required only one camera recording the minor road movements. The equation used to calculate wait time was as follows:
WT = t1 – tt1 (3.2)
where,
t1 = time at which vehicle departs the stop bar on the minor road to complete the turning
maneuver;
tt1 = time at which vehicle arrives at the intersection.
3.1.1.1.3 Acceleration Lane Use
Not all J-turn designs implemented in Missouri had acceleration lanes for minor road turning vehicles or vehicles merging from the U-turn onto the major road. The J-turn design on US 63 and Deer Park Rd had acceleration lanes for both movements—turning right onto the minor road and completing the U-turn. Thus, this site provided a unique opportunity to analyze the use of acceleration lanes. The proportion of vehicles merging at different lengths of the acceleration lane was extracted using strategically placed video cameras and delineators. The video data were used to extract two variables: a vehicle’s final destination and the point at which the vehicle merged into the right lane on the major road from the acceleration lane.
The acceleration lane that extended from the minor road (Deer Park Rd) intersection on southbound US 63 was 1,000 ft. long from the intersection to the taper. To determine where a vehicle was merging, the acceleration lane was divided into five merging zones, 200 ft. long
63 was approximately 750 ft. long from the U-turn to the beginning of the taper. The limited shoulder width next to the acceleration lane did not allow for the safe deployment of delineators for this acceleration lane. Thus, existing traffic signs, pavement markings, and reflectors were used to define three merging zones. The first zone included the first 120 ft. from the U-turn; the second zone included the distance between 120 ft. and 480 ft.; and the third zone included the area between 480 ft. to the beginning of taper.
3.1.1.2 Safety Measures
Video monitoring was also used to obtain safety measures. The methods used to extract three safety measures—time to collision at the J-turn, time to intersection at the TWSC, and accepted gaps—are presented next.
3.1.1.2.1 Time to Collision (TTC)
Time to collision, or, TTC, is a surrogate safety measure that was developed and used originally by Hayward (Hayward 1971; Minderhoud and Bovy 2001) to evaluate the interactions between vehicles. The equation developed by Hayward was developed to relate the difference in speed between nearby vehicles with collision risk (MacCarley 2011):
TTC = (xi-1-xi-li-1)/ (vi-vi-1), vi>vi-1 (3.3)
where,
xi-1 = the position of the lead or merging vehicle;
xi= the position of the trailing or mainline vehicle;
li-1 = length of the trailing vehicle (20 ft. was used as the average vehicle length);
vi-1 = velocity of the lead or merging vehicle;
vi = velocity of the trailing or mainline vehicle.
One camera was used to record the speed displayed on the radar gun and the
corresponding time stamp for the leading vehicle merging from the acceleration lane into the right lane of the major road. Figure 3.12 shows an example of a merging vehicle whose speed (vi), position (xi), and time stamp could all be obtained from the view. A second camera was
deployed upstream of the intersection to detect the speed and position of mainline vehicles approaching the intersection. A view from this camera is shown in figure 3.13. Vehicle speed (v i-1), position (xi-1), and time stamp can be obtained for the trailing vehicle from this camera
Figure 3.13 Trailing vehicle on major road approaching the intersection (camera 2)
A third camera was deployed to record the type of movement made from the minor road. This camera footage was used to separate minor road vehicles into right turns, left turns, and through movements. If a minor road vehicle continued to travel on the major road past the U-turn, the movement was counted as a right turn. It was important to identify the minor road movements to allow for a fair comparison with the control TWSC site. This is because a minor road right-turning vehicle has no intention of merging quickly to make the U-turn.
3.1.1.2.3 Gap Acceptance
Gap acceptance is a conflict measure defined as the gap accepted by a merging vehicle. For through and left turn movements originating from the minor road, the J-turn replaced the crossing conflicts across the major road by merging conflicts. The crossing gap at the control site involved a vehicle crossing both lanes of the major roadway in the same direction at one time, while the merging conflict occurred sequentially as a vehicle traveled from the minor road to the major right lane, from the major right lane to the left lane, and finally to the U-turn. Even though merging and crossing gaps are different types of gaps, they both reflect the willingness of a driver to make a maneuver in light of a potential conflict.
The accepted gaps were measured by processing video data for all vehicles merging from the acceleration lane into the right through lane and from the right through lane to the left
through lane. A higher accepted gap enhances the safety of a merging maneuver safer. The accepted gaps were analyzed for both the AM and PM peak periods (see table 3.1).
The U-turn movements from Deer Park Rd to southbound US 63 and from Rte. AB to northbound US 63 were investigated. The steps involved in determining the accepted gap for a vehicle moving from Deer Park Rd to US 63 are shown in figures 3.14-3.17. The through and left-turning vehicles from the minor road that made two lane changes (from the acceleration lane to the right lane and from the right lane to the left lane) and accessed the deceleration lane to utilize the U-turn were of interest. Figure 3.14 shows a minor road vehicle merging from the acceleration lane into the right through lane. The time at which the next major road vehicle arrived at the merge point in the right through lane is shown in figure 3.15. The gap acceptance for the first merge was calculated as:
Gap Acceptance1 = t2 – t1, (sec) (3.5)
where,
t1 = time at which the minor road vehicle merged from acceleration lane to the right
through lane;
t2= time at which the next mainline vehicle in the right through arrived at the merge
point.
For example, the gap acceptance of the merging vehicle shown in figures 3.14 and 3.15 was measured using equation 3.5 as Gap Acceptance = t – t = (7:21:56) – (7:21:53) = 3
Figure 3.14 Time of minor road vehicle’s 1st merge
Figure 3.15 Time of major road vehicle’s arrival at minor road vehicle’s 1st merge point
The gap acceptance for the second merge, from the right through lane to the left through lane, was measured in a similar way as:
Gap Acceptance2 = t4 – t3, (sec) (3.6)
where,
t3 = time at which the minor road vehicle merged from the right through lane to the left
through lane;
t4 = time at which the next mainline vehicle in the left through lane arrived at the merge
point.
For example, the second merge for the vehicle previously described in figure 3.14 is shown in figure 3.16. The gap acceptance is calculated using the time stamps recorded in figures 3.16 and 3.17 using equation 3.6 as Gap Acceptance2 = t2 – t1= (7:21:59) – (7:21:55) = 4
seconds.
Figure 3.17 Time of major road vehicle’s arrival at minor road vehicle’s 2nd merge point
The minor road through and left turn movements at the control TWSC intersection cut across the major road through movements. The gaps accepted for crossing the major road traffic were also calculated using the time stamps recorded in the video data. However, the gap
acceptance values obtained for the J-turn site could not be compared with those obtained for the control TWSC site since the type of conflicts were entirely different. The conflicts assessed for the J-turn were merging conflicts, whereas the conflicts assessed for the TWSC intersection were crossing conflicts.
3.1.1.2.4 Crash Analysis
A safety evaluation was performed by analyzing the crashes occurring before and after the implementation of the J-turn design. The safety evaluation was performed using two methods. The first method compared the crash frequency for different severity levels and types for the before and after period. The second method was more statistically rigorous, and utilized the empirical Bayes method (Persaud et al. 2001).
A total of five J-turn sites in Missouri were included in the safety evaluation. Four other J-turn sites that were constructed on a new rural expressway, on US 65, were not included in the
crash analysis since there was no before-treatment data. Table 3.2 shows information on each J-turn, including the location, intersection geometry, AADT, speed limit, duration of before and after periods, and total number of crashes in the before and after periods. All five sites were located in rural areas with major road speed limits of 65 mph or higher. The major road AADT ranged between 10,326 and 25,862 vehicles per day. Four of the five sites were four-leg intersections, and one was a three-leg intersection.
Table 3.2 Characteristics of the J-turn sites included in the safety evaluation
J-Turn Location Year Open Average AADT Before Average AADT After Type Speed Limit Before Period After Period Before period Crashes After period Crashes
Maj Min Maj Min 3/4
leg Mph Years Years All Injury All Injury
US 63 & Deer Park Rd. 2012 25807 1059 26470 987 4-leg 70 3 1 40 7 6 0 US 54 & Honey Creek Rd. 2011 18848 508 18922 505 4-leg 65 3 2 8 6 5 1 US 54 & RT E 2011 15541 1389 15591 1340 4-leg 65 3 2 18 5 2 1 MO 13 & Old MO 13 2009 10630 447 10630 447 4-leg 65 3 3 9 4 9 3 Rte. M & Old
Lemay Ferry Rd. 2007 10326 434 10326 434 3-leg 65 3 3 11 5 5 3
The crash frequency per year was computed for each site by dividing the total number of crashes by the duration. Crash frequencies were computed for four severity levels:
1) Property Damage Only (PDO)
2) Minor Injury (MI)
3) Disabling Injury (DI) 4) Fatality (F)
The effects of the J-turn on specific crash types were also analyzed. Specifically, the following intersection-related crash types were analyzed:
1) Right Angle (RA)
2) Right Turn (RT)
3) Right Turn Right Angle (RTRA)
4) Left Turn (LT)
5) Left Turn Right Angle (LTRA)
6) Rear End (RE)
7) Side Swipe (SS)
8) Passing (P)
The angle crash types were included since they are common occurrences at at-grade intersections and are typically of high severity. The J-turn design introduces new weaving maneuvers between the minor road and the U-turn. Thus, rear end, sideswipe, and passing types of crashes were also analyzed.
The second method, empirical Bayes (EB), has been used in previous studies to evaluate the safety effectiveness of alternative intersection designs (Persaud et al. 2001; Hummer et al.
Manual (HSM 2010) for conducting safety evaluations. Chapter 9 of the HSM discusses safety effectiveness evaluation methods. These safety effectiveness evaluation methods use several types of performance measures, such as percent reduction of crashes, shift in crash type and severity, and crash modification factors (CMF) (HSM 2010). For observational before-after studies, it is important to understand the underlying causes for implementing a certain treatment. Sites chosen for implementing a J-turn are typically sites with either high crash frequency or severity. Thus, a selection bias is introduced into the sample. To account for this bias and the resulting regression to the mean, the HSM recommends using the EB method.
The EB method utilizes safety performance functions (SPF) to estimate the average crash frequency for treated intersections during the after period as though the treatment had not been applied (HSM 2010). The estimated average crash frequency is then compared with the actual crash frequency during the after period. The HSM recommends using 10 to 20 sites that have been treated with approximately 3-5 years of crash data. This study included five treatment sites for which post turn implementation crash data were available. As crash data from additional J-turns in Missouri becomes available in the future, additional sites can be added to the EB analysis. Predictive models, CMFs, and SPFs from the HSM are discussed below.
The crash prediction model for intersections on rural multilane highways from the HSM (2010) is as follows:
Npredicted = Nspf_x× Ci× (CMF1x× CMF2x× … × CMF4x) (3.7)
where,
Npredicted = predicted average crash frequency for a specific year on site type x;
Nspf_x = predicted average crash frequency determined for base conditions of the SPF
developed for site type x;
CMFyx= crash modification factors specific to site type x and specific geometric design
and traffic control features y;
Ci= calibration factor to adjust SPF for local conditions for site type x.
The base conditions for three-leg and four-leg stop-controlled intersections on a rural multilane highway from the HSM (2010) are:
1) Intersection skew angle 0 ̊
2) Intersection left-turn lanes 0, except on stop-controlled approaches 3) Intersection right-turn lanes 0, except on stop-controlled approaches
4) Lighting None
A CMF is used when the corresponding base condition is not met. Chapter 14 of the HSM provides CMF values for the geometric and lighting features described above. For
example, the J-turn intersection on US 63 and Deer Park Rd had two left turn lanes on the major road, one in each direction, and one right-turn lane. The CMF values from the HSM for these
0.77 for injury crashes. The calibration factors for all severities for three-leg and four-leg intersections were calculated for Missouri as 0.28 and 0.39, respectively (Sun et al. 2013). The calibration for injury-related crashes was not available; thus, a value of 1.00 was used.
The expected average crash frequency was computed using the SPF provided in the HSM (2010) as follows:
Nspf_int = exp [a + b × ln(AADTmaj) + c × ln(AADTmin)] (3.8)
where,
Nspf_int=SPF estimate of intersection-related expected average crash frequency for base
conditions;
AADTmaj=AADT (vehicles per day) for major-road approaches;
AADTmin=AADT (vehicles per day) for minor-road approaches;
A,b,c,d = regression coefficients.
The regression coefficients vary depending on the type of intersection (three-leg versus four-leg), and the type of severity (all severities versus fatal and injury only). Table 3.3 shows the coefficients for the different types as provided in the HSM (2010).
Table 3.3 SPF Coefficients for three- and four-leg intersections with minor-road stop control for total and fatal-and-injury crashes (HSM 2010)
Intersection Type/Severity Level a b c Overdispersion Parameter (Fixed k) 4ST Total -10.008 0.848 0.448 0.494 4ST Fatal and Injury -11.554 0.888 0.525 0.742 3ST Total -12.526 1.204 0.236 0.460 3ST Fatal and Injury -12.664 1.107 0.272 0.569
4ST denotes a four-leg intersection and 3ST denotes a three-leg intersection
The prediction model was used to predict the total number of crashes for the before and after periods. Persaud et al. (2001) presented the equations used for computing the measures in the EB method from the HSM. These equations are reproduced here to aid in understanding of the EB application. A ratio of the predicted values of before and after period crashes is calculated as follows (Persaud et al. 2001):
R = PA/PB (3.9)
where,
R = the ratio of the after period to the before period regression predictions;
PA =regression prediction from the after period;
The expected annual number of crashes during the before period, mb, and after period, ma,
are calculated as follows (Persaud et al. 2001):
𝑚𝑏 = [(𝑘 + 𝑥𝑏) / ((𝑘/𝑃𝐵) + 𝑦𝑏 ] (3.10)
where,
mb= the expected annual number of crashes during the before period;
k=overdispersion parameter associated with the roadway segment;
xb= count of crashes during the before period of length yb;
yb= years of before period.
ma = R × mb (3.11)
where,
ma= the expected annual number of crashes during the after period
In the next step, the EB estimate (B), the expected number of crashes that would have occurred if the treatment was not implemented, and the variance of B (Var(B)), are determined as follows (Persaud et al. 2001):
B = ma× ya (3.12) where,
ya= years of after period.
𝑉𝑎𝑟(𝐵) =(𝑚𝑏)×(𝑅×𝑦𝑎)
2
The reduction in the number of crashes (δ) is calculated as (Persaud et al. 2001),
δ = π − λ (3.14) where,
π= the summation of the EB Estimate (B) for all sites;
λ= the summation of the observed number of crashes for all sites.
The variance of the reduction in the number of crashes (Var(δ)) is calculated as (Persaud et al. 2001),
𝑉𝑎𝑟(𝛿) = ∑ 𝑉𝑎𝑟(𝐵) + ∑ 𝑉𝑎𝑟(𝐴) (3.15)
In addition to the δ value, an index of safety effectiveness, θ, is calculated as (Persaud et al. 2001), 𝜃 = 𝜆 𝜋 {1+[𝑉𝑎𝑟(𝜋) 𝜋2 ]} (3.16)
The variance of θ, Var(θ), is calculated as (Persaud et al. 2001),
𝑉𝑎𝑟(𝜃) = 𝜃2×{[𝑉𝑎𝑟 𝜆 𝜆 2 ]+[ 𝑉𝑎𝑟 𝜋 𝜋 2 ]} [1+𝑉𝑎𝑟 𝜋 𝜋 2 ] 2 (3.17)
J-change in crash frequency was statistically significant. Three steps were performed to determine the statistical significance. These steps consisted of calculating the standard error of the variance of θ, calculating the standard error of the safety effectiveness, and assessing the statistical
significance of the estimated safety effectiveness (HSM 2010). Equation 3.18 shows the calculation of the standard error of the variance of θ.
The standard error of the variance of θ was calculated as (HSM 2010),
𝑆𝐸(𝑣𝑎𝑟( 𝜃)) = √ 𝑣𝑎𝑟( 𝜃) (3.18)
After calculating the standard error of the variance of θ, the standard error of the safety effectiveness could be calculated by multiplying the result from equation 3.18 by 100. The statistical significance of the estimated safety effectiveness was calculated as (HSM 2010),
𝑡𝑒𝑠𝑡 𝑠𝑡𝑎𝑡𝑖𝑠𝑡𝑖𝑐 = |𝑆𝐸( 𝜃) 𝜃 | (3.19)
The test statistic value calculated using equation 3.19 was used to determine the significance at a given confidence level.
3.1.1.3 Public opinion survey of the J-turn on US 63
A survey was designed to obtain feedback from motorists who had driven the J-turn on US 63 and Deer Park Rd. This survey was jointly designed by the University of Missouri and MoDOT Central District staff. The survey was deployed using a web service. The survey link was disseminated through social media, news, and other media outlets with the assistance of
MoDOT’s customer relations personnel. The web survey was open for three weeks, from July 22nd to August 12th, 2013.
After providing a brief introduction to the J-turn and TWSC designs, motorist were asked the following questions:
1) Are you familiar with the J-turn intersection on US 63 near MO-163?
2) Have you driven through this J-turn intersection? 3) Did you use the acceleration lane after the J-turn? 4) Was the J-turn easy to navigate?
5) Are you familiar with the safety benefits of a J-turn as compared to a two-way stop controlled intersection on a high-speed highway?
6) Do you feel safer making the left turning movement from MO-163 onto US 63 via a
J-turn instead of directly turning left by crossing US 63?
7) Do you feel safer making the left turning movement from US 63 to MO-163 via a
J-turn instead of directly J-turning left by crossing US 63?
8) Was it easy to merge onto US 63 from the acceleration lane?
9) How much time did the J-turn add to your trip time?
10)Do you feel the additional time (if any) did not affect your trip? 11)Did any issues arise during the use of J-turn? If yes, please explain.
12)What additional education and outreach can be made available to help the public better understand the operation and safety benefits of J-turns?
The survey concluded by collecting demographic information regarding the respondents. The requested information included age range, gender, residency, trip purpose, and vehicle type.
response set for most questions. Likert scales and demographic-based questions are commonly used in many transportation surveys (Mounce et al. 2007; Edwards and Young 2009). The entire survey as it appeared on the website is included in the following pages.
Chapter 4 Results 4.1 Introduction
This section presents the results for the performance measures discussed in the previous section. The measures extracted from the field data were compared for the J-turn and TWSC control intersections. Operational measures, safety measures, and a public opinion survey were analyzed. The operational measures consisted of travel times, wait times from the minor road to the major road, and acceleration lane use before and after accessing the U-turn. The safety
measures consisted of time to collision and gap acceptance. The comprehensive safety evaluation was conducted using crash data for five J-turn locations in Missouri. The EB-based safety
evaluation derived crash modification factors for all crash severities and for injury and fatal crashes.
4.1.1 Operational Measures
Operational performance measures were analyzed using the field data collected at the US 63 and Deer Park Rd J-turn site and the US 63 and Calvert Hill Rd TWSC site. A comparison of travel times and wait times was performed between the J-turn and TWSC intersections.
Acceleration lane use at the J-turn site was also analyzed. 4.1.1.1 Travel Times
In comparison to the TWSC design, all minor road movements and major road turning movements require travel of some additional distance in a J-turn design to complete their movements. The increases in travel times for these movements were measured in the field. A survey question also investigated motorists’ perceptions of the increase in travel times.
seconds, compared to 67 seconds at the J-turn site. Travel time statistics are shown in table 4.1. The mean travel time at the J-turn site was 58 seconds greater than at the TWSC site. Thus, on average, the J-turn design increased the travel time of major road left turn vehicles by about one minute.
Figure 4.1 Cumulative distribution of travel times of major road left turns
Table 4.1 Travel time statistics for major road left turns
J-turn TWSC
Mean (seconds) 70 12
Median (seconds) 58 8
Mode (seconds) 62 5
Std. Dev. (seconds) 36 10 Sample Size (vehicles) 59 54 0% 20% 40% 60% 80% 100% 0 20 40 60 80 100 120 P e rcen ta ge
Travel Time (Sec)
J-turn TWSC
The travel times of vehicles turning left from the minor road to the major road were also measured for the J-turn and TWSC. For the TWSC, travel time included wait times at the intersection and the time it took to cross two lanes of traffic to the median then access the major road on the opposite side. For the J-turn, travel time included wait time, the time it took for the vehicle to drive from the minor road to the U-turn, and the time taken to travel the distance from the U-turn to the intersection to complete the turning movement. Since the J-turn site on US 63 had acceleration lanes for the minor road turning movements, the wait time, if any, was minimal. Once again, due to the additional distance traveled at the J-turn, the travel times were expected to be greater than at the TWSC. The cumulative percentage of vehicle travel times for both designs is shown in figure 4.2. For example, 80th percentile travel time at the TWSC site was 33 seconds, compared to 84 seconds at the J-turn site. The travel time statistics are shown in table 4.2. The mean value of travel time computed for the J-turn site was 56 seconds greater than at the TWSC site. On average, the J-turn design increased the travel time of minor road left turn vehicles by approximately one minute.
Figure 4.2 Cumulative distribution of travel times of minor road left turns
Table 4.2 Travel time statistics for minor road left turns
J-turn TWSC Mean (seconds) 78 22 Median (seconds) 75 19 Mode (seconds) 69 11 Std. Dev. (seconds) 17 14 Sample Size 79 96
4.1.1.2 Wait times for minor road left turn vehicles
The wait times of vehicles wanting to turn left from the minor road onto the major road were measured at the TWSC and J-turn sites. The travel times measured at the TWSC, described previously, included this wait time. Drivers at the J-turn site turned right into the acceleration lane and then merged onto the through lanes. Unlike the TWSC intersection, the J-turn with an acceleration lane eliminated the need to wait for an acceptable gap in the major road. Thus, the wait times for left turns from the minor road at the J-turn site were expected to be lower than
0% 20% 40% 60% 80% 100% 0 20 40 60 80 100 120 P e rcen ta ge
Travel Time (Sec)
J-turn TWSC
those at the TWSC site. A cumulative percentage of the wait times for the two designs is shown in figure 4.3. For example, 85th percentile wait time at the J-turn site was 10 seconds, compared
to 21 seconds at the TWSC site. The mean wait times were 5 seconds for the J-turn and 11 seconds for the TWSC site. This difference in wait times was significant, especially since the major road AADT at the J-turn site was higher (27,321) than at the control site (17,217). As major road AADT increases, the wait times at the TWSC were expected to increase. The presence of an acceleration lane for turning vehicles at the J-turn site signified that the major road AADT did not significantly affect wait times.
Figure 4.3 Cumulative distribution of wait times for minor road left turns
0% 20% 40% 60% 80% 100% 0 20 40 60 80 100 120 P e rcen ta ge
Wait Time (Sec)
TWSC J-turn
4.1.1.3 Acceleration Lane Use
There were two acceleration lanes at the US 63 and Deer Park Rd J-turn: one acceleration lane was located at the beginning of the minor road, to be used by minor road vehicles for
turning right and getting up to speed to merge into the major road; the second acceleration lane was located after the U-turn to help turning vehicles accelerate and merge into the passing lane on the major road. The portions of the acceleration lane used by vehicles before merging into the through lanes on the major road were extracted from video data. The usage of the right turn acceleration lane and the U-turn acceleration lane are shown in figures 4.4 and 4.5, respectively. In figure 4.4, the acceleration lane is divided into 200 ft. segments, and the percentages of vehicles merging in each segment are shown. The orange bars show the percentages for the left turn vehicles that accessed the U-turn downstream. The green bars show the results for the non-turn vehicles, i.e., those vehicles that continued on the major road without accessing the U-turn. Figure 4.4 shows that most of the U-turn vehicles, 78%, left the acceleration lane within the first 400 ft of the acceleration lane. These vehicles did not reach the mainline speed limit of 70 mph prior to merging into the right through lane. The turning vehicles not using the U-turn used a larger portion of the acceleration lane before merging into the major road. One reason most vehicles accessing the U-turn were merging within the first 400 ft. is that they were attempting to position themselves to be able to make lane changes in time to access the U-turn. Figure 4.6 shows the lengths of the acceleration and deceleration lanes estimated from the design plans for the J-turn site. From the figure, the entrance to the deceleration lane into the U-turn was located at 2,025 ft. for the northbound direction and 1,620 ft. for the southbound direction.
The use of the U-turn acceleration lane is shown in figure 4.5 for U-turn vehicles (shown in orange), and only those vehicles that accessed the minor road through a right turn downstream