Permission to make digital or hard copies of all or part of this work for personal or classroom use is granted without fee provided that copies are not made or distributed for profit or commercial advantage and that copies bear this notice and the full citation on the first page. To copy otherwise, or republish, to post on servers or to redistribute to lists, requires prior specific permission and/or a fee.
MIR’08, October 30–31, 2008, Vancouver, British Columbia, Canada. Copyright 2008 ACM 978-1-60558-312-9/08/10...$5.00.
Large Scale Image Copy Detection Evaluation
Bart Thomee Mark J. Huiskes Erwin Bakker Michael S. Lew
LIACS Media Lab, Leiden University Niels Bohrweg 1, 2333 CA Leiden, The Netherlands
{bthomee, markh, erwin, mlew}@liacs.nl
ABSTRACT
In this paper we provide a comparative study of content-based copy detection methods, which include research literature methods based on salient point matching (SURF), discrete cosine and wavelet transforms, color histograms, biologically motivated visual matching and other methods. In our evaluation we focus on large-scale applications, especially on performance in the context of search engines for web images. We assess the scalability of the tested methods by investigating the detection accuracy relative to descriptor size, description time per image and matching time per image. For testing, original images altered by a diverse set of realistic transformations are embedded in a collection of one million web images.
Categories and Subject Descriptors
H.3.3 [Information Storage and Retrieval]: Information Search and Retrieval – Clustering, Information Filtering. H.3.1 [Information Storage and Retrieval]: Content Analysis and Indexing – Indexing Methods. I.4.9 [Computing Methodologies]: Image Processing and Computer Vision – Applications
General Terms
Algorithms, Experimentation, Measurement, Performance
Keywords
Content-based image copy detection, Image redundancy, Web search
1.
INTRODUCTION
Within the field of content-based retrieval ([19]), multimedia copy detection methods have received significant attention: on images (e.g. [5]), video (e.g. [1]), audio (e.g. [9]) and text (e.g. [2]). However none of these have been objectively benchmarked in the context of very large media collections (millions), such as the World Wide Web. Evaluating which methods are the best candidates for copy detection on the WWW is our primary goal. Hundreds of millions of images can currently be found on the internet. Many of these are copies which have been altered in diverse ways, such as inclusion of title and menu text for web page designs, magazine layouts, conference posters, etc. In [11] a study is presented that investigates the extent of this issue for a
diverse selection of popular search terms and the authors identify two important factors for predicting if a search term is likely to result in image rankings with many copies or near-duplicates: images on certain topics are relatively rare and cause the few available images to be reused on many different sites, whilst other images are reused often because of their popular content. Besides such reuse of images across the internet, another common source of redundancy is images offered in different sizes, e.g. as thumbnails linked to pictures in the original resolution.
We set out to provide a first comparative study of copy detection methods that are feasible for detection of copies in very large and growing image sets. Given the quantity of images available today on the internet this rules out a number of approaches to copy detection, most notably the watermarking approach ([6]) where information is added to the content primarily for the detection of illegal copies. One particular reason we perform this study is the development of our Noteworthy image search engine, which keeps track of new and noteworthy images appearing on the web. Facilitating this type of service requires highly scalable copy detection methods.
We evaluate the methods by two important, yet potentially contradicting, criteria: first by accuracy, typically measured in terms of false positive and false negative rates or their close counterparts precision and recall; second by computational
requirements, i.e. by measuring indicators for usage of main
memory, hard disk storage, and processing times for image description and image matching. Given the purpose sketched above we are especially concerned with the scalability of the detection methods with respect to these measurements. Many studies have focused on test sets with a size in the range of 10,000 to 40,000 images ([4, 11-15]), but in the context of web search there is clearly a need to use larger test sets.
In this paper we present our first performance evaluations for copy detection on a set of original images and copies – altered versions of the original by a diverse set of realistic transformations – and embedding them in a collection of one million actual web images. The individual methods ([3-5, 7]) for copy detection compared in this paper typically provide some basic benchmarking but rarely compare their results to other methods and none of these studies use test sets sizes comparable to ours.
If we look at related work, in [11] an exploratory study is presented comparing methods also targeted at near-duplicate detection of web images. However, the aim of that paper is to detect copies in the results returned by search engines. As we are aiming to detect copies in all indexed images, we need to assess feasibility at much larger scales. For the domain of video copy detection, [1] offers a study similar in setup to ours. Original sequences transformed by common editing operations are embedded in a large collection of sequences. Also in [15] a
similar evaluation methodology is used with 40 different image transformations to test their method on two databases containing roughly 10,000 to 20,000 images.
The structure of the paper is as follows. In Section 2 we describe the copy detection methods we have compared in this study. In Section 3 we describe the experimental setup of the comparative study. In Section 4 we present the results of the experiments, and we conclude in Section 5.
2.
COPY DETECTION METHODS
We have selected four copy detection methods from recent literature, each of which uses a different representation as basis for detecting copies, namely discrete cosine transform, discrete wavelet transform, color histograms and interest points. In addition we have developed three other methods, two low-complexity ones that we have included mainly to obtain a first reference level of performance that can serve as a baseline for the other methods and one that is based on human vision.
Discrete cosine transform: For the representative research
literature method using the DCT, we used the algorithm by Kim[5]. The images are converted to grayscale and then resampled using intensity averaging to size 8x8. The resulting 64 intensities are transformed into a series of coefficients by performing an 8x8 2D DCT and the coefficients are then ranked by the AC magnitudes, see Figure 1. Copies are detected by comparing the L1 distance between the rank matrices.
a) b)
c)
Figure 1. Example of ranking 15 DCT coefficients: a) input image, b) 8x8 DCT coefficient matrix with the 15 coefficients in blue, c) ranking of coefficient indices (displayed as vector)
Discrete wavelet transform: In the work by Chang, et al.[4], each
image is resampled to 256x256 pixels and then converted to a human perceptual color model. Daubechies’ DWT is used multiple times to reduce the number of coefficients. For each of the three color channels, the resulting low frequency coefficients are used as color filter, while the horizontal, vertical and diagonal high-frequency coefficients are separately summed and thresholded and used as shape filter. Copies are detected by first ensuring that the values of the shape filter are identical and then the L2 distance is compared between the color filters.
Color histograms: The representative research literature work [7]
for color histograms begins by conversion to HSV color space and creating a quantized color histogram. Using a training set of originals and copies, the differences between the histograms of an original and its copies are modeled into a probability density function. Copies are detected by comparing the L1 distance
between the (normalized) difference of histograms of two input images and the probability density function.
SURF interest points: As SURF[3] has been shown to outperform
the other well-known methods based on interest points SIFT[18] and GLOH[8], we have selected this method as the leading technique for the interest points representation. Each image is converted to grayscale and its upright SURF descriptor is extracted (for copy detection rotation invariance is not required): it uses a Hessian matrix-based measure for the detection of interest points and a distribution of Haar wavelet responses within the interest point neighborhood as descriptor. The SURF method as implemented by the original authors uses 8-byte doubles and has a memory cost of roughly 520 bytes per salient point or typically around 780KB per image, but this is infeasible storage-wise for large image collections. Therefore, using the salient points detection algorithm and saliency strength measurement as provided in the libraries from the SURF authors, we have selected the top-N strongest points and attempt to reduce the memory load even further by using 4-byte floats instead of the 8-byte doubles. Copies are detected by first ensuring that the Laplacian sign is the same between two input images and then per interest point in one image finding the best matching interest point in the other image, based on the nearest neighbor ratio as suggested by the authors.
Median: After resampling each image and converting it to
grayscale, the image is divided into 64 blocks (8 horizontal by 8 vertical). The median intensity is calculated for each of these blocks and is compared with the median intensity over the entire image. The image descriptor consists of a bit vector flagging if block medians are greater than the overall median. Copies are detected by comparing the number of bit errors between vectors.
MD5 hashing: Images are resampled and values of each of the
RGB color channels are reduced to 4 bits. The 64-bit MD5 (Message-Digest algorithm 5, which is a widely used but partially insecure cryptographic hash function) is calculated over the resulting array. Copies are detected when the MD5 values of two input images correspond. The strength, and also the weakness, of this approach is that the MD5 hash function only hashes to the same value when the 4-bit per pixel RGB arrays exactly correspond, and any variation in the array members will result in completely different MD5 values.
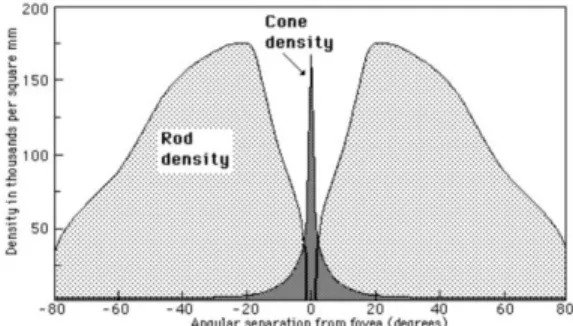
Figure 2. Cone and rod density in the human retina
Retina: Human vision is a well-researched system, particularly in
biology, that has many promising possibilities in computational visual understanding algorithms. This approach is based on results from the neuro-biology field described in [16], which reveal that the human retina has an exponentially decreasing density of cones in the eye with decreasing visual acuity as measured from the center of the retina, as shown in Figure 2. Our approach tries to roughly replicate it by overlaying rings of decreasing density on the image. We compute the HSV color moments (4 bits per color
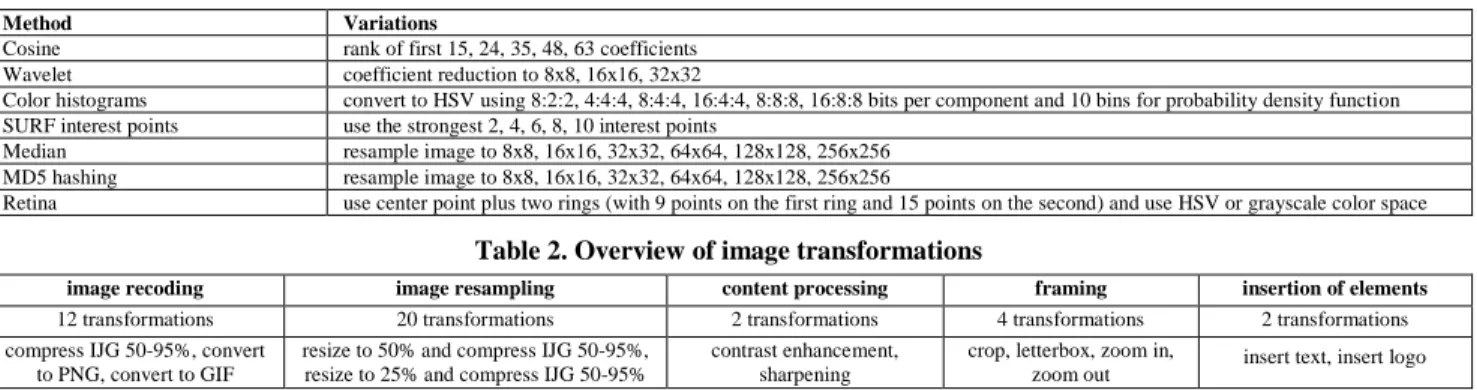
Table 1. Overview of copy detection methods
Method Variations
Cosine rank of first 15, 24, 35, 48, 63 coefficients Wavelet coefficient reduction to 8x8, 16x16, 32x32
Color histograms convert to HSV using 8:2:2, 4:4:4, 8:4:4, 16:4:4, 8:8:8, 16:8:8 bits per component and 10 bins for probability density function SURF interest points use the strongest 2, 4, 6, 8, 10 interest points
Median resample image to 8x8, 16x16, 32x32, 64x64, 128x128, 256x256 MD5 hashing resample image to 8x8, 16x16, 32x32, 64x64, 128x128, 256x256
Retina use center point plus two rings (with 9 points on the first ring and 15 points on the second) and use HSV or grayscale color space
Table 2. Overview of image transformations
image recoding image resampling content processing framing insertion of elements
12 transformations 20 transformations 2 transformations 4 transformations 2 transformations compress IJG 50-95%, convert
to PNG, convert to GIF
resize to 50% and compress IJG 50-95%, resize to 25% and compress IJG 50-95%
contrast enhancement, sharpening
crop, letterbox, zoom in,
zoom out insert text, insert logo
component) of several points on each ring based on the sample region size and measure similarity using the L1 distance.
In a real-world setting, appropriate distance thresholds need to be established for the methods in order to differentiate between copies and non-copies. For evaluation purposes, however, hard cut-off values are not necessary and we only need to report on the ranking of distances between images to obtain meaningful accuracy and performance results.
We have implemented the four copy detection methods from recent literature to the best of our ability, based on the sequence of steps and values used as described in their respective papers. In order to determine the accuracy relative to varying descriptor sizes, we have also created variations of the original methods. See Table 1 for an overview of all methods.
3.
EXPERIMENTAL SETUP
A query image will be compared to two sets of images: (i) a set of known copies of the query image, generated by a specific set of image transformations on the original as described in Section 3.2, and (ii) a very large set of web images. To evaluate the accuracy of the copy detection methods we use a testing framework that for each query image measures the distances to all images in the two test sets. Ideally, all copies have small distances to the query image, whereas all other images have large distances. One of the set of results we present is average precision at different recall levels versus descriptor size, as we are specifically interested in the accuracy of a method with respect to its computational requirements. The results allow us to quantify how well a copy detection method is able to detect the copies. See Section 4 for a more detailed description of the measurements and the results.
Figure 3. Example images from web set (top row) and query set (bottom row)
3.1
Test sets
The web images were collected using the internet crawler of the Noteworthy image search engine. In total 1,000,000 web images are used, of which a high proportion are photographic. The query images are taken from an image set known not to be published on the internet, ensuring that the only copies in the test set will be the images generated by the transformations on the original query image. The query image set consists of 3000 color photos taken at various locations in world. The sizes of the web images range between 120x150 and 640x640 pixels and the sizes of the query images alternate between 640x480 and 480x640 (depending on whether the photo was taken in landscape or portrait orientation). See Figure 3 for example images from both image sets.
The methods that require a training phase in order to estimate certain parameters, e.g. weights and thresholds, were given a set of 1000 web images and 343 query images (plus copies) that were not included in the test sets.
3.2
Transformations
Copies are the result of one or more transformations on the original digital source. In [11] it was found that, for images returned for a number of popular search terms, the most often occurring changes are first image rescaling and next image cropping. They also discovered that the images often are altered by more than one transformation. Changes in compression level were not analyzed. For our study we categorize the image transformations as follows.
Image recoding: This category includes changes in the original
that result from image compression and change of image file format. These operations tend to change the pixel color values of the pixels, albeit sometimes only modestly, e.g. as a result of a change of color depth, constraints on the color table, or by reducing the information used to reconstruct these color values. For our tests we save the original images at various levels of compression (ranging from 50-95% on the Independent JPEG Group [17] compression scale with steps of 5%). To test for the effect of a drastic change in color depth we also convert the images to the GIF format (which leads to a maximum total number of colors of 256). Additionally, we convert the original JPEG images to PNG. This is strictly a test for consistency since PNG compression is lossless.
Image resampling: For this category we resize the original images
to 50% and 25%, and also save these images at the aforementioned levels of IJG JPEG compression.
Table 3. Specified per method variation (V): the descriptor size in bytes (S), average description time in milliseconds (D) and average matching time in seconds (M) of a query image
Method V S D M V S D M V S D M
Cosine 15 15 16 1 24 24 16 1 35 35 16 1
48 48 16 1 63 63 16 1
Wavelet 8x8 228 89 1 16x16 804 89 1 32x32 3108 89 1
Color histograms 16:4:4 8:2:2 1024 128 31 31 2 6 4:4:4 8:8:8 2048 256 31 31 11 2 16:8:8 8:4:4 4096 512 31 31 20 4 SURF interest points 2 520 206 7 4 1040 206 13 6 1660 206 19
8 2080 206 25 10 2600 206 31 Median 8x8 8 13 1 16x16 8 14 1 32x32 8 15 1 64x64 8 17 1 128x128 8 32 1 256x256 8 85 1 MD5 hashing 8x8 8 13 2 16x16 8 14 2 32x32 8 14 2 64x64 8 17 2 128x128 8 29 2 256x256 8 80 2 Retina grayscale 25 117 1 HSV 50 117 1
Content processing: Image processing tools are regularly used to
apply editing operations to an image, usually to increase its perceived quality. We have created copies by applying two editing operations, contrast enhancement (by saturating 1% of values at low and high intensities) and sharpening (by subtracting a blurred version of the image to obtain rough edges that are added to the original for emphasis).
Framing: This category includes various transformations to frame
the topic of interest. We have applied cropping, digital zooming and letterboxing.
Insertion/removal of small elements: Examples of this category
would be inserting or removing unwanted text or image elements. For this category we have created two copies by adding a logo and adding a copyright text.
We believe that the transformations in the image recoding and image resampling categories are probably among the most commonly used on the internet. In total we have used 40 transformations, see Table 2 for an overview and Figure 4 for examples of several transformations.
Figure 4. Image transformations: (a) original, (b) insert logo, (c) insert text, (d) GIF, (e) letterbox/frame, (f) zoom in
4.
EXPERIMENTAL RESULTS
In total we used 3000 query images, 120,000 copies and 1,000,000 web images. The image descriptors were calculated for all these 1,123,000 images for each variation of each method.
4.1
Computational performance
We first focus on three main indicators of performance: descriptor size (the amount of memory needed per image), description time
per image (the average time needed to calculate the descriptor of
an image) and matching time per query image (the average time
needed to compare one query image with all 1.1 million images). Together these measurements constitute the most important method-dependent factors determining requirements for main memory, disk storage and processing times.
The main memory requirements are to an important extent determined by the size of the indexing structure used, if any at all. For indexing many different approaches can be used, see e.g. [10]. The idea of indexing is simple: instead of having to compare a query image with every single image in the database to find the relevant ones (in our case all copies), the indexing algorithm performs culling to identify only a fraction of all images which supposedly minimally contains all relevant images; indexing thus effectively reduces the time required as the query image only needs to be compared to fewer images, and requires less data to be held in memory as only the descriptors of the culled set of images have to be loaded in memory instead of those of all database images. Memory usage is then directly proportional to the descriptor size. Advanced indexing and data structures may improve performance, and we will evaluate them in future work. In Table 3 we show the computational performance results for all copy detection methods. An ideal copy detection method needs little time to calculate the descriptor of an image and this descriptor uses a minimal number of bytes; in addition, the time needed to compare this descriptor to other image descriptors is also small. However in practice no method possesses all these properties. It is thus important to realize the tradeoffs between the various performance indicators and weigh them accordingly to the intended application needs. As we are using large image databases, the following are the points of attention for us: (i) if the description size is large, then the method will cause memory consumption issues, unless certain measures are taken (e.g. indexing), (ii) if the description time is large, then the time necessary to calculate all descriptors will become prohibitive, and (iii) if the matching time is large, then real-time requirements will suffer (e.g. performing on-the-spot detection of copyright infringement for a given original image). As an illustration of memory consumption, for the interest point method with only 10 interest points per image, our image descriptors require 2.9GB of memory, whereas the median method only needs 9.0MB.
4.2
Accuracy
For the success of a method, its accuracy is of paramount importance: if the accuracy is low then the method is useless, even when it demonstrates excellent computational performance. We have measured the accuracy of the methods on the transformations
a) b)
c) d)
e) f)
Figure 5. Precision-recall graphs of all variations per method:
a) Cosine, b) Wavelet, c) Color histograms, d) Median, e) MD5 hashing, f) Retina
The SURF interest points variations had near zero average precision for each recall level and therefore are not shown
0 0.2 0.4 0.6 0.8 1 0 0.2 0.4 0.6 0.8 1 pr ec isi o n recall Cosine_63 Cosine_48 Cosine_35 Cosine_24 Cosine_15 0 0.2 0.4 0.6 0.8 1 0 0.2 0.4 0.6 0.8 1 pr ec isi o n recall Wavelet_32x32 Wavelet_16x16 Wavelet_8x8 0 0.2 0.4 0.6 0.8 1 0 0.2 0.4 0.6 0.8 1 pr ec isi o n recall ColorH_16:8:8 ColorH_8:8:8 ColorH_16:4:4 ColorH_8:4:4 ColorH_4:4:4 ColorH_8:2:2 0 0.2 0.4 0.6 0.8 1 0 0.2 0.4 0.6 0.8 1 pr ec isi o n recall Median_256 Median_128 Median_64 Median_32 Median_16 Median_8 0 0.2 0.4 0.6 0.8 1 0 0.2 0.4 0.6 0.8 1 pr ec isi o n recall MD5_256 MD5_128 MD5_64 MD5_32 MD5_16 MD5_8 0 0.2 0.4 0.6 0.8 1 0 0.2 0.4 0.6 0.8 1 pr ec isi o n recall Retina_gray Retina_HSV
mentioned in Section 3.2, for all transformations combined and for the distinct groups of transformations. The precision-recall graphs per method variation for the combined set of transformations are shown in Figure 5. For clarity, in our results we define precision as the number of copies found over the total number of images looked at and recall as the number of copies found thus far over the total number of existing copies. Per method we select the in our view best performing variation, while taking the descriptor size per image into account. Due to space limitations we have omitted the graphs for the various groups of
transformations; these graphs show the same relative ordering between method variations.
Discrete cosine transform: The cosine variations are able to
effectively distinguish the copies from the non-copies as the coefficient rankings for most copies are near-identical. The variation tested to perform best by the authors on their image database uses 35 coefficients, however in our situation the variation using 24 coefficients gives a high accuracy that is more consistent over the recall levels than that of the other variations.
Figure 6. Average precision at recall levels of 0.2, 0.5 and 0.8, versus descriptor size in bytes
Figure 7. Average ranking per recall level (horizontal line shows the average rank at which 95% of the copies has been found)
0 0.2 0.4 0.6 0.8 1 1 10 100 1000 10000 pr ec isi o n descriptor size
Cosine_24 Wavelet_8x8 ColorH_8:8:8 SURF_10 Median_8 MD5_8 Retina_gray
0.5 0.80.2 0.2 0.5 0.8 0.5 0.2 0.8 0.2 0.5 0.8 0.5 0.2 0.8 0.5 0.2 0.8 0.2 0.5 0.8 0 0.2 0.4 0.6 0.8 1 0 100000 200000 300000 400000 500000 600000 re cal l rank
Cosine_24 Wavelet_8x8 ColorH_8:8:8 SURF_10 Median_8 MD5_8 Retina_gray
0.95
Discrete wavelet transform: The three variations of this method
show high precision up to a high recall ratio. The variation that reduces the coefficients to an 8x8 matrix has a similar accuracy to the authors’ original variation that reduces them to a 16x16 matrix, but requires less bytes per image descriptor and therefore in our view is the best performing variation.
Color histograms: As can be seen the accuracy rapidly improves
with increasing number of bins in the HSV histogram – and thus increasing numbers of bytes per image descriptor used – up until the 8:8:8 variation, which in our opinion offers the best accuracy with respect to its computational performance. In the original article the authors used several variations for their experiments.
SURF interest points: The SURF method had poor accuracy in the
tests. We believe this is due to the inability of interest point methods to reliably identify the exact same set of points between similar images in the case when small numbers of interest points are used. When thousands of points are used there is sufficient statistical redundancy for the method to usually find matching points, but when only few points are used, the exact matching problem becomes significant. Consider for example the case where copyright text is added to a copy of an image of a blue sky. Half of the salient points will be attracted to the edges of the text, but these edge points will not have any correspondences in the original. In this case, the interest points are emphasizing the differences between the copies which results in low accuracy. In future tests we will determine how many points are necessary to achieve good accuracy. For comparison reasons we select the variation using the highest number of interest points, as we expect that for good results we will need at least this number.
Median: Surprisingly this method has a high accuracy, especially
considering its low-complexity and overall small descriptor size and little descriptor and matching times. The relative magnitude
of the medians of each block, combined with the average variance, give the method good discrimination power between copies and non-copies. The 8x8 variation performs best.
MD5 hashing: This method is only able to detect perfect and
near-perfect copies and performs poorly on all other copies. Clearly the spirit of the method makes sense, as all copies are supposed to hash to the same MD5 descriptor, however in practice it doesn’t work. Nonetheless, the 8x8 variation has highest accuracy with respect to the computational requirements.
Retina: The retina method has the highest average accuracy of all,
even though both its variations have a lower initial precision than the median and cosine methods. The block-wise extraction of means plus their variation in combination with the exponentially decreasing placement of the blocks based on human-vision appears to work very well. We think the retina performed so well because it combines statistical robustness, i) due to computation of the color moments from regions of increasing size from the center and ii) due to the sampling, which allows it to compensate for significant local image content alterations. In some way it is a good hybrid between color histograms and template matching. We select the grayscale variant based on its smaller descriptor size and higher initial and average precision.
For an inter-method comparison, we have plotted the precision of the best performing variations at recall levels of 0.2, 0.5 and 0.8 against their descriptor size in Figure 6. The part of the graph we are most interested in is the top-left area. The median method has high precision – at a recall of 20% it is higher than at the other two recall levels – and low memory usage per image descriptor. The cosine method gives a little better accuracy and comparable computational performance at a slightly larger descriptor size. The retina method is comparable to the cosine method, with a slightly lower precision at 20% recall and slightly higher precision at 80%
Figure 8. Normalized ranking performance per transformation category
Figure 9. Distribution of copies over the ranks (bin 1 = rank 0-40, bin 2 = 41-100, bin 3 = 101-250, bin 4 = 251-1000, bin 5 = 1001-5000, bin 6 = 5001-50,000, bin 7 = 50,001-500,000, bin 8 = remainder)
0.4 0.5 0.6 0.7 0.8 0.9 1
recoding resampling content framing elements
no rm al iz ed ran ki ng pe rf o rm an ce transformation category
Cosine_24 Wavelet_8x8 ColorH_8:8:8 SURF_10 Median_8 MD5_8 Retina_gray
0 5 10 15 20 25 30 35 40 1 2 3 4 5 6 7 8 co pi es fo un d ranking bin
Cosine_24 Wavelet_8x8 ColorH_8:8:8 SURF_10 Median_8 MD5_8 Retina_gray
recall. All other methods either require too much memory per image descriptor or have poor accuracy.
In Figure 7 we show the average ranking per recall level for the best performing variations. The horizontal line in the graph shows at which average rank 95% of the copies has been found. In our view this value is representative for our application domain: for web search a method should fulfill the requirement to return almost all copies that were created using a similar set of transformations as we used, but also should be allowed to make mistakes on the more difficult transformations. The graph shows us that the color histogram, median and retina methods reach the target recall ratio at low ranks, whereas both the cosine and the wavelet methods started out very promising but had difficulties just before reaching the target. As can be seen clearly once more, the MD5 hashing and our implementation of the interest points perform very poorly.
4.3
Ranking performance and distribution
To see which type of image transformations are easier to detect than others, we determine the normalized ranking performance per method for each transformation category. We define normalized ranking performance as follows:
𝑟𝑎𝑛𝑘𝑛𝑜𝑟𝑚𝑎𝑙𝑖𝑧𝑒𝑑 = 1 −# 𝑑𝑎𝑡𝑎𝑏𝑎𝑠𝑒 𝑖𝑚𝑎𝑔𝑒𝑠𝑟𝑎𝑛𝑘𝑎𝑣𝑒𝑟𝑎𝑔𝑒 ,
thus the best performing methods will get results close to 1. In order to simulate the context where a user is viewing a window of results, we added a small random perturbation δ to the ranks:
𝑟𝑎𝑛𝑘𝑎𝑣𝑒𝑟𝑎𝑔𝑒 =# 𝑐𝑜𝑝𝑖𝑒𝑠1 #𝑐𝑜𝑝𝑖𝑒𝑠𝑖=1 𝑟𝑎𝑛𝑘𝑖+ 𝛿 .
Since the search engine can only display N images to the user, the perturbation allows images that share the same distance (and thus are equally likely to be shown on screen) to be randomly picked.
The normalized ranking performance results are shown in Figure 8. There are a few interesting observations we can make on the presented data.
First, all methods perform very well except for the MD5 hashing and SURF methods. The main problem with the MD5 approach is that it is very black-and-white in its perception: an image is either a copy or it is not and there are no gradations in between. As the method is only able to find perfect and near-perfect copies, these get a high average rank, but all other images will be seen as non-copies and get a very low average rank. A similar situation for the SURF method, where due to the small number of points used, it marks all images as either copies or non-copies.
If we look at the methods that perform well, we can see that in general the image recoding and resampling transformations are easiest to detect. The cosine and wavelet methods struggle with framing, which isn’t surprising since the image content is significantly altered. To a lesser extent this is also the case for the content processing and element insertion transformations. We can observe from the rankings of individual transformations (which are not shown) that the color histograms approach finds almost all transformations around the same rank, with the exception of the content processing transformations as these transformations alter the color distribution significantly. Because of this underlying distribution, images similar to the average copy are easiest to be found, but as a consequence this also means that the perfect copy – the conversion to PNG, which does not change image content – results in a relatively large distance. None of the other methods had difficulty with marking the PNG-converted image as a copy. The retina approach finds almost all transformations within the first few ranks.
We have measured the distribution of the ranks at which copies are detected, which is shown in Figure 9. The ranks are grouped in bins of increasing size, with the smallest bins at the highest ranks and the larger bins at the lowest ranks; this way the importance of
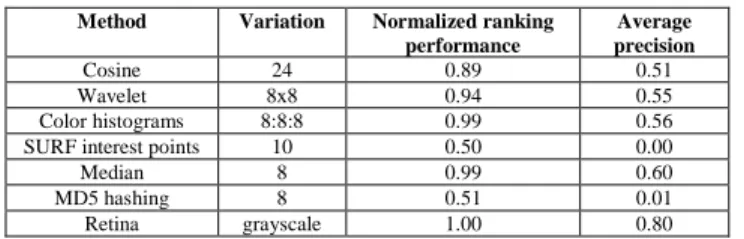
the ranking is captured, as the smallest bin is associated with the highest ranks and ideally contains all copies. As can be seen, most methods actually detect many copies within the highest ranks and therefore the distribution gives a good impression of how well the method is able to find most copies. In summary of the results, Table 4 displays the normalized ranking performance and average precision of the best performing method variations, where each transformation category from Section 3.2 is equally weighted.
Table 4. Normalized ranking performance and average precision per best performing method variation
Method Variation Normalized ranking performance Average precision Cosine 24 0.89 0.51 Wavelet 8x8 0.94 0.55 Color histograms 8:8:8 0.99 0.56 SURF interest points 10 0.50 0.00
Median 8 0.99 0.60
MD5 hashing 8 0.51 0.01
Retina grayscale 1.00 0.80
Nonetheless, it is clear that the success of a copy detection method lies in consistently being able to minimize the distances between image descriptors of copies and to maximize the distance between image descriptors of non-copies.
5.
CONCLUSION AND FUTURE WORK
In this paper, we have compared several image near copy detection methods and assessed their performance in the context of WWW search on a representative database containing over 1.1 million images. We have shown that to obtain high accuracy it is not necessary to use a large nor computationally intensive image descriptor. We also presented results per transformation type to gain further insight into the strengths and weaknesses of the candidate methods. The representative interest point method, SURF, performed poorly on our tests due to the inability of the method to find the exact same set of points between near copies when using a small number of interest points. Based on the obtained results, the two best methods are either the median method, which exhibits small descriptor size and fast matching, or the retina method, which exhibits high accuracy using a modest descriptor size.
6.
ACKNOWLEDGEMENTS
Leiden University and NWO BSIK/BRICKS supported this research under grant #642.066.603
7.
REFERENCES
[1] Law-To, J., Chen, L., Joly, A., Laptev, I., Buisson, O., Gouet-Brunet, V., Boujemaa, N., and Stentiford, F. 2007. Video copy detection: a comparative study. In Proceedings of the 6th ACM international Conference on Image and Video Retrieval, 371-378.
[2] Shivakumar, N., and Garcia-Molina, H. 1996. Building a scalable and accurate copy detection mechanism. In
Proceedings of the 1st ACM international Conference on Digital Libraries, 160-168.
[3] Bay, H., Ess, A., Tuytelaars, T., and Van Gool, L. 2008. Speeded-up robust features (SURF). Computer Vision and Image Understanding 110, 3, 346-359.
[4] Chang, E., Wang, J., Li, C., and Wiederhold, G. 1998. RIME – a replicated image detector for the world-wide web. In Proceedings of SPIE Symposium of Voice, Video, and Data Communications, 68-77.
[5] Kim, C. 2003. Content-based image copy detection. Signal Processing: Image Communication 18, 3, 169-184. [6] Cox, I.J., Kilian, J., Leighton, F.T., and Shamoon, T. 1997.
Secure spread spectrum watermarking for multimedia. IEEE Transactions on Image Processing 6, 12, 1673-1687. [7] Sebe, N, and Lew, M.S. 2001. Color-based retrieval. Pattern
Recognition Letters 22, 2, 223-230.
[8] Mikolajczyk, K., and Schmid, C. 2005. A performance evaluation of local descriptors. IEEE Transactions on Pattern Analysis and Machine Intelligence 27, 10, 1615-1630. [9] Cano, P., Batlle, T, Kalker, T, and Haitsma, J. 2002. A
review of algorithms for audio fingerprinting. In Proceedings of International Workshop on Multimedia Signal Processing, 169-173.
[10]Böhm, C., Berchtold, S, and Keim, D.A. 2001. Searching in high-dimensional spaces: index structures for improving the performance of multimedia databases. ACM Computing Surveys 33, 3, 322-373.
[11]Foo, J.J., Zobel, J. Sinha, R. and Tahaghoghi, S.M.M. 2007. Detection of near-duplicate images for web search. In Proceedings of the 6th ACM international Conference on Image and Video Retrieval, 557-564.
[12]Foo, J.J., and Sinha, R. 2007. Pruning SIFT for scalable near-duplicate image matching. In Proceedings of the 18th Conference on Australasian Database Conference, 63-71. [13]Ke, Y., Sukthankar, R., and Huston, L. 2004. An efficient
parts-based near-duplicate and sub-image retrieval system. In Proceedings of the 12th Annual ACM international
Conference on Multimedia, 869-876.
[14]Hsu, C., and Lu, C. 2004. Geometric distortion-resilient image hashing system and its application scalability. In Proceedings of the 2004 Workshop on Multimedia and Security, 81-92.
[15]Foo, J.J., Sinha, R., and Zobel, J. 2007. Discovery of image versions in large collections. Lecture Notes in Computer Science 4352, Springer-Verlag, 433-442.
[16]Levine, M.D. 1985. Vision in man and machine, McGraw-Hill, 574.
[17]Independent JPEG Group, http://www.ijg.org [18]Lowe, D. 2004. Distinctive image features from
scale-invariant keypoints. International Journal of Computer Vision 60, 2, 91-110.
[19]Lew, M., Sebe, N., Djeraba, C., and Jain, R. 2006. Content-based multimedia information retrieval: state-of-the-art and challenges. In ACM Transactions on Multimedia Computing, Communication and Applications 2, 1, 1-19.