Control Chart Pattern Recognition in Metal
Stamping Process using Statistical Features-ANN
Norasulaini Abdul Rahman, Ibrahim Masood, Mohd Nasrull Abdol Rahman, Nurul Fitriah Nasir
Faculty of Mechanical and Manufacturing Engineering, Universiti Tun Hussein Onn Malaysia, 86400 Parit Raja, Batu Pahat, Johor, Malaysia
Abstract— Identification for the sources of unnatural variation (SOV) in manufacturing process is vital in quality control. In case of metal stamping process, the SOV based on special causes has become a major contributor to poor quality product. In recent years, researchers are still debating to find an effective technique for on-line monitoring-diagnosis the SOV. Control chart pattern recognition (CCPR) method has been reported as applicable for this purpose, whereby the existing CCPR schemes were trained using the artificially statistical process control (SPC) samples. Inversely, the trained scheme using real SPC samples have not been reported since the data are limited or not economically available. In this paper, the SPC samples were taken directly from an actual metal stamping process to be used as the dynamic training patterns. The proposed features-based method has resulted in higher diagnosis accuracy (normal patterns = 100%, unnatural patterns = 100%) compared to the raw data-based method (normal patterns = 66.67%, unnatural patterns = 26.97%).
Index Terms—Control Chart Pattern Recognition; Features-Based; Dynamic Training Pattern; Unnatural Variation.
I. INTRODUCTION
In metal-stamping process, it is important to stamp the precise product based on customer requirement. The quality practitioners and production operators must aware any unnatural variation (UV) during in-progress process to avoid defective products. An early monitoring and diagnosing of UV based on control chart patterns (CCP) will effectively trigger against potentially bad production. In-line with the widespread development of machine learning technology in manufacturing industry nowadays, the sources of UV can be identified effectively. The CCP recognition with an artificial neural network (ANN) model recognizers have been investigated and proposed frequently in many reported researches [1- 4]. The CCP recognition technique that focuses on the recognition patterns and regularities data was applied in statistical process control for improving ability in monitoring and diagnosis. An effective identification for the sources of UV can significantly speed up the troubleshooting operations.
Advances in manufacturing and computational technology have enabled real-time, rapid, and integrated gauging and inspection in relation to product quality. An ANN model was utilized to learn to recognize CCP directly through specific sample of SPC patterns in the training phase. An ANN model has excellent noise tolerance in real time, requiring no hypothesis on the statistical distribution of monitored measurements. The advantage of an ANN model to recall learned patterns of noisy representations makes it highly appropriate for CCP recognition [4]. In
previous researches, the features-based ANN method has been reported as able to produce an efficient recognition. If the features input representation can be selected based on specific characteristics of CCP and if their components are reproducible with the process conditions, the recognition accuracy can be increased [5]. The features input representation can be extracted from raw data in various forms such as shape features [6, 7], multi-resolution wavelet analysis [8, 9], and summary statistics [10]. In this paper, a new summary statistics for an ANN model recognizer was studied as dynamic input representation, whereby the training samples were taken directly from an actual metal stamping process.
II. ISSUE IN METAL STAMPING PROCESS
In stamping terminology, the stamp is a general term to denote all press work process. An example of press work is blanking, punching, bending, coining and other processes, which transformed the sheet metal to any shape. The process can contribute to UV when it was running at an out-of-control condition. The process will produce the defective part that affects production and generates waste a losses to the manufacturer. In this paper, the main focus is given on high defects.
Type of defects that typically found in stamped parts are: (i) Static defects such as surface imprints, which is not process-related but instead are caused by contaminated die or tool faces. These defects can be simply corrected by cleaning the die surface before stamping. (ii) Dynamic defects as process-related, are caused by the forming process. For example, cracking and necking commonly found when formability of the deformed sheet material is limited. Table 1 summarizes the common issues occur during in-progress metal stamping process.
Table 1
Type of defects in metal stamping process Process Defect Possible Causes Blanking Blank out
High burr
Clearance between punch and die not equal
Tooling wear and tear Material thickness change Piercing /
Punching
Hole become smaller or bigger High burr
Tooling wear and tear Reverse punch
Punch not be guided in stripper plate
Bending
Spring back
Cracking Die-height setting change Tooling wear and tear
III. RESEARCH METHODOLOGY
In this paper, the development of the proposed CCP recognition scheme can be described based on three phases.
A. PHASE 1: Identification of Quality Defect
The SPC samples that represent the CCP were collected from inspection of stamped parts or products. At this stage, the fishbone diagram was applied in analyzing the type of defect and possible root causes of such defect.
The defects can be classified to: (i) static defect and (ii) dynamic defects. Static defects such as scratches, water mark, dent, and others usually occur due to improper handling of stamping process or location of sheet metal storage.
For dynamic defects, rubbing mark or marking lines can be observed when sheet metal undergoes high tensile stresses as it flows over sharp tool corners. High burr occurs when sharp edges inherent in press work such as shearing, blanking, and piercing and others. These problem defects can be minimized by controlling process variables.
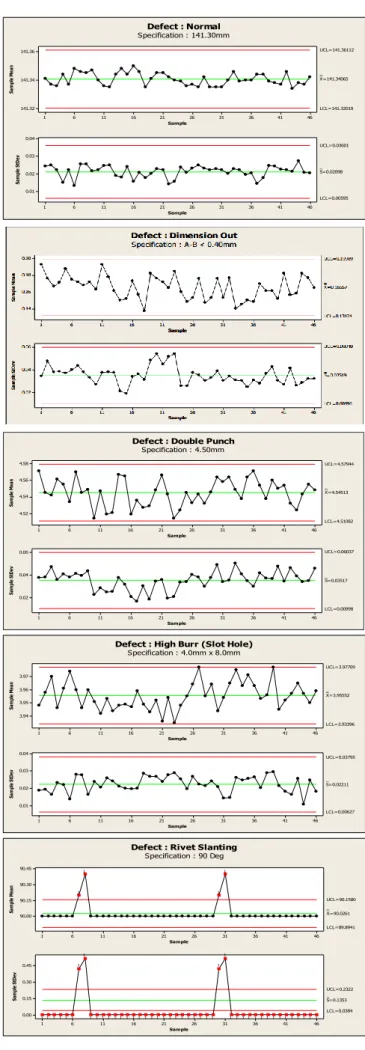
In this paper, there are four types of dynamic defects were identified to be recognized using the CCP recognition scheme. It involves dimension out, high burr, double punch, and rivet slanting. The normal pattern was also included for recognition as reference in comparison to the four types of dynamic defects patterns as shown in Figure 1. The normal pattern had the synchronize distribution within the nominal value. Each CCP was represented by 46 average points in time series (X-bar), whereby each X-bar was represented by 10 inspection samples.
B. PHASE 2: Pattern Recognizer Design
a) Network: Multilayer-Perceptrons (MLP)
The CCP recognizer was developed based machine learning-based model, i.e., ANN with multilayer perceptrons (MLP) network since it has been reported as applicable for this purpose. The MLP network consists of single hidden layer with 24 neurons. The basic idea of this method is to determine the proportion of the error that corresponds in the weights of each node [11]. Figure 2 shows the MLP architecture comprising an input layer, an output layer, and single hidden layer.
Figure 2 MLP architecture 46 41 36 31 26 21 16 11 6 1 141.36 141.34 141.32 Sample Sa m pl e M ea n _ _ X=141.34065 UCL=141.36112 LCL=141.32019 46 41 36 31 26 21 16 11 6 1 0.04 0.03 0.02 0.01 Sample Sa m pl e St D ev _ S=0.02098 UCL=0.03601 LCL=0.00595 Defect : Normal Specification : 141.30mm 46 41 36 31 26 21 16 11 6 1 4.58 4.56 4.54 4.52 Sample Sa m pl e M ea n _ _ X=4.54513 UCL=4.57944 LCL=4.51082 46 41 36 31 26 21 16 11 6 1 0.06 0.04 0.02 Sample Sa m pl e St D ev _ S=0.03517 UCL=0.06037 LCL=0.00998
Defect : Double Punch Specification : 4.50mm 46 41 36 31 26 21 16 11 6 1 3.97 3.96 3.95 3.94 Sample Sa m pl e M ea n _ _ X=3.95552 UCL=3.97709 LCL=3.93396 46 41 36 31 26 21 16 11 6 1 0.04 0.03 0.02 0.01 Sample Sa m pl e St D ev _ S=0.02211 UCL=0.03795 LCL=0.00627
Defect : High Burr (Slot Hole) Specification : 4.0mm x 8.0mm 46 41 36 31 26 21 16 11 6 1 90.45 90.30 90.15 90.00 Sample Sa m pl e M ea n _ _ X=90.0261 UCL=90.1580 LCL=89.8941 46 41 36 31 26 21 16 11 6 1 0.45 0.30 0.15 0.00 Sample Sa m pl e St D ev _ S=0.1353 UCL=0.2322 LCL=0.0384 1 1 1 1 1 1 1 1 1 1 1 1 1 1 1 1 1 1 1 1 1 1 1 1 1 1 1 1 1 1 1 1 1 1 1 1 1 1 1 1 1 1 1 1 1 1 1 1 1 1
Defect : Rivet Slanting Specification : 90 Deg
Figure 1 The CCP from metal stamping process
b) Training Algorithm: Levenberg-Marquardt
training and testing. However, it is not easy to select which training algorithm that is able to provide the fastest detection with accurate result. It depends on many factors including the complexity of the problem, the number of points in training CCP, the number of weights and biases in the network, the error goal and whether the network is being used for discriminant analysis or function approximation [12].
In this study, the Levenberg-Marquardt (LM) algorithm was considered in training the MLP network. In computing and mathematics, a numerical solution to the problem concerning minimizing a function particularly appears in nonlinear programming and least square curve fitting, over a space of the function's parameter is provided by the LM, which is also recognized as Damped Least-Squares (DLS) method. This algorithm was mainly applied for the problems of least curve fitting [13]. When training using the LM algorithm, it uses the approximation to the Hessian matrix in the following Newton-like update:
Δw = [JT J + µI]-1JTe (1)
where;
H = JTJ (Hessian matrix) g = JTe (Jacobian matrix)
c) Selection of Input Representation
Selection of input representation will influence the performance of an ANN recognizer. The input representation must be able to distinguish the CCP to lead more efficient recognizer.
In this study, two types of input representation were investigated: (i) statistical feature, and (ii) raw data. The extraction of the different features can be seen by different patterns of input representation. This selection aims to obtain the compact set of input representation, which captures the prominent characteristics of the CCP. Both input representation were applied based on window size of 10.
1. Statistical Features
The features-based input representation was applied to overcome the undefined pattern. In previous studies, features-based can be categorized as statistical features, shape features, frequency count features, summary statistic features, and wavelet-denoise features. In the signal recognition area, selection of good features will help to reduce the complexity of the pattern recognizer. It can enable the recognizer to distinguish the types of pattern clearly. The use of extracted shape features or statistical features from the SPC samples can reduce the network size and learning time. Statistical features that consists of mean, standard deviation, skewness, mean-square value, autocorrelation and CUSUM has been reported as provided better recognition accuracy for ANN compared to the raw data [10, 14].
In this study, a new set of statistical features was applied as input representation for an ANN recognizer to obtain better recognition accuracy. Based on a series of screening simulation, three statistics values, i.e., mean (average), maximum, and minimum were selected. These values are extracted from raw data or standardized SPC samples. These
values determine the number of neurons (3) in input layer, while the CCP determine the number of neuron (5) in output layer.
2. Raw Data
Most of the reported researches used raw data as input representation. Its recognition performance was quiet limited since it requires large network size, more training effort and time-consuming. The observation of dynamic data transformed using common pre-processing technique namely standardization [15] and normalization [16]. Standardization is a procedure to linearly transforms the sample (Xt) into standard normal variates (Zt). It can be performed using the following equation:
Zt = (Xt - µ) / σ (2)
Where; µ = mean
σ = standard deviation
An ANN recognizer will be more efficient when input representation fall within a certain range [16].
d) Training and Testing
The training and testing of an ANN recognizer are important to evaluate the effectiveness of the selected input representation method. All patterns were fully developed when they appeared within the recognition window (10). Before the input data patterns are presented into an ANN for the learning process, it can be divided to training (60%), validation (20%), and preliminary testing (20%) sets [16]. These sample sets were then randomized to avoid possible bias in the presentation order of the sample patterns to an ANN. The recognition target was set at 95% accuracy for normal and unnatural CCP.
IV. RESULTS AND DISCUSSION
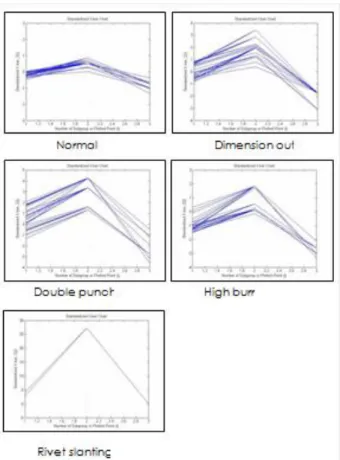
Figure 3 and Figure 4 show the graphical plots for the statistical features input representation and the raw data input representation respectively. Generally, it can be concluded that different input representation gives different patterns. Obviously, the statistical features with mean, maximum, and minimum values indicate a clear identification for each CCP. Normal pattern has a small range (-1 to 1) for the average of stream data compare to the pattern of defects (dimension out, double punch, high burr & rivet slanting). Inversely, the raw data with 10 standardized samples values indicate almost the same trend of CCP, which is difficult to distinguish.
Figure 3 Patterns for statistical features input representation
Figure 4 Patterns for raw data input representation
A. Hidden Neuron vs. Recognition Accuracy
The monitoring and diagnosis performance of the statistical features ANN and raw data ANN recognizer were evaluated based on recognition accuracy and mean square error measures. The respective results can be summarized in Table 2 and Table 3.
In this study, the number of neuron in single hidden layer was used as the manipulated parameter to select the best recognition accuracy. It ranged from 10 to 35.
There is comparison between the normal patterns and the unnatural patterns for both types of input representation. The statistical features ANN gave the highest recognition accuracy (100%) at hidden layer neuron equal to 29.
Based on the results, it can be concluded that the recognition accuracy was not influenced by the increasing number of hidden layer neuron. Depending on specific case, there is no specific number of hidden layer neuron can be set to produce the highest recognition accuracy.
Table 2
Training results for the statistical features ANN recognizer
V. CONCLUSIONS
In this study, the assumption as suggested by previous researchers has been found as acceptable in designing a CCP recognition scheme based on an ANN model recognizer. An ANN with the statistical features input representation provided better recognition accuracy compared to an ANN with the raw data input representation. The extracted statistical features based on values of mean, maximum, and minimum gave a simpler network, speed up the training time, as well as computational efforts to become more efficient in detecting unnatural CCP.
Table 3
Training results for the raw data ANN recognizer
ACKNOWLEDGMENT
The authors would like to thank Universiti Tun Hussein Onn Malaysia (UTHM) who sponsoring this research (IGSP grant, U248).
REFERENCES
[1] Ebrahimzadeh, A., Addeh, J. and Ranaee, V. 2013. Recognition of Control Chart Patterns Using an Intelligent Technique. Applied Soft Computing Journal. 2970-2980.
[2] Wang, J., Kochhar, A. and Hannam, R. 1998. Pattern Recognition for Statistical Process Control Chart. The International Journal of Advanced Manufacturing Technology. 99-109.
[3] Masood, I. and Hassan, A. 2010. Issue in Development Artificial Neural Network-Based Control Chart Pattern Recognition Schemes. European Journal of Scientific Research. 336-355.
[4] Bag, M. and Gauri, S.K 2012. An Expert System for Control Chart Pattern Recognition. International Journal Advanced Manufacturing Technology. 291-301.
[5] Pacella, M, Semeraro, Q. and Anglani, A. 2014. Adaptive Resonance Theory-Based Neural Algorithms for Manufacturing Process Quality Control. International Journal of Production Research. 4581-4607.
[6] Wani, M.A. and Rashid, S. 2005. Parallel Algorithm for Control Chart Pattern Recognition. Proceedings of the 4th International Conference on Machine Learning. 89-96.
[7] Gauri, S.K. and Chakraborty, S. 2009. Recognition of Control Chart PPatterns Using Improved Selection of Features. Computer and Industrial Engineering. 1577-1588.
[8] Ebrahimzadeh, A. and Ranaee, V. 2010. Contol Chart Pattern Recognition Using an Optimized Neural Network and Efficient Features. ISA Transaction. 387-393.
[9] Ranaee, V. and Ebrahimzadeh, A. 2011. Control Chart Pattern Recognition Using a Novel Hybrid Intelligent Method. Applied Software Computing. 2676-2686.
[10] Hassan, A., Nabi Baksh, M.S., Shaharoun, A.M. and Jamaluddin, H. 2003. SPC Chart Pattern Recognition Using Statistical Features. International Journal of Production Research. 1587-1603.
[11] Rumelhart, D.E., Hinton, G.E. and William, R.J. 1986. Learning Internal Representations by Error Propagation. Parallel Distributed Processing. Vol.1. 318-362.
[12] Mahdiani, M., Judi, H.M. and Ashaari, N.S. 2014. Abnormal Control Chart Pattern Classification Optimisation Using Multilayered Perceptrons. Research Journal of Applied Sciences, Engineering and Technology. 4690-4695.
[13] Saravanan, A. and Nagarajan, P. 2013. Performance of ANN in Pattern Recognition for Process Improvement Using Lavenberg-Marquardt and Quasi-Newton Algorithm. IOSR Journal Engineering. 8-13.
[14] Hassan, A., Nabi Baksh, M.S., Shaharoun, A.M. and Jamaluddin, H. 2006. Feature Selection for SPC Chart Pattern Recognition Using Fractional Factorial Experimental Design. Virtual International Conference on Innovative Production Machine and Systems.
[15] Nelson, L.S. 1989. Standardization of Shewhart Control Chart. Journal of Quality Technology. 287-289.
[16] Demuth, H. and Beale, M. 1998. Neural Network Toolbox, User’s Guide. The MathWorks Natick.