1
Improving the quality of written feedback using written feedback
Corresponding author: Maggie Bartlett, Keele School of Medicine, David Weatherall Building, Keele University, Staffordshire, ST5 5BG, UK.
Tel: 01782 734681
Email: [email protected]
James Crossley, University of Sheffield Medical School, Beech Hill Road, Sheffield, S10 2RX, UK.
Tel: 0114 222 5372
Email:[email protected]
Robert McKinley, Keele School of Medicine, David Weatherall Building, Keele University, Staffordshire, ST5 5BG, UK.
Tel: 01782 734664
Email: [email protected]
This work was conducted at Keele School of Medicine.
We would like to acknowledge the help of Dr Natalie Cope of Keele School of Medicine for her help with the graphical representation of the results.
There was no external funding for this work. We have no conflicts of interest to declare.
2 Abstract (198 words)
Background
Educational feedback is amongst the most powerful of all learning interventions. Research questions
1. Can we measure the quality of written educational feedback with acceptable metrics? 2. Based on such a measure, does a quality improvement (QI) intervention improve the
quality of feedback?
Study design
We developed a QI instrument to measure the quality of written feedback and applied it to written feedback provided to medical students following workplace assessments. We evaluated the measurement characteristics of the QI score using generalisability theory. In an uncontrolled intervention, QI profiles were fed back to GP tutors and pre and post intervention scores compared.
Study results
A single assessor scoring 6 feedback summaries can discriminate between practices with a reliability of 0.82.
The quality of feedback rose for two years after the introduction of the QI instrument and stabilised in the third year.
The estimated annual cost to provide this feedback is £12 per practice. Interpretation and recommendations
It is relatively straightforward and inexpensive to measure the quality of written feedback with good reliability. The QI process appears to improve the quality of written feedback. We recommend routine use of a QI process to improve the quality of educational feedback.
3
Key words: feedback; undergraduate medical education; educational assessment; quality improvement.
Status Box
What is already known in this area
Educational feedback is powerful in promoting learning
Workplace based assessment in both undergraduate and postgraduate settings often involves the provision of written feedback
Written feedback after workplace based assessment is variable in its quality and usefulness
What this work adds
It is possible to measure the quality of written feedback with an acceptable degree of reliability
Providing practices with feedback on the quality of their written feedback to students can be used to improve its quality
Focussed faculty development visits to practices are effective in improving the quality of the written feedback they provide
Suggestions for further research
To evaluate the effectiveness of faculty development visits on the within practice variation in the quality of written feedback
To explore impact on verbal feedback received by students of these changes in written feedback
4 Main Paper (2822 words)
Background
Educational feedback is amongst the most powerful of all learning interventions [1, 2] and, unsurprisingly, there has been substantial research interest in it. Recent work has drawn attention to the two-way dynamic involved in face-to-face feedback and its critical
importance for the learner. [3, 4] Attention is being paid to the credibility of feedback to the learner, what the learner does with the feedback and institutional factors that support or impair feedback. [5-7]
In the context of medical education however, a very substantial volume of educational feedback is provided in written form, typically following assessment in the workplace. Such workplace based assessments (WBAs) are widespread in both undergraduate and
postgraduate medical education all over the world. Written feedback may be the only form of feedback (for example in multisource feedback) or it may supplement a verbal feedback interaction. Either way, in our view, the provision of written feedback is a different skill to the provision of face-to-face feedback.
In the undergraduate context, medical students perceive that feedback is inadequate in both quality and quantity. This appears to be a worldwide problem. [3] In the postgraduate context written comments accompanying WBA are rarely useful for learners. [8]
We wished to study interventions aimed at improving the quality of written feedback arising from WBAs.
Context
At Keele, 25% of the clinical curriculum (115 days) is delivered in primary care where students learn and practice generic clinical skills. [9] During these placements, students have a series of formative WBAs of their consultation skills using a validated instrument. [10] General practice teachers generate a written summary of the verbal discussion after each
5
WBA as an aide memoire of the discussion. We make use of a medical model when training our GP tutors to tap into their existing cognitive frameworks for complex tasks, describing the need to ‘diagnose’ the strengths and weaknesses of a learner’s consultation skills in order to produce a ‘management plan’ for future learning. The summaries are thus referred to as ‘Educational Prescriptions’ (EPs).
Routine teaching review visits to practices take place every three years once they are established and stable. During these visits, placement quality information from a variety of sources is discussed, including the quality of the EPs. Where practices are outliers for any of our quality assurance indicators extra visits are made to support development.
Over the four academic years (2010/11 to 2013/14), we used a mean of 97 teaching practices, ranging from small rural practices with two doctors and 2000 patients to large inner city practices with more than ten doctors and 20,000 patients. [11] While we cannot, and do not wish to, provide exactly equivalent experiences for all students, it is important that the quality of the WBAs and EPs is consistent in order that students have broadly similar opportunities for learning as a result of having good feedback on their consultation skills. We sought to enhance the quality of EPs provided by our practice tutors, which had been unacceptably variable.
We apply the same principles to giving feedback to our GP tutors as to our students. We make opportunities to have dialogue with them; supporting written information with verbal discussions during practice visits and tutor development sessions. Elam et al [12] showed that feeding information back had a measurable and sustained effect on the engagement of tutors with faculty development activities, and there is evidence that when tutors have the
opportunity to compare their performance with that of others there is an increased incentive to do better. [13] Focusing on particularly poorly performing teachers has been shown to be effective. [14]
6 Research questions
We have studied the quality of written educational feedback arising from WBAs involving directly observed practice. We examined the value of a written quality improvement (QI) feedback intervention as part of an overall QI package to improve written educational feedback. We address two questions:
1. Can the quality of written educational feedback be measured with acceptable metrics? 2. Based on such a measure, does providing feedback to practice tutors on the quality of
the written feedback they provide improve the quality of that feedback?
Method
1. The development of a Quality Improvement Instrument
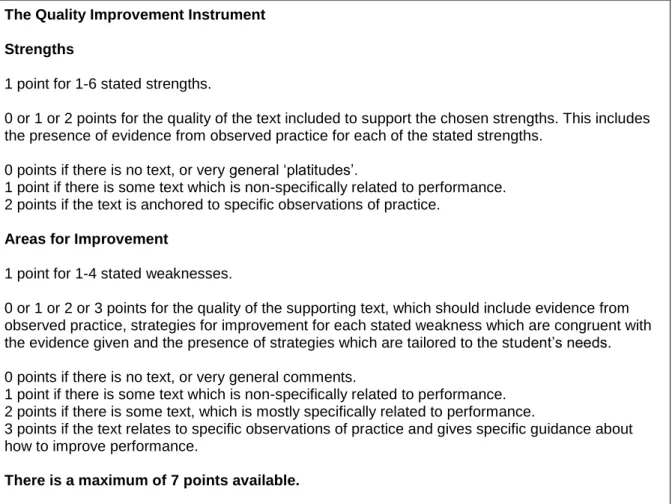
In the academic year 2010/11, the academic GP team at Keele designed a QI instrument (see figure 1) for measuring the quality of the EPs. The team reached consensus during a round table discussion, informed by the published literature on feedback. [2, 15] The majority of the team taught students in their own practices and carried out the WBAs themselves, so that they could comment on what was practical, desirable and achievable in practices. Because of this we did not consider it necessary to include other GP tutors in the discussions. The consensus reached was that the EPs should contain clear descriptions of what students did well and clear statements of the areas for improvement, linked to observed behaviours at the level of the task rather than the self. [2] Both should be anchored in specific consultations to aid recall and emphasise the relevance of the feedback to real clinical practice; building ‘logical connections’ for students.[2] The numbers of identified strengths and areas for improvement
should be limited and prioritised so that students can focus their efforts to improve in the most important areas identified in the verbal discussion; this simplification, provided by the EP, making change more achievable.[15] The aspiration was for the tutors to be able to provide ‘perfectly accurate feedback’ as described by Ericsson [16] and clearly described
7
strategies for improvement in order that students could undertake sustained ‘deliberate practice’ to progress towards expertise. [16] Three points were allocated to this aspect of the feedback because of its importance in helping students to improve.
Insert figure 1 here
2. Testing the reliability of the QI instrument
Phase 1: A pair of assessors scored the final EP from a series of three submitted for each third year student (n=131 EPs from 25 practices) in the academic year 2010/11. This year group was chosen because a new curriculum was being implemented and recent faculty development had focused on the workplace based assessments. We wanted all tutors to be up to date with the process. This was followed by a calibration exercise between the two
assessors which informed the training of the rest of the team who would score the EPs in the main study.
Phase 2: In the following academic year (2011/12), all 612 EPs prepared by the GP tutors for fourth year students (for the same reason as in phase 1) were independently scored by three assessors. Sources of score variance were explored using generalisability theory (which quantifies all sources of error within the available data). [17] This enabled us to determine how many EPs we needed to assess from each practice to achieve an acceptable level of reliability.
3. Testing the feasibility of the QI system
We considered that the major determinant of feasibility was the total time taken to score the EPs. In phase 1, two assessors had independently scored a sample of 131 EPs (those from a single year group) and the mean time taken to score one EP was calculated. From this, the cost in terms of academic time was calculated using the mean salary of the clinical academics involved.
8
Phase 3: The QI instrument was discussed with GP tutors during faculty development activities (meetings and routine teaching review visits) in 2011-2012 so that they were familiar with the content and how we were assessing the quality of the feedback they were providing. At the end of each of three academic years (2011-2014), for each practice teaching students in years 3, 4 or 5 of the Keele MBChB programme, we scored six EPs and
calculated their mean scores. This was then presented as a ‘league table’ showing the mean EP score for each practice, using identification numbers rather than names. Practices were aware of their own identifier. The league table is part of a package of feedback sent out to practices at the end of each academic year which includes an explanatory letter giving details of the QI process.
The content and outcomes of the QI process were reinforced during faculty development sessions and all developmental visits to practices over the subsequent academic years.
Ethical statement
At the time this work was conducted, Keele School of Medicine had an overarching
agreement that assessment data could be used on an anonymous basis for research and quality improvement. Under the terms of this agreement, specific ethical approval was not required for this study. However, ethical principles were adhered to; all data were treated as
confidential and anonymised by the researchers. No practices or students are identifiable from this work.
Analysis
1. Testing the Reliability of the QI instrument
In this work, we consider the unit of analysis to be a teaching practice as students are placed in a practice rather than with an individual GP tutor, and all feedback is given at practice level.
9
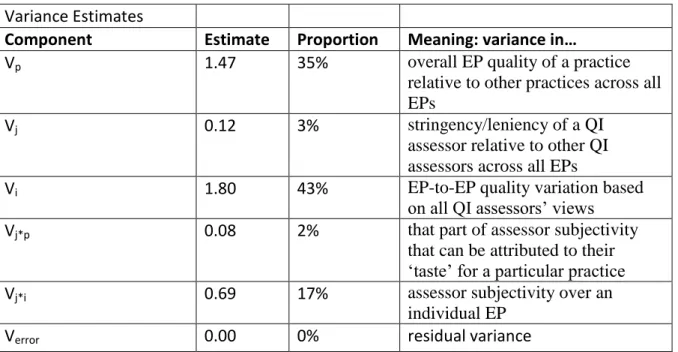
To investigate the reliability of the QI instrument (phase 2) we conducted an exploratory study of variance using Variance Component Analysis (Varcomp in SPSS 21; MINQUE procedure) to estimate the contribution of each assessment parameter to QI score variation. For further details of the analysis, please see the statistical appendix.
2. Improving the quality of the written feedback
In our uncontrolled comparison across four successive years, we present raw summary data (means and standard deviations) for EP quality across each year and identify the timing of the key QI intervention so that readers can check the appropriateness of our conclusions.
Results
1. The Reliability of the QI instrument
In phase 2, the 612 EPs for 122 students in 37 practices were each scored by three assessors. In a perfectly reliable system all the score variance will depend on the practice. In a totally unreliable situation, all the score variance will depend on unintended variables such as assessor subjectivity or EP-to-EP variation with the practice. Table 1 shows the G-study results.
Insert table 1 here:
The D study (table 2) shows that a single assessor scoring six EPs from each practice would achieve a reliability of 0.8.
Insert table 2 here:
2. Improving the quality of the written feedback
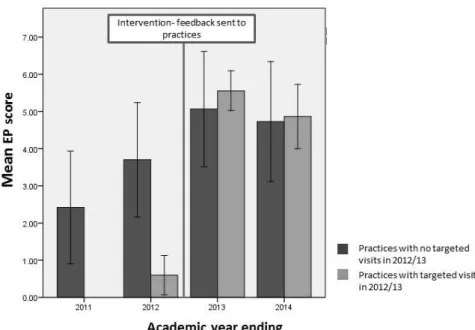
The mean EP quality score rose by 1.3 points between 2010/11 and 2011/12 (from 2.4 to 3.7 points, p<0.001). This was before any feedback was sent to the practices. Mean EP quality scores from the academic year 2011/12 were fed back to 85 practices for the first time, after which the mean score for all practices rose by 1.4 points from 3.7 to 5.1 (p<0.001). During 2012/13, three practices had specific faculty support focussing on their WBAs which had
10
been triggered by their poor EP scores: for these practices, the mean score rose from 0.6 to 5.6 (p<0.001). Taking these practices’ data out of the analysis made little difference to the results (1.4 vs 1.36 points increase for the remaining practices).
In the academic year 2013/2014 the mean score had stabilised at 4.7 (with a non-significant fall of 0.4 points, p=0.4).See figure 2.
Insert figure 2 here
Regarding the effect of routine teaching review visits, there was no significant difference between the mean EPs scores for the 30 practices which had a visit in either 2011/12 or 2013/14 and the 56 which did not have a visit (visited; mean score 4.84 (SD 1.29), not visited; mean score 4.9 (SD 1.63); p=0.8).
3. The Feasibility of the QI system
The estimated time taken annually to provide this feedback to around 100 practices is 28 hours of academic time, at a cost of £1200 (based on the mean hourly rate of pay for those involved). In this study, this task was shared between eight faculty members and took place during the summer when teaching commitments are reduced. As the generation of EPs is via an electronic platform and can be downloaded directly, there is no administrative time involved.
Discussion
We have described the development of a quality improvement system aimed at improving the quality of written summaries of feedback discussions between GP tutors and students as part of workplace based assessments.
11 Main findings
It is relatively straightforward to measure the quality of written feedback with good reliability, and we have found the process to be feasible in terms of the time taken and the cost. This answers research question 1 and provides us with a metric to address research question 2.
We have demonstrated that there has been a significant overall improvement in the quality of the written feedback for students since the introduction of the QI system. Part of this
improvement is likely to be due to tutors’ increasing familiarity with the workplace based assessments and the electronic platform by which they are reported, and part due to our QI system of ‘universal’ practice training about the characteristics of a good EP, the provision of individual written QI feedback in a ‘league table’ format and with or without specifically targeted practice visits. Using the system has allowed us to identify a group of practices providing particularly low quality written feedback as measured by the scale and work with them to improve. For this group there was a significant and sustained improvement over the following two years (figure 2).
Our intervention design does not allow us empirically to isolate the comparative impact of ‘universal’ training, individual written feedback and routine practice visits. However, we conclude from the progressive score profiles that the feedback intervention and the practice visits add significant value as part of the overall QI package. The stabilisation in the final year may be as a result of regression towards the mean and ceiling effects.
Strengths and Limitations
Our work focusses on written feedback – a type of feedback that has attracted relatively little research attention but accounts for a high proportion of a learner’s feedback experience and is therefore important from a learning perspective. We have investigated a fairly
12
degree of specialist input. Our context is typical of many undergraduate medical programmes and has many features in common with postgraduate programmes and programmes for other healthcare professionals. Furthermore, we have included the whole cohort of learners and education providers. These features should make our findings widely applicable.
There are however limitations to this work. This is a single school study and only two academic years after the intervention have been included; it is possible that later changes in quality may occur in either direction. The faculty members who devised the scale also scored the EPs and led development sessions and visits; these individuals are all part of a small close team and are likely to be subject to ‘group think.’ We chose to use the practice as the unit of analysis rather than the individual tutor. This was a deliberate choice since students are placed with practices, not individual tutors, and each practice is a learning community with a distinctive learning environment. [18] However, it is likely that some of the variation in EP quality within a practice (43% of all variance) reflects differences between relatively skilled and unskilled tutors rather than individual tutor variability. If so, then the true reliability of the instrument in discriminating between tutors will be better than we have estimated. This is a naturalistic, uncontrolled study which makes it difficult to conclude which aspects of the overall QI intervention have the greatest impact on the quality of written feedback. Next steps
Although we have shown that this process of systematically assessing the quality of written summaries of WBA has improved the quality of the summaries and improvement which we wish to sustain, we have also demonstrated considerable within practice variation on the quality of feedback which may be due to variations in the expertise of those undertaking the WBAs and which we aim to reduce through targeted faculty development using face to face meetings. We have not shown that the verbal feedback received by students has improved: this is an avenue for further research.
13 Interpretation and recommendations
We have demonstrated that, for a modest investment (£12 per practice), it is possible to measure the quality of written feedback with an acceptable degree of reliability, and that providing practices with feedback on the quality of their written feedback to students can be used to improve its quality. In particular, focussed faculty development visits to low scoring practices identified by means of the QI instrument lead to significant and sustained change.. It would be possible to reduce the overall time and cost burden by targeting the QI process to new practices or those where concerns are raised by other QA activities and involving administrative staff in the compilation and analysis of data. However, as a result of our experience we would recommend the routine use of a proportionate and clear QI process to improve the quality of educational feedback.
Acknowledgements
We would like to acknowledge the help of Dr Natalie Cope of Keele School of Medicine for her help with the graphical representation of the results.
References
[1] Black P, Wiliam D. 1998. Inside the black box - Raising standards through classroom assessment. Phi Delta Kappan 80(2):139.
[2] Hattie J, Timperley H. 2007. The power of feedback. Rev Educ Res 77(1):81-112.
[3] Nicol D. 2010. From monologue to dialogue: improving written feedback processes in mass higher education. Assess Eval High Edu 35(5):501-17.
[4] Lefroy J, Hawarden A, Gay SP, McKinley RK, Cleland J. 2015. Grades in formative workplace-based assessments – a study of what works for whom and why. Med Educ 49: 307-320.
[5] Brown E, Glover C, Freake S, Stevens V. 2004. Evaluating the effectiveness of written feedback as an element of formative assessment in science. The Open University 12th
14
Improving Student Learning Symposium. Retrieved 27.6.2015 Available at http://www.open.ac.uk/fast/pdfs/Brown%20et%20al%20(2005).pdf
[6] Agius NM, Wilkinson A. 2014. Students’ and teachers’ views of written feedback at undergraduate level: a literature review. Nurse Educ Today. 34: 552-559.
[7] Watling C. Cognition.2014. Culture, and credibility: deconstructing feedback in medical education. Perspect Med Educ 3(2):124-8.
[8] Vivekananda-Schmidt P, MacKillop L, Crossley J, Wade W. 2013. Do assessor comments on a multi-source feedback instrument provide learner-centred feedback? Med Educ 47(11):1080-8.
[9] McKinley RK, Bartlett M, Coventry P et al. 2015. The systematic development of a novel integrated spiral undergraduate course in general practice. Educ Pri Care 26:189-200.
[10] Lefroy J, Gay S, Gibson S, Williams McKinley RK. 2012. Development and Face Validation of an Instrument to Assess and Improve Clinical Consultation Skills. Int J Clin Skills5(2): 77-87.
[11] Bartlett MH, Webb M, McKinley RK. 2015. The investment of a new medical school in its local medical community. Educ Pri Care 26: 89-94.
[12] Elam P, Scales M, Pearson D.2009. Do visits help improve the quality of teaching within undergraduate teaching practices? Educ Pri Care 20(6): 429-434.
[13] Nicholson S, Cook V, Cason F, Carter Y. 2005. Maintaining the quality of community based education: an evaluation system for giving student feedback to undergraduate general practice tutors. Educ Pri Care 16:184-191.
[14] Pincavage A, Cifu A. 2015. Faculty member feedback reports. Clin Teach 12:50-54. [15] Archer JC. 2010. State of the science in health professional education: Effective feedback. Med Educ 44:101-108.
15
[16]Ericsson KA, Krampe R T, Tesch-Romer C. 1993. The role of deliberate practice in the acquisition of expert performance. Psych Rev 100: 363-406.
[17] Crossley J, Davies H, Humphris G, Jolly, B. 2002. Generalisability: a key to unlock professional assessment. Med Educ 36:972-978.
[18] Wenger E. 1998. Communities of practice: learning, meaning, and identity. Cambridge University Press: New York, NY, USA.
Statistical appendix
Details of the analysis using generalisabity theory
The parameters in the model were: Vp (the overall EP quality of the practice relative to other
practices across all EPs), Vj (the stringency/leniency of the QI assessor relative to other QI
assessors across all EPs), Vi (EP-to-EP quality variation based on all QI assessors’ views),
Vj*p (that part of assessor subjectivity that can be attributed to their ‘taste’ for a particular
practice), Vj*i (assessor subjectivity over an individual EP). This was followed by a D study
to calculate the reliability of a range of different numbers of assessors scoring different numbers of EPs, to determine the most efficient way to achieve reliability of greater than or equal to 0.8. The D-study used the following formula:
G=Vp/(Vp+(Vi/Ni)+(Vj*p/Nj)+(Vj*i/(Nj*Ni)) where Ni is the number of EPs per practice
submitted for QI, and Nj is the number of QI assessors. This model assumes that the same
16
Table 1: the results of the G study
Table 2: the results of the D study Variance Estimates
Component Estimate Proportion Meaning: variance in…
Vp 1.47 35% overall EP quality of a practice
relative to other practices across all EPs
Vj 0.12 3% stringency/leniency of a QI
assessor relative to other QI assessors across all EPs
Vi 1.80 43% EP-to-EP quality variation based
on all QI assessors’ views
Vj*p 0.08 2% that part of assessor subjectivity
that can be attributed to their ‘taste’ for a particular practice
Vj*i 0.69 17% assessor subjectivity over an
individual EP
Verror 0.00 0% residual variance
No of cases Assessors per case
1 2 3 1 0.36 0.40 0.42 2 0.57 0.59 0.60 3 0.68 0.69 0.70 4 0.74 0.75 0.76 5 0.78 0.79 0.80 6 0.82 0.82 0.83 7 0.84 0.84 0.85 8 0.86 0.86 0.86 9 0.87 0.88 0.88 10 0.88 0.89 0.89
17
Figure 1: the scale for scoring the written feedback provided to students as part of workplace based assessments in general practice (the QI instrument).
The Quality Improvement Instrument Strengths
1 point for 1-6 stated strengths.
0 or 1 or 2 points for the quality of the text included to support the chosen strengths. This includes the presence of evidence from observed practice for each of the stated strengths.
0 points if there is no text, or very general ‘platitudes’.
1 point if there is some text which is non-specifically related to performance. 2 points if the text is anchored to specific observations of practice.
Areas for Improvement
1 point for 1-4 stated weaknesses.
0 or 1 or 2 or 3 points for the quality of the supporting text, which should include evidence from observed practice, strategies for improvement for each stated weakness which are congruent with the evidence given and the presence of strategies which are tailored to the student’s needs. 0 points if there is no text, or very general comments.
1 point if there is some text which is non-specifically related to performance. 2 points if there is some text, which is mostly specifically related to performance.
3 points if the text relates to specific observations of practice and gives specific guidance about how to improve performance.
18