CRANFIELD UNIVERSITY
Anandadeep Mandal
The Governing Dynamics of Stock-Bond Return Co-movements –
A Systematic Literature Review
School of Management
Master of Research
MRes
Academic Year: 2011 -2012
Supervisor: Prof. Sunil S. Poshakwale
August 2012
CRANFIELD UNIVERSITY
School of Management
Master of Research
MRes
Academic Year 2011 -2012
Anandadeep Mandal
The Governing Dynamics of Stock-Bond Return Co-movements –
A Systematic Literature Review
Supervisor: Prof. Sunil S. Poshakwale
August 2012
This thesis is submitted in partial fulfilment of the requirements for the degree of Master of Research
© Cranfield University 2012. All rights reserved. No part of this publication may be reproduced without the written permission of the copyright owner
Abstract
Understanding stock-bond return correlation is a key facet in asset mix, asset allocation and in an investor’s portfolio optimisation strategy. For the last couple of decades, several studies have probed this cardinal relationship. While initial literature tries to understand the fundamental pattern of co-movements, later studies aim to model the economic state variables influencing such time-varying volatility behaviour of stock-bond returns. This study provides a systematic literature review in the field of stock and bond return correlation.
The review investigates the existing literature in three key dimensions. First, it examines the effect of macro-economic variables on SB return co-movements. Second, it illustrates the effect of financial integration on the asset correlation dynamics. Third, it reviews the existing models that are employed to estimate the dynamic relationship. In addition to the systematic review, I conduct an empirical analysis of stock-bond return co-movements on U.S. capital market. Both the literature and the empirical investigation substantiate my claims on existing research gaps and respective scope for further research. Evidence shows that existing models impose strong restrictions on past stock-bond return variance dynamics and yield inconclusive results. I, therefore, propose an alternative method, i.e. copula function approach, to model stock and bond time-varying co-movements. Since the previous studies largely focus on developed economies, I suggest an empirically investigation of emerging economies as well. This will allow me to examine the effect of financial integration on the dynamic asset return correlation.
Apart from this academic contribution, the study provides an illustration of the economic implications which relate to portfolio optimization and minimal-risk hedge ratio.
Keywords: stock and bond, time-varying volatility, asset allocation, systematic literature review
Acknowledgements
I extend my sincere gratitude and appreciation to many people who made this research project possible. Special thanks to my supervisor Prof. Sunil S. Poshakwale. I am highly indebted to him for guiding me in carrying out this literature review in the field of capital markets. I would also like to acknowledge with much appreciation the pain he has undertaken for the completion of my project in due course of time.
Special thanks to Dr. Stephanie Hussels and Ms. Heather Woodfield for assisting me in developing my systematic review protocol, which is a major component of this study. I also thank my additional panel members, especially Dr. Yacine Belghitar for their valuable insights. Additionally, I thank Ms. Wendy Habgood for her administrative support.
TABLE OF CONTENTS
Abstract ... i
Acknowledgements ... iii
List of Figures ... vii
List of Tables ... viii
1 Introduction ... 1
2 Theoretical Background ... 3
2.1 Stock Price and Return Volatility ... 3
2.2 Bond Price and Yield Volatility ... 5
2.3 Stock-Bond Return Co-movements ... 6
3 Methodology ... 9
3.1 Rationale for Systematic Review ... 9
3.2 The Consultation Panel ... 10
3.3 Search Strategy ... 10
3.3.1 Key Word Search ... 11
3.3.2 Resources ... 12
3.4 Selection Criteria ... 13
3.4.1 Selection Criteria for Abstracts ... 13
3.4.2 Selection Criteria for Full Papers ... 14
3.4.3 Quality Appraisal ... 14
3.5 Cross Referencing... 16
3.6 Selected Articles ... 16
3.7 Data Extraction for Accepted Papers ... 16
3.8 Data Synthesis ... 17
4 Descriptive Account of the Literature ... 18
4.1 Journal Characteristics ... 18
4.2 Description of the Studies’ Content ... 21
5 Thematic Findings ... 23
5.1 Macro-economic variables and SB return co-movement ... 23
5.1.1 Standard Macro Factors ... 24
5.1.2 Risk-premium Factors ... 25
5.1.3 Liquidity Factors ... 26
5.2 Effect of Financial Integration on SB Return Co-movement ... 27
5.2.1 Financial Integration ... 27
5.2.2 SB Return Co-movements ... 28
5.3 Modelling the SB return co-movement ... 29
5.3.1 Dynamic Factor Model ... 32
5.3.2 Modelling the state variable dynamics ... 33
5.3.3 Affine Asset Pricing Models ... 35
5.3.4 SB Return Correlation in Affine Pricing Model ... 38
vi
5.4.1 The VECH Model ... 39
5.4.2 The BEKK Model ... 40
5.4.3 The FARCH Model ... 40
5.4.4 The Constant Correlation Model ... 41
5.5 Properties of the GARCH Models ... 42
6 Empirical Analysis ... 45
6.1 Data and Methodology ... 45
6.2 Results ... 46
6.3 Discussion and Scope for Future Research ... 49
7 Conclusion ... 53
7.1 Illustration of Economic Importance ... 53
7.2 Contribution of this Review ... 54
7.2.1 An Alternative Approach ... 55
7.2.2 Copula Function Approach ... 56
7.3 Implications for my Doctoral Research ... 57
7.4 Limitations ... 59
Personal Learning ... 61
References ... 65
Appendices ... 75
Appendix A: Data Extraction Forms ... 75
Appendix B: Literature Mapping ... 102
Appendix C: Argument Mapping ... 103
Appendix D: Conditional Moment Tests... 105
List of Figures
Figure 3-1: Search Strategy ... 11
Figure 4-1: Journal-wise Distribution of Publications ... 18
Figure 4-2: Year wise Distribution of Articles ... 19
Figure 4-3: Description of Quantitative Techniques ... 20
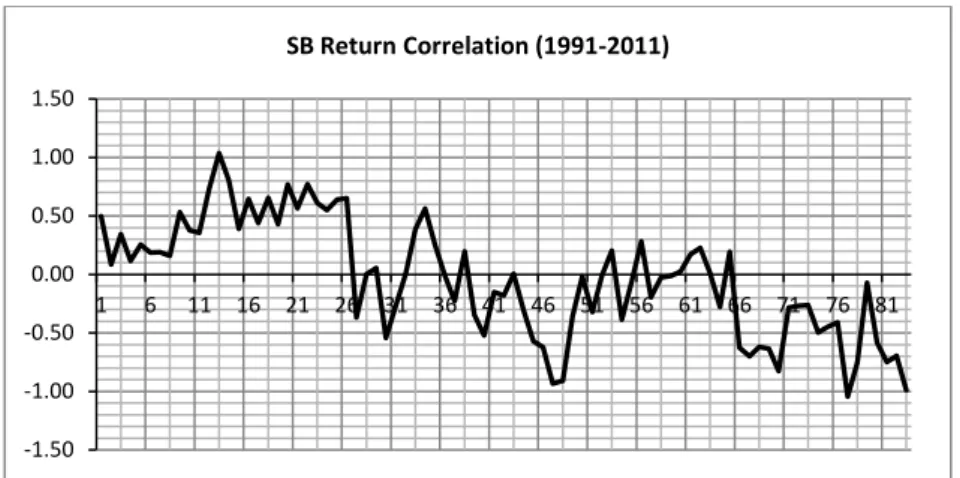
Figure 5-1: SB Return Correlation adopted from Baele et al. (2009) ... 30
Figure 6-1: Dynamic SB Return Correlation ... 47
Figure 6-2: Fitted Value of SB Return Variance a ... 49
Figure 7-1: The Investment Process ... 53
Figure 7-2: Estimating Portfolio Payoff using a Gaussian Copula ... 57
Figure 7-3: My Learning Curve... 62
Figure 7-4: My Learning Style ... 63
viii
List of Tables
Table 3-1: Consultation Panel ... 10
Table 3-2: Search Strings ... 12
Table 3-3: Illustrative Preliminary Search Results ... 12
Table 3-4: Databases ... 13
Table 3-5: Selection Criteria for Abstracts ... 13
Table 3-6: Selection Criteria for Full Papers ... 14
Table 3-7: Quality Assessment Tool ... 15
Table 3-8: Overview of the Systematic Literature Review Methodology Process ... 16
Table 3-9: Data Extraction Form ... 16
Table 4-1: Description of Data Used ... 20
Table 4-2: Extract of the Studies' Content ... 21
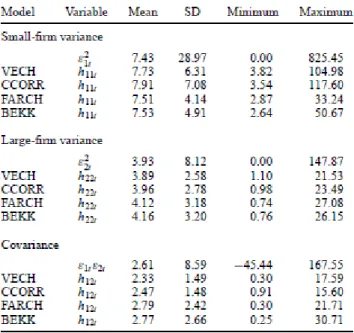
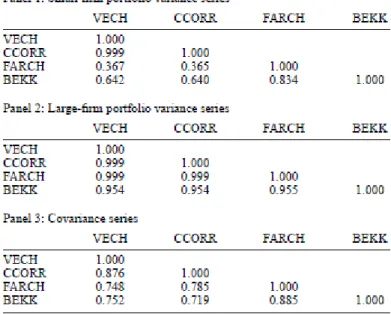
Table 5-1: Estimated Variance and Covariance Series a ... 43
Table 5-2: Correlation of MGARCH Model Estimates a ... 44
Table 6-1: Description of Variables ... 45
Table 6-2: Descriptive Statistics of SB Return Correlation ... 46
Table 6-3: Unit Root Tests a ... 47
Table 6-4: Impact of Macroeconomic Variables on SB Return Correlation a ... 48
Table 6-5: Test of Significance of Explanatory Variables a ... 48
1
Introduction
Following the financial crisis of 2007, academics as well as practitioners have been keen to understand the behaviour of financial assets in turbulent economic conditions. Asset allocation has attracted the attention of investors and researchers in the domain of portfolio return prediction and forecasting. The key requirements for understanding the approach to asset allocation are return, risk and the correlation of the asset classes. Ever since the seminal work of Markowitz (1952) asset correlation has been the prime focus of portfolio management. Bonds provide fixed income whereas stocks provide returns adjusted to the risk undertaken by an investor. Hence, choosing a combined portfolio of bonds and stocks allows the investor to optimise their return and diversify their risk. An investor adjusts the asset mix periodically in order to consider time-varying investment payoffs and risk factors associated with a portfolio. The lower the correlation the more suitable are the assets for diversification. Consequently, correlation of assets is decisive for risk management and control.
Against this backdrop, the aim of this systematic literature review, as a part of my doctoral study, is threefold. First, a sound literature review is central to my research as it will form the foundation for developing an informed conceptual model. This will enable me to build on and contribute to existing knowledge in the relevant fields. Second, a review of the existing theoretical and empirical knowledge is likely to reveal relevant constructs and third, it will help to lay the theoretical foundation which will subsequently guide the research questions for my successive empirical study. Based on the findings of a broad investigation of relevant literature domains in my scoping study, my overarching review question which I aim to answer in this systematic review is: “To
what extent, according to the literature, is time-varying stock-bond return correlated?”
Drawing on this overarching question, I have three sub-questions that will help me in addressing the key issue. The sub-questions are:
1. Are the effects of macroeconomic variables on stock-bond returns in different economies common?
2. What are the effects of global integration on stock-bond return correlation? 3. How can the influence of macroeconomic variables on stock-bond return
2
My approach to this literature review has a number of distinctive features. First, I cast a clear approach to inclusion of papers for the review. The selection of the papers is based on well illustrated criteria, which assures that the study captures the key facets of the phenomenon under investigation. Second, I carry out an empirical analysis on the SB return co-movements illustrating the distinctive aspects of the time-varying phenomena. Third, the study provides a research question highlighting the necessity for further enquiry in the relevant field of SB return correlation.
The rest of the study unfolds as follows. Section 2 provides the theoretical background of my research. Section 3 details the literature review methodology. Section 4 provides the descriptive findings and Section 5 discusses the thematic findings of the extant literature. Section 6 provides an empirical analysis of SB return co-movements employing a model estimation procedure and discusses the avenues for further research. Finally, Section 7 concludes the study, highlighting the contribution of the literature review.
2
Theoretical Background
In this section I provide the conceptual background, setting the scope for the study. It is divided into three sub-sections, which are bond-return and yield volatility, SB return co-movements and stock price and return volatility which I discuss next.
2.1
Stock Price and Return Volatility
Monthly standard deviation estimates of US stock returns for the period 1860 to 2011 vary from negative 15 percent to positive 25 percent (Bekaert and Engstrom, 2010; Scruggs and Glabadanidis, 2003). Tests for estimation error for this large deviation strongly reject the hypothesis of constant variance. Significant changes in ex ante market volatility can have important implications for risk-averse investors, capital investments, consumption and other economic state variables. This gives rise to the question why stock returns vary over time, which I am going to discuss now.
Researchers in the past have studied aggregate variability of stock market returns. While Officer (1973) relates stock market volatility to macroeconomic factors, Christie (1982) attributes financial leverage as the primary principle for this time-varying phenomenon. Early attempts were made to associate market volatility with expected equity returns. Examples include Merton (1980), French et al. (1987) and Bollerslev et al. (1988). Mascaro and Meltzer (1983) and Lauterbach (1989) relate macroeconomic volatility to interest rate changes.
Over the years researchers have investigated the behaviour of stock market returns. The two most commonly investigated patterns relating to stock market volatility are i) the relationship between market returns and market volatility and ii) the variance in expected return pertaining to high frequency data (Berument and Dogan, 2012). Regarding the former, studies employing asset pricing models state that there is a positive relationship between market return and volatility (Lintner, 1965; Merton, 1973; Sharpe, 1963). Authors have used numerous estimation techniques with different specifications to state that investors require risk premiums to compensate for risky investments (Bekaert et al., 2007; Bollerslev et al., 1988; Campbell and Ammer, 1993; Scruggs and Glabadanidis, 2003). However, Cox and Ross (1976), Bekaert and Wu (2000) and Whitelaw (2000) propose a conflicting relationship for the above
4
phenomenon. Thus, the relationship between market return and volatility remains inconclusive.
In particular, extending on the work by Campbell (1988) and French et al. (1987), empirical studies reveal two puzzling results relating to intertemporal market return and volatility. First, as discussed, the studies provide negative conditional correlation between return and volatility. Second, authors reveal a significant dynamic relationship of this phenomenon (Brandt and Kang, 2004; Glosten et al., 1993; Whitelaw, 1994). In particular, using a multivariate generalized auto-regressive conditional heteroskedastic (MGARCH) model, Glosten et al. (1993) show that during the post World War-II period the estimated volatility coefficients are negative. For the same time period, using monthly data, Whitelaw (1994) reveal a negative long-run correlation between the fitted moments as a function of pre-determined financial variables. Moreover, when short-run correlation is measured over 17-month horizon, it varies from -0.8 to 0.8. This evidence is supported by Boudoukh et al. (1997), employing a non-parametric estimation of annual data.
These results are interesting as they refute the commonly held intuition of a positive relationship between market return and volatility. Two predominant questions arise. First, relating to the consistency of the results, do these findings pertain to both general equilibrium models and time-series properties of the exogenous variables? Second, what factors generate the counter-intuitive pattern of market return and volatility?
Concerning the volatility pattern of expected returns for high frequency data, the literature states that investors behave differently on different days of the week. While individual investors are more active during the early days of the week, institutional investors are less active on Mondays (Lakonishok and Maberly, 1990). Documenting the day-of-the-week effect, literature claims that Mondays have negative returns in contrast to Fridays, which see significantly positive returns (Agrawal and Tandon, 1994; Chang et al., 1993; French, 1980; Osborne, 1962). The key reasons are i) news released over the weekend are reflected on the first day of the week, ii) most informed trading occurs on the first day relative to the remaining days of the week and iii) preferences of individual traders differ from institutional traders.
Yet, in order to explain the variation in returns of a diversified portfolio, it is critical to understand the factors that affect not only equities but also bonds, which assure fixed income. Hence, I next discuss the factors that affect bond returns.
2.2
Bond Price and Yield Volatility
Researchers have used duration analysis to estimate the changes in the interest rates, which affect prices of fixed-income securities. The concept of duration was first demonstrated by Macaulay (1938). It provides a comprehensive understanding of a bond’s time-dimension, rather than term to maturity. Much of the theoretical research in this field is based on the concept of duration. Studies have concentrated on identifying the relationship between bond price change and duration for a given change in yield. Samuelson (1945) uses duration to study the effect of change in interest rate on a portfolio of bonds. He considers the effect of increase in interest rates along a yield curve and concludes that there is a capital gain in liability position for an increase in the interest rates. Grove (1974) considers the case of shift in yield curves and reaches at the same conclusion. Furthermore, literature shows that analysing yield curves based on duration rather than maturity generate better bond price forecasting results (Hopewell and Kaufman, 1973). Yawitz (1977) state that bond price volatility is determined by two factors i) yield volatility and ii) bond’s duration. While the former is market-determined the latter is a mathematical expression to capture the effect of shift in yield curves on price volatility.
Authors in the past have tried to establish a relationship between the arrival of ‘news’ and its affect on the yield curve. Economic events trigger unexpected changes in the underlying variable, affecting an asset’s cash flows and also the discount rates used to value these cash flows. Urich and Wachtel (1984) and McQueen and Roley (1993) show that the producer price index (PPI) impacts bond prices by affecting interest rates. Roley and Troll (1983) provide evidence that the industrial production index influences interest rates. Studies further show that the consumer price index (CPI), unemployment rate and balance of trade have a significant effect on interest rates, which determines bond price volatility (Hardouvelis, 1988; McQueen and Roley, 1993). Hardouvelis (1988) also provide evidence of disposable income, retail prices and demand of durable goods to have an impact on interest rates.
6
A related line of literature looks at future markets using intra-day price information data. Examples include Ederington and Lee (1993) and Harvey and Huang (2002). Specifically they study the impact of economic news release on Treasury bond and Eurodollars. The findings confirm the results of the previous studies. CPI, PPI, unemployment rate and demand for durable goods have significant volatility effects on interest rates, affecting futures prices. However, evidence shows that yields have changed in ways not fully addressed by theory. To address this issue, Cox et al. (1985) and Vasicek (1977) employ a single factor model to study the effect of short-term interest rate. Brennan and Schwartz (1979) uses two-factor model to examine the effect of economic factors on long-term interest rates. Elton et al. (1996) study the spread between short-term and long-term interest rates using a similar two-factor model. They use two intermediate maturity bond yields as a proxy for the short-term interest rate volatility. In a similar vein, Balduzzi et al. (1996) employ a three-factor affine term structure model to examine short-term interest rates, long-term or the mean interest rate and volatility of the mean of the term interest rates. They conclude that only short-term rate is significant across bond yields with all maturities.
Arguing from a classical standpoint, a nominal interest rate can be decomposed into a real interest rate and an inflation component that consists of an inflation premium and expected inflation. Theories that relate to determination of interest rate consider real interest rate as intertemporal marginal rates of substitution such as consumption growth rates. In production-based models, Breeden (1986) and Cochrane (1991) use marginal growth rates of transformation, i.e. expected output growth rates, as a measure of real interest rate. Liquidity-preference models consider the role of central banks in controlling the nominal and real interest rates. In traditional quantity theory, money supply and business cycle are related to inflation, whereas in the Phillips-curve point of view inflation is tied to the economic cycle. This emphasises that the economic factors and news announcements, which affect bond price volatility are still not clearly theorised.
2.3
Stock-Bond Return Co-movements
The literature on SB return co-movements has received much attention over the last few years. Many academics have attempted to explore the co-movement of stock-bond
returns. Shiller and Beltratti (1992) employ a dynamic present value model to conclude that annual stock-bond correlation of U.S. and U.K. data are abnormally high to be explained by a theory. Campbell and Ammer (1993) adopt the same method to estimate the variances and co-variances of post-war U.S. monthly stock and bond returns. Both studies assume return co-movement as time-invariant. Yet, Barsky (1989) provides a theoretical justification for SB asset-correlation. He states that the co-movements are state-dependent. In particular, he identifies that diminishing productivity growth and increasing market uncertainty have a negative influence on firm profits and real interest rate, which drives stock and bond prices to vary inversely.
Researchers moved in the direction of identifying and investigating the time-invariant characteristics of SB return volatility. Scruggs and Glabadanidis (2003) reject models that impose time-independent correlation restriction on SB returns covariance matrix. Fleming, Kirby and Ostdiek (1998) study the influence of information flow on volatility of stock, bond and money markets. They associate the link between information flow and volatility, but do not explore in depth the specific information that causes the SB return covariance. Officer (1973) and Schwert (1990) attempt to explain the changes in SB return volatilities by examining macroeconomic state variables. The studies found weak relationship between macroeconomic variables and stock volatility, but failed to establish any significant relationship with specific variables. Yet, David (2008) shows that uncertainty about inflation and firm earnings explain some changes in SB return volatility and co-movement. Stivers and Sun (2005) employ regime-switching models to analyse short-run dynamics of SB co-movements. More precisely, they investigate the “flight to quality” issue by examining the impact of stock market volatility on bond yields. In a similar vein, Gulko (2002) uses the same methodology to confirm that significant changes in SB co-movement patterns around an economic crisis.
A related stream of literature considers high frequency data to examine how short-run SB price movements are influenced by news announcements. Examples include Fleming and Remolona (1999), Balduzzi et al. (2001), Fair (2003), Andersen et al. (2005) and Andersson et al. (2008). In particular, these studies provide important insights on price adjustments, but fail to explain long-run asset return co-movements.
3
Methodology
This section discusses the methodology used to develop this systematic literature review. Consistent with Tranfield et al.’s (2003) methodology for developing ‘evidence-informed management knowledge’, I elaborate in detail on the steps taken in conducting this study.
3.1
Rationale for Systematic Review
Stemming from medical science, systematic reviews are a new phenomenon in social science research. Alternative to a traditional narrative literature review, the methodology of the systematic review incorporates a precise review protocol, which provides an “audit trail of the reviewers decisions, procedures, and conclusions” (Cook et al., 1997, in Tranfield et al., p. 209). In order to avoid biases the systematic review process ensures that the methods of selecting and evaluating literature are explicitly reported.
The value of a systematic review can be justified on the grounds of four main issues. First, it follows a rigorous and transparent process that minimises the limitations of a traditional narrative-based review. The latter provides a partial picture, which suffers from the reviewers’ diverse biases such as “their own pet theories, […] funders, […or] the perceived need to produce positive findings in order to get published (Petticrew and Roberts, 2006, p. 5). Second, a review of a single study is seldom conclusive and “the amount of conflicting information often makes deciding where the ‘balance of evidence’ on any question lies difficult” (Petticrew and Roberts, 2006, p. 22). Alternatively, the systematic review approach allows researchers to draw conclusions based on relevant and quality evidence (Tranfield et al., 2003). Third, the systematic review enables the researcher to get a comprehensive picture regarding a specific phenomenon by summarising evidence and differentiating explanations among studies. Forth, it provides avenues to oppose the established paradigms and ‘schools of thought’ through a rich and meticulous investigation of the existing evidence, which underpins a specific social phenomenon. This further facilitates in scoping future research directions to advance theory building (Petticrew and Roberts, 2006). A systematic review, therefore, involves scientific strategies to limit bias, assemble, critically analyze and
10
synthesise relevant studies that dwell upon a specific phenomenon on interest. These details are discussed next.
3.2
The Consultation Panel
To contribute to the quality and validity of the systematic review, I relied on a review panel consisting of both academicians and practitioners. Consequently, this will “help direct the process […] and resolve any disputes over the inclusion and exclusion of studies” (Tranfield et al., 2003, p. 214). The table below provides an overview of the panel members and their respective roles.
Table 3-1: Consultation Panel
Person Title/Organization Role
Prof. Sunil Poshakwale
Professor of Finance, Cranfield School of Management
Supervisor
Dr. Yacine Belghitar
Senior Lecturer in Finance, Cranfield School of Management
Internal Advisor & Panel Member
Dr. Stephanie Hussels
Lecturer in Entrepreneurship, Cranfield School of Management
Systematic Review Expert
Dr. Antti Ilmanen Managing Director, AQR Capital Management (Europe) LLP.
External Advisor
Heather Woodfield Social Science Information Specialist, Cranfield School of Management
Literature Search Advisor
3.3
Search Strategy
In an effort to produce a thorough literature review it is pertinent to develop a sound and robust search strategy. The flow chart below gives an account of my search strategy.
Does It Generate Relevant Search? Identify the Key Words
Form the Search String
Select Database
Test the Search String
Modify Search String / Key Words Indentified NO
YES
Does It Generate Relevant but also include
Irrelevant Articles?
NO YES
Modify Search String (Add NOT operator; W/x; etc)
Select Articles based on Abstract Selection Criteria
Select Articles based on Full Paper Selection Criteria
Scrutinize Articles based on Quality Assessment Tool
Final Papers for Systematic Review
Figure 3-1: Search Strategy
My search strategy included the identification of search strings and keywords. I searched three databases and indentified additional publications through cross-referencing.
3.3.1 Key Word Search
The table below illustrates the various key words that I have used to develop my search string. Key words are categorized based on the thematic areas defining my review question.
12
Table 3-2: Search Strings
No. Strings
1 stock-bond or “Stock and Bond” or stock w/5 bond
2 correlat* OR co-varia* OR covaria* OR co-movement OR comovement OR volatil*
3 futures OR gold OR options OR oil OR commodities OR CDS OR Real Estate
The final string is as follows: String (1) AND String (2) NOT String (3). This results in:
all (stock-bond or “Stock and Bond” or stock ws bond) AND all(correlat* OR co-varia* OR coco-varia* OR co-movement OR comovement OR volatil*) NOT all(futures OR gold OR options OR oil OR commodities OR CDS OR Real Estate)
In order to exclude papers relating to others fields of finance, I included the NOT operator in the search string. It includes futures, gold, options, oil, commodities and real estate. This was developed through an iterative process. An illustrative example of the preliminary search results is shown below.
Table 3-3: Illustrative Preliminary Search Results
Search String Database No. Of
Articles 1 all(stock-bond) AND all(correlat* OR co-varia* OR covaria* OR co-movement
OR comovement OR volatil*)
ABIa 85
2 all(stock-bond or “Stock and Bond”) AND all(correlat* OR co-varia* OR covaria* OR co-movement OR comovement OR volatil*)
ABIa 607
3 all(stock w/5 bond) AND all(correlat* OR varia* OR covaria* OR co-movement OR coco-movement OR volatil*) NOT all(futures OR gold OR options OR oil OR commodities OR CDS OR Real Estate)
ABIa 233
4 all (stock-bond or “Stock and Bond” or stock w/5 bond) AND all(correlat* OR co-varia* OR covaria* OR co-movement OR comovement OR volatil*) NOT all(futures OR gold OR options OR oil OR commodities OR CDS OR Real Estate)
ABIa 345
a
The articles pertain to ABI/Inform Complete Scholarly Journals
3.3.2 Resources
For the literature search I draw on three databases namely EBSCO, ABI and Scopus. Table 3-4 gives a description of them. A preliminary search revealed that EBSCO and ABI contain a substantial amount of the relevant literature. Hence, it was redundant to include additional databases such as Science Direct and Emerald. Yet, addressing the
recommendation of Ms Heather Woodfield, I included Scopus to identify additional publications. This being said, Scopus did not lead to the identification of additional articles.
Table 3-4: Databases
Database Description
EBSCO Business Premier
The world’s largest full text database covering 2,950 scholarly business journals and comprehensive full text coverage for regional business publications. Abstracts are available from the year 1886 for important scholarly periodicals.
ABI/INFORM Global
Provides a wide range of information covering over 3,750 publications. The coverage years span from 1923 till present.
Scopus World’s largest abstract and citation database for peer-reviewed journals
3.4
Selection Criteria
The search based on the above mentioned criteria yielded a large number of papers. These papers were then scrutinised in a two step process based on the criteria illustrated below to be included in the systematic review. First, the abstracts were evaluated. Second, the full texts were screened.
3.4.1 Selection Criteria for Abstracts
The selection criteria for the abstracts were based on six key dimensions. These are illustrated in the table below.
Table 3-5: Selection Criteria for Abstracts
Criteria Variables Rationale
Topic Stock-Bond Return Correlation
The review aims to illustrate the findings and claims made by different authors explaining the stock-bond return comovements. Therefore, multi-asset correlations and comovements between other asset yields are excluded.
Explanatory Variables
Macroeconomic Variables and announcements
The review includes papers that seek to explain the key issue considering macroeconomic variables and announcements as the exogenous variables.
Time Period From the origin of Modern Portfolio Theory (1952) till date
The review includes all relevant papers that aim to explain the key issue (stock-bond return correlation).
Academic and Scholarly Journals
Peer reviewed journals The literature review only includes articles from peer-reviewed scholarly journals. Working papers and
14
not peer-reviewed and the good ones will turn into papers eventually that shall be reviewed in my analysis.
Economies Developed and emerging economies
The review includes papers concerning both developed and emerging economies to address the two sub-questions: i) Are the effects of macroeconomic variables on SB returns in different economies common? and ii) What are the effects of global integration on SB return correlation?
Approach Empirical and Theoretical
The review includes both the approaches to illustrate and report the findings pertaining to the third sub-questions, i.e. How can the influence of macroeconomic variables on SB return correlation be modelled?
3.4.2 Selection Criteria for Full Papers
After the papers were selected based on abstracts they were then filtered on the basis of full paper selection criteria and quality assessment test to be subsequently included in the review.
Table 3-6: Selection Criteria for Full Papers
Theoretical/Conceptual Papers must contain:
The relevant theoretical background and the link of the model(s) developed to these theories should be clearly discussed
Assumptions underpinning the model(s) developed should be clearly stated
The variables, parameters and the equations of the model(s) should be clearly defined and stated. Proofs and discussions of the critical result(s) and theorem(s) should be provided
The limitations of the model(s)should be stated
The findings of the model(s) should be adequately warranted, providing empirical evidences or real time events.
Empirical Papers must contain:
The empirical work should be aligned with existing theories and / or previous empirical work(s) A clear description of sample used, stating the time period, context, etc. and its validity for
generating conclusions
Variables should be clearly defined and explained
The methodology used should be clearly explained, providing its advantages and limitations Results should be properly explained and discussed
Results should be aligned to the aim of the research
The claims and contributions of the study to the current understanding of the field should be properly stated with adequate warranting, highlighting the generalisability of the findings. The study should highlight potential areas of future research.
3.4.3 Quality Appraisal
For the papers to be finally included in the literature review, all relevant full papers selected had to meet the quality appraisal requirements. The details of the quality assessment protocol are shown in Table 3-7: Quality Assessment Tool. Only papers with total scores above four were included in this study.
Table 3-7: Quality Assessment Tool
Factors
Levels
Low or Absent (0) Medium (1) High (2)
Theoretical Background
Absence or insufficient description of theoretical background
Basic Review of theoretical background or summary of empirical articles
Sufficient review of theoretical foundations; research question aligned to the theory; adequate report of previous empirical work
Methodology No explanation of the methodology applied
Acceptable level of research design and methodology used
Clear description of why the methodology is applied and its alignment with the theoretical background and research question; all variables and proxies clear explained
Data Set Proper description of data not provided; time period considered not justified
Adequate description of data set; adequate sample size
Clearly explained data set and its purpose to answer the research question; reason for considering the time frame is clearly mentioned
Data Analysis and Findings
Results are inadequately
described; findings fail to answer the research question
Findings are able to answer the research question
Results are clearly explained; findings are justified by the use of appropriate statistical measures; findings relate to the research aim; results are adequately warranted
Contribution to Knowledge
No theoretical or empirical contribution
Reasonable contribution to existing body of literature
Major contribution to existing body of literature
Limitations and Scope for Future Research
Limitations and future scope of research neglected
Limitations not clearly aligned to the research aim and methodology; scope for future research not stated
Limitation of the study clearly stated; shows direction for future scope of research
16
3.5
Cross Referencing
Cross-referencing is an effective way to identify relevant papers. The full papers selected through the selection criteria were used to identify relevant papers through cross-referencing. The papers identified through this mechanism were then passed through the same selection criteria to be finally included in the systematic literature review.
3.6
Selected Articles
The table below reports the overview of the screening process illustrated in this section.
Table 3-8: Overview of the Systematic Literature Review Methodology Process
Data Source Records from the Search Strings Abstract Selection Full Paper Selection Quality Assessment Selection Inclusion of Cross Referencing Total after Elimination of Duplicates ABI 345 62 55 43 6 56 EBSCO 853 175 50 50 Scopus 316 43 43 38
The procedure of search and qualitative assessment yielded a final number of 56 articles. The majority of the papers were eliminated as they failed to address the concerned review question. None of the papers were rejected based on their year of publication and language. It is noteworthy that six papers were included from cross-referencing. Yet, all these papers had to fulfil the quality assessment criteria.
3.7
Data Extraction for Accepted Papers
After the final selection of the articles to be reviewed, they were imported to EndNote, a citation management software. Relevant data were then extracted from the selected articles for the subsequent analysis and synthesis. The following table provides the extraction form that was used for data mining.
Table 3-9: Data Extraction Form
Citation
Title: Author(s):
Journal / Source: Year: Key words: Study Background Research Question(s): Data Description: Time Period: Methodology Model Employed: Empirical Contribution Economy: Explanatory Variables: SB Return Correlation: Synthesis
Key contribution(s) to review question: Comments/observations/notes:
The extracted contents of the selected papers are presented in Appendix-A.
3.8
Data Synthesis
The information extracted from the final papers selected for the review were then used to present a coherent synthesis as discussed in section 5. The purpose of data synthesis is threefold: i) provide a clear description of the literature reviewed, ii) state the research gaps and iii) provide an argument, justifying my subsequent research question as discussed in section 0.
Next, I turn my focus to report a descriptive account of the papers included in this review before I discuss the thematic findings in section 5.
18
4
Descriptive Account of the Literature
This section presents the characteristics of the literature reviewed in this study in two distinctive parts. The first part relates to the publication features. The four characteristics discussed here relate to i) journals, ii) historical evolution of the research phenomenon, iii) methodologies adopted and iv) the data used by the authors to substantiate their findings. The second part gives an account of the three principle domains in which the articles can be compartmentalized.
4.1
Journal Characteristics
Figure 4-1 shows the wide range of different publications reviewed in this study. All of them are peer-reviewed journals, which publish theoretical and empirical research in the field of financial economics. Some of the journals included in this study relate specifically to finance, e.g. The Journal of Finance, Journal of Finance and Quantitative Analysis, while the others belong to the area of economics, e.g. The American Economic Review, Journal of Business and Applied Economics and Journal of International Economics.
Figure 4-1: Journal-wise Distribution of Publications
3 1 1 2 1 1 8 5 1 8 5 1 1 3 2 1 7 1 1 1 2 0 1 2 3 4 5 6 7 8
American Economic Review Applied Financial Economics Financial Analysts Journal Jounal of Financial Economics Journal of Business and Economic … Journal of Financial and Quantitative … Journal of International Economics
Journal of Monetary Economics Review of Financial Studies The Journal of Fixed Income The Journal of Portfolio Management
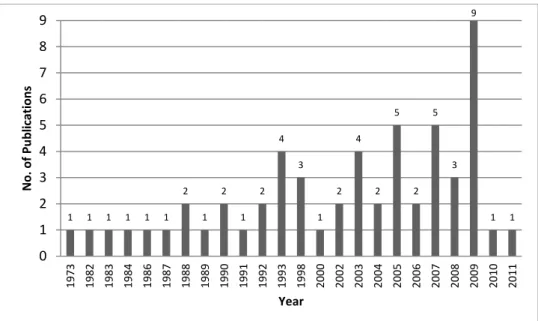
Figure 4-2 below shows the number of studies that have been published over the years relating to SB return co-movements. It is evident that this field is among one of the most widely researched areas in the field of capital markets. Studies related to emerging theoretical concepts and also prescribe recommendations for practitioners, especially in the domain of portfolio management.
Figure 4-2: Year wise Distribution of Articles
The philosophical stances adopted by the authors are homogeneous across the different studies published in various scholarly journals. All of them relate to the positivist research paradigm adopting a realist ontology and an empiricist epistemology. All
1 1 1 1 1 1 2 1 2 1 2 4 3 1 2 4 2 5 2 5 3 9 1 1 0 1 2 3 4 5 6 7 8 9 1973 1982 1983 1984 1986 1987 1988 1989 1990 1991 1992 1993 1998 2000 2002 2003 2004 2005 2006 2007 2008 2009 2010 2011 N o . o f Pub lic ati o n s Year 1 1 1 1 1 1 2 1 2 1 2 4 3 1 2 4 2 5 2 5 3 9 1 1 0 1 2 3 4 5 6 7 8 9 1973 1982 1983 1984 1986 1987 1988 1989 1990 1991 1992 1993 1998 2000 2002 2003 2004 2005 2006 2007 2008 2009 2010 2011 N o . o f Pub lic ati o n s Year
20
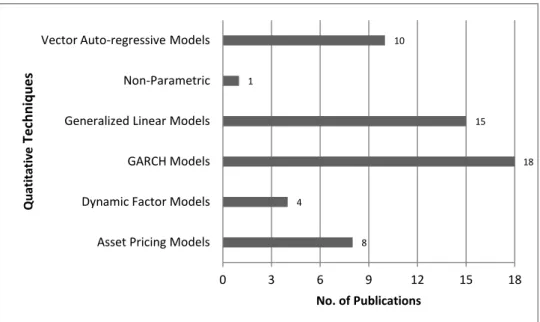
authors employ different quantitative methods for their empirical analysis. Figure 4-3 reports the various methods used to study SB return co-movements.
Figure 4-3: Description of Quantitative Techniques
The studies primarily relate to developed economies. Table 4-1 shows the distribution of empirical data used in exploring the SB return correlation phenomenon.
Table 4-1: Description of Data Used
Data Used No. of
Articles
Countries Type of Data Frequency
U.S. German, British Futures Market tick-by-tick 4
U.S. German, British Index Daily 1
U.S. Index Daily 16
Emerging Economies Index Monthly 6
U.S. Index Quarterly 13
Developed Countries Index Weekly 12
Developed & Emerging Index Monthly 1
Theoretical 3
It is evident that nearly 82 percent of the studies have been conducted on developed economies whereas only 11 percent analyse the phenomenon in emerging economies. Far less research – merely two percent – have been done which take into consideration both developed and emerging economies. Extant literature, therefore, lacks in analysing the impact of financial integration which considers both developed and developing countries. 8 4 18 15 1 10 0 3 6 9 12 15 18
Asset Pricing Models Dynamic Factor Models GARCH Models Generalized Linear Models Non-Parametric Vector Auto-regressive Models
No. of Publications Q u ati tati ve Tec h n iq u e s
4.2
Description of the Studies’ Content
The content of the studies can, be divided in to three principle components i) data used, ii) methodology employed and iii) explanatory variables considered. Table 4-2 provides an illustrative example of the articles studied.
Table 4-2: Extract of the Studies' Content
Ref. No.
Authors Data Methodology Explanatory Variables QAS
1 Andersson et al.
U.S., UK, Germany (daily data)
GARCH Inflation, expected economic
growth, perceived stock market uncertainty
1,1,2,2,2,1 (9)
2 Baele et al. US (daily data)
Dynamic Factor Model
Inflation, expected economic growth, cash flow growth, risk aversion, interest rate
2,2,2,1,1,2 (10)
The quality assessment scores (QAS) reported in the table justify the inclusion of the papers in this systematic review. The individual scores reflect the respective assessment of each of the components as reported in Table 3-7. The aggregate score is presented in parentheses. To exemplify, Andersson et al. (2008) provide a basic review of the theoretical background. They fail to report the essential findings of Bekaert et al.(2007), Barsky (1989), which reveals the time varying dynamics of interest rate in relation to inflation and monetary policy. Thus, the study earns a score of one in the first category, theoretical background, of quality assessment. Concerning the second category, methodology, the authors do not explicitly report why they had selected the GARCH method to estimate the time varying dynamics of SB returns. Consequently, the score for this criterion is one. Yet, the paper precisely reports the data used and discusses in details the findings and the contribution of the research. Hence, each of these three criteria, i.e. data, findings and contribution of the study earn a score of two. The paper gets a score of one in the next criterion as it fails to clearly state the limitations of the methodology and scope for future research. This brings the aggregate score of Andersson et al.’s (2008) paper to nine. Likewise, the QAS for each of the selected article is presented in Appendix-A.
The next section discusses the thematic findings of the literature that relate to my review question.
5
Thematic Findings
In this section I present the main arguments in the literature in three distinct but complementary perspectives. First, I cast a review on the literature relating to the macro-economic variables that influence the SB return co-movements. Second, I focus on the effect of financial integration on co-movement of SB returns. Third, I review the various methods employed to model the time-varying SB return correlation. The key contributions of the SB return co-movement literature are presented in Appendix-B.
5.1
Macro-economic variables and SB return co-movement
Connolly et al. (2005; 2007) inform that SB return correlation varies inversely with stock market volatility. They justify their findings based on the ‘flight to quality’ phenomenon. Their analysis is on high frequency, daily U.S. market data. In a similar vein, Kim et al. (2006) confirm the role of stock market volatility on SB return co-movements in many European markets. They consider a number of economic state variables related to the convergence of the European Monetary Union. Addressing the issue in more depth, d’Addona and Kind (2006) show that real interest rate and inflation volatility influence SB correlation. While the former economic variable has a positive effect on SB co-movement in G7 countries, the latter decreases the asset-return correlation. Guidolin and Timmermann (2005) explore the monthly SB correlation of UK stock and bond markets. The correlations are positive and significant in the bull market while the reverse trend is more observable in the bear market. However, they exogenously determine the bull and bear states of the market, rather than deriving them from some economic state variables.
Boyd et al. (2005) and Andersen et al. (2007) analyse the influence of macroeconomic news announcements on SB markets. They state that discount rate effects drive positive correlation between the markets during economic expansions and cash flow effects have the reverse influence during recessions. Ilmanen (2003) considers i) business cycle, ii) inflation, iii) volatility and iv) the monetary policy setting to explore influence positive and negative SB return comovements and emphasises similar arguments. In contrast, Jensen and Mercer (2003) argue against the ‘flight to quality’ phenomenon to state that
24
SB correlations are higher in recessions than during the expansion phase. Their results are statistically significant for small-cap stocks only.
Schwert (1990) considers macroeconomic volatility, economic activity, financial leverage and trading activities as the various static variables to have influence on volatility of stocks. Wainscott’s (1990) approach to predict correlations between U.S. common stocks and bonds considers the dividends and interest rates as the primary factors for pricing of stocks and bonds. Downing et al. (2009) consider expected cash flows to explain the low correlation between high-grade bonds and equity returns. Similar to Ilmanen (2003), Baele et al.’s (2009) model considers interest rate, inflation1, cash flow growth2 and the output gap3as the economic variables. Moreover, they also take into account some additional factors such as risk aversion4, liquidity proxies5 and inflation uncertainty to view their results on stock-bond return correlation. Brenner et al. (2009) consider the total consumer price index, payroll changes and unemployment news for their study on the effect of macroeconomic news release on U.S. financial markets. Moreover, literature on bond and equity markets (Amihud, 2002; Kamara, 1994) has identified specific macroeconomic state variables that influence SB return co-movements, which I discuss next.
5.1.1Standard Macro Factors
The macro factors generally include the following state variables: inflation, interest rate and output gap. These variables predominantly affect both cash flows and discount rates; hence it is not always easy to predict their impact on SB returns. Owing to the fact that bonds have predetermined fixed cash flows, inflation influences stocks and bond returns differently. Analogously, since an output gap is associated with dividends, they should influence stock returns but not fixed income securities (Baele et al., 2009). However, the term structure of interest rates is affected by both inflation and output gap. Therefore, the two state variables, i.e. inflation and output gap, affect both stock and
1 Inflation is calculated as the log difference of the consumer price index. 2
Cash flow growth includes dividend growth including repurchases (Bekaert and Engstrom, 2010).
3 Output gap is the rate of difference between the gross domestic product and its quadratic trend. 4 Risk aversion factor is calibrated based on Campbell and Cochrane’s (1999) framework. 5 Liquidity proxies are estimated based on Carr and Wu’s (2009) framework.
bond prices. But, since equities are a claim on real assets, expected inflation should not influence the discount rate on stocks. Yet, a recurring finding by Fama and Schwert (1977) state that stock returns are negatively correlated with expected inflation. This also suggests that equities are inadequately hedged against inflation shocks. Campbell and Vuolteenaho (2004) interpret this as money illusion, whereas Bekaert and Engstrom (2010) argue that inflation and risk premiums are correlated. In order to account for risk premium, authors use a number of direct ‘economic’ risk proxies, which I discuss next.
5.1.2Risk-premium Factors
Authors use various measures of economic uncertainty and risk aversion as estimates of SB risk premiums. Bekaert et al. (2009) illustrate that stochastic risk aversion significantly influences positive SB return correlation. They also highlight the increasing level of complexity that arises in analysing the effects on risk aversion. Wachter (2006) shows that risk aversion is positively related to SB premiums, but its effect on interest rates is ambiguous. But, because of the effects of consumption smoothing and precautionary savings, a rise in risk aversion may increase or decrease interest rates respectively. Bekaert et al. (2009) provide evidence for economic uncertainties, which impact risk-premiums and asset valuation. Through the precautionary savings effect an increase in economic uncertainty will lower the interest rates. Hence, it leads to an ambiguous effect on equity valuation that is often considered to be negatively affected with changing economic conditions. Therefore, economic uncertainty can drive SB returns in the opposite direction depending on the effects of term structure and risk-premium.
David (2008) provides an alternative illustration for the use of uncertainty measures. He shows that higher economic uncertainty triggers investors to react more swiftly to information and therefore has a profound effect on asset return covariances.
Baele et al. (2009) uses the empirical proxy of risk aversion based on Bekaert and Engstrom’s (2010) model, which is created using Campbell and Cochrane’s (1995) external habit specification. This fundamental risk aversion proxy is based on historical consumption growth data. Since it behaves counter cyclically it is unlikely to capture complete variations in equity risk-premiums. Bollerslev et al. (2009) show that variance premium has predictive power for forecasting stock returns. Drechsler and Yaron (2011)
26
include additional non-Gaussian components in the consumption growth model. Employing their extended model, they show that risk aversion and nonlinear components significantly influence variance premium. In contrast, Connolly et al. (2005) use an implied volatility estimate as a proxy for stock market uncertainty. They report that SB co-movements are inversely related to stock market uncertainty. This can be justified as ‘flight to safety’, where investors switch from risky assets to other alternative financial instruments which ensures secured returns. Yet, it is not clear whether this effect is due to the market uncertainty or rather reflects on the risk-premium component of the estimating model.
5.1.3 Liquidity Factors
Liquidity affects SB pricing in two central ways. First, it affects the betas, which contributes to the factor exposure effect as observed returns may fail to quickly respond to economic shocks in illiquid markets. Second, economic shocks that increase liquidity may have a positive impact on asset returns. This corresponds to the liquidity price factor. Therefore, the impact of liquidity on SB return co-movement depends on how liquidity shocks vary across markets. For example effects of liquidity may associate with ‘fight to safety’ phenomenon. In periods of economic crisis, investors may move from less liquid stocks to treasury bonds. Consequently, the resulting price pressure effect may trigger negative SB returns co-movement. Monetary policy can affect liquidity in both stock and bond markets. It may increase borrowing constraints or trigger trading activity, influencing SB returns to co-vary. Existing studies by Chordia et al. (2005) and Goyenko et al. (2009) are rather inconclusive in accounting for these liquidity effects.
To address this issue, Baele et al. (2009) consider unconstrainit proxies of liquidity shocks in their estimation model. They use Goyenko et al.’s (2009) proxy for bond market illiquidity and equity market illiquidity proxy based on Bekaert et al.’s (2007) ‘zero return’ concept. This measure positively correlates with Amihud’s (2002) and Hasbrouck’s (2009) price impact and effect cost measures respectively.
5.2
Effect of Financial Integration on SB Return Co-movement
Global integration of financial markets led to opening up of emerging economies to foreign portfolio investment. This enabled portfolio debt and equity flows in emerging markets. This triggered market participants and policy makers to closely watch the cash flow movements in these emerging globally-integrated financial markets. Consequently, researchers have examined the dynamic relationship of SB return co-movements in this emerging global environment.
Over the decade, academics have investigated the impact of stock market integration and liberalization of emerging economies. Examples include Bekaert et al. (2009; 2007) and Henry (2000), Bekaert and Harvey (2000), Patro and Wald (2005) and Kim et al. (2006). Researchers have also examined asset pricing implications of these globalized financial markets (Carrieri et al., 2007). Yet, the literature on impact of market integration on cross-asset relationship is still in its infancy.
Current literature separates market integration from SB return co-movements within the same economy. Therefore, I address the relevant pieces of literature separately.
5.2.1Financial Integration
Financial market integration is a slow process that evolves over time. Liberalisation of emerging economies may also face short-term reversals. To study this phenomenon existing studies employ two broad alternative approaches. First, researchers use economic structural breaks on economic indicators to examine post and pre-liberalisation effects on emerging economies. The studies rely on the official liberalisation date to decide on the period of analysis. Examples include Henry (2000), Bekaert and Harvey (2000) and Bekaert et al. (1998). Second, studies are based on Edison and Warnock’s (2003) approach to measure the ‘intensity of capital control’ by foreign investors.
Henry (2000) and Bekaert and Harvey (2000) document that financial integration enables domestic investors to share their risk with foreign investors. While this reduces the cost of capital, it increases the aggregate level of investment. Bekaert et al. (1998; 2007), Edison and Warnock (2003), and Kim et al. (2006) illustrate positive impacts as a consequence of financial integration. They state that market integration leads to
28
information disclosure and reduction in agency costs, triggering increase in real economic growth, decline in stock market volatility and increase in correlation of beta with world financial markets. De Jong and De Roon (2005) also highlight an improvement in corporate governance mechanisms due to financial integration.
Moving on to asset pricing, Bekaert et al. (2009), Bekaert and Harvey (2000), Carrieri et al. (2007) and De Jong and De Roon (2005) provide insights on transition of emerging markets to world capital markets. International asset pricing models (IAPM) provide estimates of integration-based market returns. In case of liberalised-emerging markets, the models assume that variance in segmented markets is dominated by covariance of integrated capital markets. This assumption is supported by the general framework provided by Bekaert et al. (1998). Carrieri et al. (2007) extends the partial integration concept of IAPM. They introduce an integration index as an exogenous variable, calibrated as the variance ratio of a managed portfolio to the overall country market index. De Jong and De Roon (2005) in their generalized CAPM, introduce a segmentation risk premium factor, which considers emerging market betas to co-vary with world market. This segmentation risk premium, which is priced into the liberalised-market stock returns, relate to the lack of hedging options of the investors for holding non-investible emerging-market assets. Their findings show that as the emerging markets become fully integrated, the cost of capital reduces. Yet, what remains unaddressed is whether this phenomenon impacts the stock market’s relationship with other asset such as fixed-income securities.
5.2.2SB Return Co-movements
The existing studies document how SB returns co-move over time, but not why the returns co-vary together. Early studies by Campbell and Ammer (1993) show that observed levels of SB return co-movements are large enough to be justified by economic fundamentals. They assume correlation of SB returns as time-invariant. Connolly et al. (2005) and Fleming et al. (1998) show that SB co-movement over long-term exhibit positive correlation, but the relationship is dynamic. This suggests that the asset allocation for portfolio diversification continuously changes. In a similar vein, Scruggs and Glabadanidis (2003) exhibit an analogous phenomenon for conditional SB variance in developed markets.
For emerging markets, Kelly et al. (1998) was the first study to examine SB return co-movements. They reveal that in emerging markets the co-movements are greater than in developed financial markets. They attribute it to the country risk in emerging economies and argue that bond investments behave ‘equity like’. Employing institutional investor ratings, Erb et al. (1999) confirm the high degree co-movements of SB returns. More recent studies explore the impact of government policies on SB returns. Li and Zou (2008) documents on the government policy decisions in China and its impact on SB co-movements. Boyer et al. (2006) examines the SB co-movements during a financial crisis. They state that a financial crisis spreads through investments in emerging market equities. Panchenko and Wu (2009) employ a semi-parametric approach to examine the effect of market integration on SB co-movements in emerging markets. Their results are generic, stating that emerging economies provide opportunities for enhanced portfolio diversification. The study does not specify specific factors that relate to the co-movement of SB returns.
Studies on the impact of information flow across asset classes show that shocks in one asset class produces cross-market volatility disturbances. This leads to a portfolio rebalancing (Chordia et al., 2005; Fleming et al., 1998). Chordia et al. (2005) and Connolly et al. (2005) emphasise the ‘flight to safety’ phenomenon. Investors move from risk assets to safer investment options, i.e. bonds in times of economic turmoil. This induces a negative SB return co-movement as the demand for bonds increases whereas the demand for stock decreases, imposing an opposing price pressure. More recent studies by Connolly et al. (2007) and Kim et al. (2006) examine the relationship between stock market volatility and SB return co-movements. They use equity index implied volatility estimates to capture economic uncertainty, which affects stock market volatility. In spite of these exiting studies the governing dynamics of SB co-movement are not sufficiently explained by theory.
5.3
Modelling the SB return co-movement
Post-1968 to 2009, U.S. market shows 19 percent correlation in SB returns (Baele et al., 2009). Shiller and Beltratti (1992) underestimate the empirical SB correlation by imposing constant discount rates in their present value model. In contrast, Bekaert et al. (2009) overestimate the co-movements employing a consumption based asset pricing
30
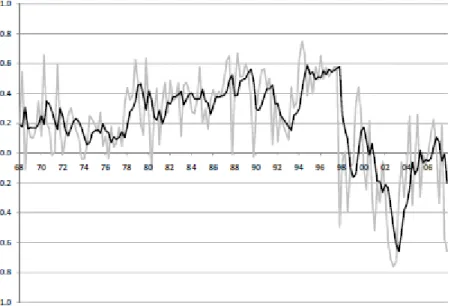
model. Yet, these methods provide substantial evidence of significant correlation estimates using economic state variables. The findings show (cf. Figure 5-1) that SB correlation is as high as 60 percent in the late nineties to as low as negative 60 percent in 2005. An increasing number of authors have documented this time-varying phenomenon using sophisticated statistical models (Guidolin and Timmermann, 2005), but much less research has been done to unravel the underpinning economic sources.
Figure 5-1: SB Return Correlation adopted from Baele et al. (2009)
In particular, Connolly et al. (2005) justify ‘flight-to-safety’ as the primary reason for low SB correlation since 1977. In this regard, authors have proposed various pricing models assigning latent variables to capture for negative SB co-movements.
Schwert (1990) uses 12th order autoregressive predictive models6 to calibrate the volatility estimates of i) stock returns, ii) bond returns and growth rates of i) the producer price index, ii) industrial production and iii) monetary base. Alternatively, Wainscott (1990) calculates the correlations based on rolling averages for the periods of one, three, five and ten years. He examines these correlations to test the predictive power of the future relations based on the historical relations. Ilmanen (2003) uses the
6 t i t i i it i i t D
ˆ ˆ 12 1 12 1wheretdenotes the standard deviation and Dit is the capital gain