On: 09 January 2014, At: 14:23 Publisher: Taylor & Francis
Informa Ltd Registered in England and Wales Registered Number: 1072954 Registered office: Mortimer House, 37-41 Mortimer Street, London W1T 3JH, UK
Critical Reviews in Food Science and Nutrition
Publication details, including instructions for authors and subscription information:http://www.tandfonline.com/loi/bfsn20
Moisture and Shelf Life in Sugar Confections
R. Ergun a , R. Lietha a & R. W. Hartel aa
Department of Food Science , University of Wisconsin , Madison, WI, USA Published online: 28 Jan 2010.
To cite this article: R. Ergun , R. Lietha & R. W. Hartel (2010) Moisture and Shelf Life in Sugar Confections, Critical Reviews in
Food Science and Nutrition, 50:2, 162-192, DOI: 10.1080/10408390802248833 To link to this article: http://dx.doi.org/10.1080/10408390802248833
PLEASE SCROLL DOWN FOR ARTICLE
Taylor & Francis makes every effort to ensure the accuracy of all the information (the “Content”) contained in the publications on our platform. However, Taylor & Francis, our agents, and our licensors make no
representations or warranties whatsoever as to the accuracy, completeness, or suitability for any purpose of the Content. Any opinions and views expressed in this publication are the opinions and views of the authors, and are not the views of or endorsed by Taylor & Francis. The accuracy of the Content should not be relied upon and should be independently verified with primary sources of information. Taylor and Francis shall not be liable for any losses, actions, claims, proceedings, demands, costs, expenses, damages, and other liabilities whatsoever or howsoever caused arising directly or indirectly in connection with, in relation to or arising out of the use of the Content.
This article may be used for research, teaching, and private study purposes. Any substantial or systematic reproduction, redistribution, reselling, loan, sub-licensing, systematic supply, or distribution in any
form to anyone is expressly forbidden. Terms & Conditions of access and use can be found at http:// www.tandfonline.com/page/terms-and-conditions
ISSN: 1040-8398
DOI: 10.1080/10408390802248833
Moisture and Shelf Life in Sugar
Confections
R. ERGUN, R. LIETHA, and R. W. HARTEL
Department of Food Science, University of Wisconsin, Madison, WI, USA
From hardening of marshmallow to graining of hard candies, moisture plays a critical role in determining the quality and shelf life of sugar-based confections. Water is important during the manufacturing of confections, is an important factor in governing texture, and is often the limiting parameter during storage that controls shelf life. Thus, an understanding of water relations in confections is critical to controlling quality.
Water content, which is controlled during candy manufacturing through an understanding of boiling point elevation, is one of the most important parameters that governs the texture of candies. For example, the texture of caramel progresses from soft and runny to hard and brittle as the moisture content decreases. However, knowledge of water content by itself is insufficient to controlling stability and shelf life. Understanding water activity, or the ratio of vapor pressures, is necessary to control shelf life.
A difference in water activity, either between candy and air or between two domains within the candy, is the driving force for moisture migration in confections. When the difference in water activity is large, moisture migration is rapid, although the rate of moisture migration depends on the nature of resistances to water diffusion. Barrier packaging films protect the candy from air whereas edible films inhibit moisture migration between different moisture domains within a confection.
More recently, the concept of glass transition, or the polymer science approach, has supplemented water activity as a critical parameter related to candy stability. Confections with low moisture content, such as hard candy, cotton candy, and some caramels and toffees, may contain sugars in the amorphous or glassy state. As long as these products remain below their glass transition temperature, they remain stable for very long times. However, certain glassy sugars tend to be hygroscopic, rapidly picking up moisture from the air, which causes significant changes that lead to the end of shelf life. These products need to be protected from moisture uptake during storage.
This review summarizes the concepts of water content, water activity, and glass transition and documents their importance to quality and shelf life of confections.
Keywords Moisture, confections, migration, water activity, packaging, water barriers
INTRODUCTION
“Water is life.”
Felix Franks, 2000
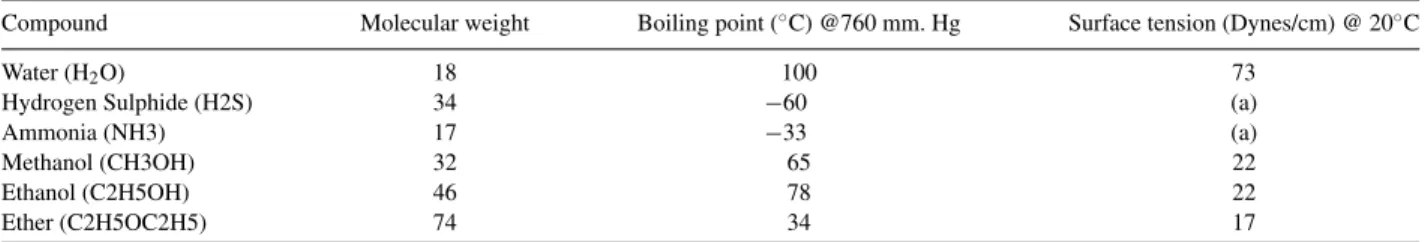
Water is the only inorganic liquid that occurs naturally on earth. It is also the only chemical compound commonly found in solid, liquid, and vapor forms. Water has a higher melting point, boiling point, and heat of vaporization than most other common solvents with similar molecular weight and atomic composition. It also has relatively large values for surface ten-sion, permittivity, heat capacity, phase transition latent heat, and thermal conductivity (Table 1).
Address correspondence to: Richard Hartel, 1605 Linden Drive, De-partment of Food Science, UW-Madison, Madison, WI 53705. E-mail: [email protected]
This unusual macroscopic behavior can be explained by wa-ter’s molecular structure (Franks, 2000). The composition of water (two parts hydrogen to one part oxygen) was discovered by Henry Cavendish (1731–1810) in about 1781. He reported his findings in terms of phlogiston (later the gas he made was proven to be hydrogen) and dephlogisticated air (later this was proven to be oxygen). Since then, countless studies have been done to clarify the structure of water and interactions between water molecules. For a review of the development of the struc-ture of water, see Wallqvist and Mountain (1999).
Each hydrogen atom of a water molecule shares an electron pair with the oxygen atom. The outer electron orbitals of the oxygen atom have a hydrogen atom at each of two corners bound with covalent bonds and unshared electron pairs at the other two corners. The O–H bond length is 0.0958 nm and the H–O–H bond angle is 104.27 (Franks, 2000), very close to 162
Table 1 Comparison of properties of low molecular weight compounds
Compound Molecular weight Boiling point (◦C) @760 mm. Hg Surface tension (Dynes/cm) @ 20◦C
Water (H2O) 18 100 73
Hydrogen Sulphide (H2S) 34 −60 (a)
Ammonia (NH3) 17 −33 (a)
Methanol (CH3OH) 32 65 22
Ethanol (C2H5OH) 46 78 22
Ether (C2H5OC2H5) 74 34 17
Source: http://www.aquadyntech.com/h2ophysprop.html
the 109.5 of a perfect tetrahedron (Hasted, 1972). Sharing the electron between H and O is unequal because the oxygen nucleus attracts electrons more strongly than does the hydrogen nucleus and becomes more electronegative. This unequal sharing causes two electric dipoles in the water molecule; the oxygen atom bears a partial negative charge (2δ–) and each hydrogen a partial positive charge (δ+) (Martin and Zipse, 2005). As a result, there is an electrostatic attraction between the oxygen atom of one water molecule and the hydrogen of another, called a hydrogen bond.
The nearly tetrahedral arrangement of the orbitals about the oxygen atom allows each water molecule to form hydrogen bonds with as many as four neighboring water molecules. How-ever, water molecules are disorganized and in continuous mo-tion, so that each water molecule forms hydrogen bonds with an average of only 3.4 other water molecules (Fennema, 1996). The clustering ability of water molecules is apparently quite temper-ature sensitive (Starzak and Mathlouthi, 2003), with tetramers and pentamers suggested to dominate at room temperature, and monomers and dimers increasing as temperature increased.
Hydrogen bonds are stronger than van der Waals interac-tions, although they are weaker than covalent bonds. The hy-drogen bonds in liquid water have a bond dissociation energy (the energy required to break a bond) of about 5 kcal/mole, compared with 0.3 kcal/mole for van der Waals interactions and 100 kcal/mole for the covalent C–C bond (Stillinger, 1980). However, in addition to water’s large dipole moment, its ability to engage in multiple hydrogen bondings on a three-dimensional basis can explain its large intermolecular attractive forces (Nelson and Cox, 2000).
Understanding Water in Confections and Foods
Water is one of the most important components of confec-tions, and of most foods. The nature of water bonding with food components and its interaction with the surrounding atmosphere affects the physical or textural characteristics of the food prod-uct as well as the food’s shelf stability. Our understanding of the behavior of water in confections (and all foods) has grown over the years, progressing from the use of water content to water activity and more recently, to the principles of water mobility (and glass transitions).
In sugar-based confections, the water content is generally governed by the boiling point relationship of the sugars present
in the formulation. The final water content has a significant impact on texture and shelf life, with lower moisture content leading to harder confections that typically have longer shelf life. However, water content by itself is not sufficient to com-pletely characterize candy quality and shelf life. Water activity, or the relative vapor pressure, of the confection is an important parameter often used to describe microbial stability, texture, and water migration during storage.
The relative vapor pressure was first defined and used as an indicator of stability of foods by Grover (1947). Relative vapor pressure, h, was defined as the ratio of the vapor pressure of the material (P) to the vapor pressure of pure water (Pt).
h[%]= P Pt 100 (1)
Grover (1947) claimed that one can determine whether a food either gains or loses moisture based on this relative vapor pres-sure.
In the 1950s, Scott (1957) introduced the term “water ac-tivity” as a measure of water “availability.” He claimed that “water availability,” not moisture content alone, determines the stability of foods. Water activity,aw, which in foods is often given as the ratio of the vapor pressure of water above the food,
pw, to the vapor pressure of pure water at the same tempera-ture,po
w, indicates the degree to which water is associated with food components (not available to escape from the surface) and consequently, its availability to act as a solvent and contribute in physical, chemical, and microbiological processes. Several physical principles play a role in understanding the “states” of water in foods, including the colligative effect, capillary forces, and surface interactions (Lilley, 1994).
Water availability in foods depends on the type of solutes and their concentrations, and affects physical properties such as freezing point, boiling point, vapor pressure (water activity), and density (Kuprianoff, 1958; Gur Arieh et al., 1967). These prop-erties represent the colligative effect, where solute molecules reduce the chemical potential and escaping tendency (fugacity) of water molecules (Levine and Slade, 1988; Bell and Labuza 1984).
Furthermore, foods may contain pores or capillaries in which water can exist (Blustein and Labuza, 1972). The change in hy-drogen bonding between water molecules as a result of surface curvature affects the escaping tendency and chemical poten-tial of water (Bell and Labuza, 1984). The direct interaction
with other chemical groups on molecules through dipole-dipole forces, ionic bonds, dipolar-ionic interactions, van der Waals forces, and hydrogen bonding also reduce the escaping tendency and chemical potential of water (Bell and Labuza, 1984).
In the past, these properties led to characterizing water as either “free” or “bound” (Shanbhag et al., 1970). Kuprianoff (1958) suggested that measuring the amount of unfreezable wa-ter at sub-freezing temperature was the most accurate way of measuring “bound” water in foods, as did Meryman (1966) in a subsequent study. Sorption behavior (Labuza and Rutman, 1969; Berlin et al., 1968), drying rate studies, and NMR studies on the state of water (Shanbhag et al., 1970; Mousseri et al., 1974) correlated very well with the idea that water in foods was either free or bound (Leung and Steinberg, 1979), lending greater credence to this interpretation.
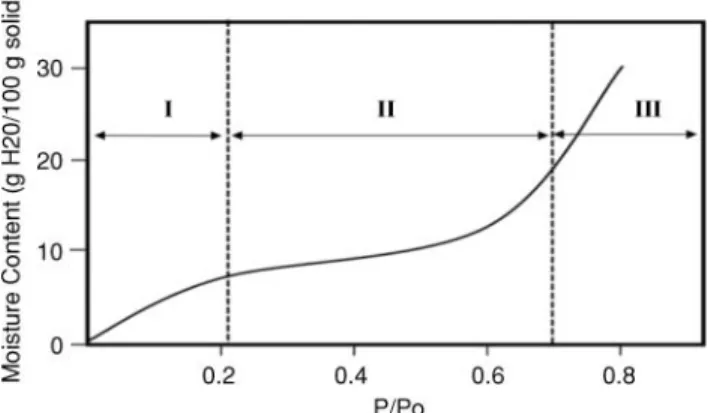
To obtain comprehensive data on the water relations of food, the water content equilibrated at a range of relative humidi-ties are determined and water sorption isotherms constructed (Duckworth, 1974). Figure 1 shows a generalized water sorp-tion isotherm, with distinct regions being noted. The behavior of these different regions suggests that they have different types of water (Troller and Christian, 1978; Fennema, 1996). Mono-layer water in region I is very stable, behaving in many ways as part of the food solid and is believed to be nonfreezable at any temperature (Duckworth, 1974). Thus, water in region I is often called “bound water.” On the other side, water in region III is called free water (Troller and Christian, 1978; Fennema, 1996) because the energy required for vaporization is similar to that of pure water.
More recently, the molecular mobility approach has been used to understand the role of water in foods (Fennema, 1996). In the 1960s, several researchers had begun investigating the amorphous/glassy state of sugars (White and Cakebread, 1966; Makower and Dye, 1956). However, it was not until the 1980s, that Levine and Slade (1988) popularized the polymer science approach to food science, documenting that the glass transition temperature (Tg) had significant ramifications on food stability. Solid confections can either be in the thermodynamically stable crystalline state or in an amorphous state. Regions in
Figure 1 Typical moisture sorption curve for foods showing the different regions of water (I, bound water; II, intermediate; III, free water). (adapted from Fennema, 1996).
the amorphous state can exist in a rubbery or glassy state. The temperature where the regions change from glassy state to rub-bery state (and vice versa) is called the glass temperature of the food (Slade and Levine, 1987, 1991). When foods go through the glass transition, their thermodynamic properties, molecular mobility, dielectric constants, and mechanical properties change (Sperling, 1986). Many foods exhibit a specific glass transition temperature, or more correctly, the transition occurs over a range of temperatures. Recent studies have applied these principles to confections.
In the following sections, the concepts discussed above are developed further with specific application to confectionery products.
WATER CONTENT
Water in confections is necessary for processing of the raw materials into finished products. It affects product texture and is one of the primary factors affecting shelf life.
One of the main functions of water in confectionery formulas is to dissolve the ingredients and help with mixing. In most candies, the water is used to dissolve and prepare the slurry of sugar and corn (glucose) syrup. Depending on the method of cooking, between 20 and 35% of water by weight of sugar solids is required to dissolve the slurry. However, less water can be used for quicker evaporation if the sugar can still be dissolved properly, for example, by use of pressure dissolvers to maintain liquid water at elevated temperatures. Sometimes no water is added, which is the case when liquid sugar and corn syrup is used for syrup preparation, since no extra water is needed for dissolution.
The properties of water used as a confectionery ingredient are also critical for the quality of the product. For example, the pH of water used in confections should be carefully controlled. Acidic water, with pH less than about 6, can lead to an increase in reducing sugars during cooking since inversion is promoted at high temperatures and low pH (Atkinson et al., 1952). Exces-sive inversion can cause discoloration of the cooked syrup and stickiness of the final product.
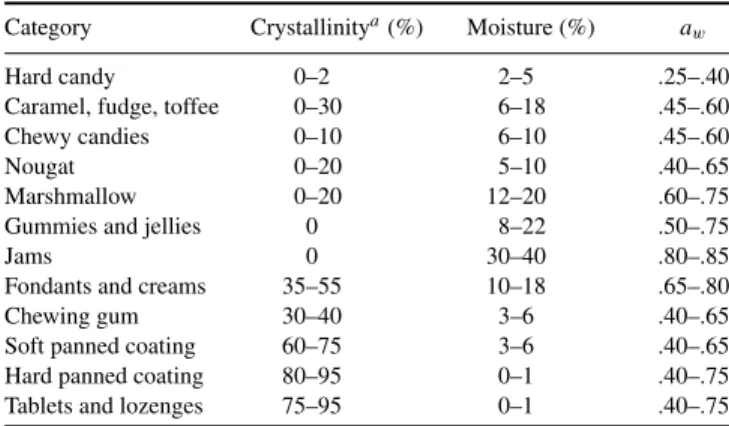
Water is also important in determining texture, whether of a hard or soft candy (Jackson, 1995). Confections typically have relatively low water contents, at least compared to many other food categories. Water content may vary from as high as about 30% in sugar syrup confections to as low as 1–2% in hard candies. Table 2 provides an approximate range of moisture content for a wide variety of confections. As can be seen, some candy categories span quite a wide range of water contents. Caramel, for example, can have water content as low as 4–5% in a caramel-type hard candy or as high as about 18% in very soft, fluid caramels. In this case, water content has a distinct impact on the texture of the caramel. In hard candies, high water content can potentially lead to graining or stickiness, softer texture, and faster flavor loss, whereas very low water content may give a hard and brittle texture. In fondants, a change in moisture content affects the amount of soluble sugars and thus, the proportions
Table 2 Range of water content and water activity (aw) in confections (adapted from Bussiere and Serpelloni, 1985)
Category Crystallinitya(%) Moisture (%) aw
Hard candy 0–2 2–5 .25–.40 Caramel, fudge, toffee 0–30 6–18 .45–.60 Chewy candies 0–10 6–10 .45–.60 Nougat 0–20 5–10 .40–.65 Marshmallow 0–20 12–20 .60–.75 Gummies and jellies 0 8–22 .50–.75
Jams 0 30–40 .80–.85
Fondants and creams 35–55 10–18 .65–.80 Chewing gum 30–40 3–6 .40–.65 Soft panned coating 60–75 3–6 .40–.65 Hard panned coating 80–95 0–1 .40–.75 Tablets and lozenges 75–95 0–1 .40–.75
aEstimated.
of crystalline sugar versus sugar dissolved in solution (Hartel, 2001).
Water Content Determination Methods
Numerous methods have been used to quantify the amount of water in a food, from simple drying methods to more so-phisticated spectroscopic analyses. However, three categories of methods, loss on drying, Karl Fischer titration, distillation and refractometry, are mainly used in the confectionery indus-try (Beard, 2001). A brief description of these methods, and their variants, for measuring water in confections is provided here.
Loss on Drying
Despite its downfalls, oven drying is one of the most common methods used to measure water content in foods and especially confections. A weighed food sample is placed in an oven at elevated temperature, from 100 to 135◦C (Beard, 2001). The temperature should be high enough to promote drying as quickly as possible without being too high that the water boils or the sample degrades in some other way. The sample stays in the oven until there is no change in weight between two subsequent readings. The weight difference through the heating time gives the water content of the sample.
The period of drying and heating temperature must be speci-fied for each type of product; for example, it takes 3 h at 105◦C for sugar (Mathlouthi, 2001). Choice of drying conditions (tem-perature, pressure) is critical since improper control of condi-tions can lead to variability in results (Isengard, 1995, 2001; Isengard et al., 2001). Incomplete removal of water and the loss of volatiles other than water may also lead to inaccurate results (Beard, 2001). Other sources of error include the formation of a crust at the surface of the product, which slows down the es-cape of water, and decomposition due to the Maillard reaction or caramelization of sugars, which produce water (Mathlouthi, 2001; Troller and Christian, 1978). Decomposition compounds
produced during the measurement may increase the weight loss during drying and make the measurement less accurate. Us-ing low temperature durUs-ing dryUs-ing to avoid decomposition is possible, but then the energy may be insufficient for water to be liberated from the sample. Oven drying remains an offi-cial method, mostly because it is simple and can be carried out in every analytical laboratory (Isengard, 2001; Isengard, 1995). Variations of the oven drying method have been de-veloped to obtain more accurate measurements and in shorter times.
Vacuum-oven drying is based on the weight loss during heat-ing under reduced pressure and at lower temperature (70◦C) for longer time (6 h) (Troller and Christian, 1978). The method is less destructive for heat sensitive products than atmospheric dry-ing (Mathlouthi, 2001). However, the duration of drydry-ing must be sufficiently long to allow the sample to come to steady state (Makower and Myers, 1943). In addition, particle size distribu-tion and air flow may affect reproducibility of results (Troller and Christian, 1978).
Other drying techniques have been used to enhance dry-ing and minimize negative changes. Majonnier-style drydry-ing in-volves adding a small amount of water to the sample to pre-vent hardening during drying at high temperatures. Caramel and sweetened condensed milk are examples of products that might harden at high temperature. Adding a small amount of wa-ter helps to prevent hardening and allows wawa-ter to more readily leave the sample (Beard, 2001). Two-stage drying is a method where two different temperatures are applied to the sample to prevent the formation of crust on the sample surface. Applica-tion of a lower temperature initially to remove surface moisture followed by a higher temperature to remove interior moisture is the basis of the method (Beard, 2001).
The use of more efficient heating sources can also enhance drying, although water left in the sample and volatile losses may again be reasons for inaccurate measurements (Isengard, 2001). Thermal radiation supplies efficient heating and there-fore, water is liberated more rapidly from the sample (Isengard and Prager, 2003). Infrared drying was compared with the Karl Fischer method (next section) and oven drying on products with high sugar content (Isengard and Prager, 2003). They found that infrared drying results were not as accurate as the results from the Karl Fischer method. Halogen drying is a relatively new version of infrared drying. It reduces drying time due to more efficient heating while it provides the high temperature necessary to liberate water from sugars—as polar substances they have strong interaction with water (Heinze and Isengard, 2001). However, formation of volatiles and crust on the sample surface still may cause error in readings (Heinze and Isengard, 2001). Microwave energy may also be used as a heating source to shorten drying time (Heinze and Isengard, 2001).
Karl Fischer Titration
The Karl Fischer method of water measurement is based on a two-step chemical reaction to identify water.
ROH+SO2+Z=⇒ZH++ROSO2 (2)
ZH++ROSO−2 +I2+H2O
+2Z=⇒3ZH++ROSO3+2I− (3)
In the first step (Eq. 2), sulfur dioxide is esterified with alco-hol reagent (methanol/formamide), and the ester is neutralized by base (Z) to yield alkyl sulphide. In the second step, iodine oxidizes alkyl sulphide in the presence of water.I2 is used as a titrating reagent for the determination of “end-point.” When all the water is consumed, iodine cannot react and is present in the solution with iodide. The existence of the redox couple io-dine/iodide corresponds to the redox reaction at the electrodes, which are submerged in the working medium and cause the voltage to drop sharply. The dramatic drop indicates “the end-point” (Mathlouthi, 2001; Isengard, 2001; Isengard and Heinze, 2003).
The Karl Fischer method is useful for the analyses of dried fruits and vegetables, candies, roasted coffee, and fats (Pomer-anz and Meloan, 1994). Although Karl Fischer titration is not as rapid as some other methods (e.g., NMR or NIR spectroscopy), it is still considered to be a fast method (20–25 minutes) and can be used in on-line processing (Isengard, 1995, 2001; Beard, 2001). The reagent reacts only with water, which eliminates the error coming from detection of the volatile constituents (Knetchel Laboratories, 1969; Beard, 2001). However, a shortcoming of the method is that results are affected by type of sample and particle size (Troller and Christian, 1978). Another problem can arise if water does not contact directly with the KF reagent, which can occur if the sample is insoluble. Instead of the total water content, only the surface water may be measured. The liberation of all water in the sample can be accomplished by addition of an appropriate solvent (i.e., methanol, formamide, etc.), reducing the particle size or elevating the temperature (Schoffski, 1998; Wunsch and Grunke, 1998).
Karl Fisher titration has been found to be reliable and suffi-ciently rapid (Supartona and Isengard, 1998). It is widely used for confectionery applications.
Refractometer
For fluid systems, like sugar syrups, measurement of the refractive index of the sample allows determination of water content (inverse of solids content). As light changes velocity (direction and speed) when it goes through any substance, re-fractive index, or the ratio of the velocity of light in a vacuum to its velocity in the sample (Pancoast and Junk, 1980), can be used to determine the percentage of dry substance and there-fore, the moisture content of the sample (Beard, 2001; Minifie, 1970). However, the calibration between the refractive index and the concentration of dry substances depends on the type of dissolved material (Pancoast and Junk, 1980). For pure sucrose solutions, the refractive index is directly correlated to concentra-tion so that the refractometer scale reading can be given directly
in concentration (weight percent). The refractive indices for a variety of confectionery sugars are compiled in Pancoast and Junk (1980).
However, most confectionery syrups of interest contain mix-tures of sucrose and other sweeteners (e.g., corn syrup, invert sugar, etc.). In this case, the refractive index of the solution depends on the relative ratios of the component ingredients. Pancoast and Junk (1980) have prepared tables in which the correlation between the refractive index of different products and the solid content is given.
Since most refractometers read in a scale of sucrose weight percent, the readings off a refractometer used for confectionery sugar mixtures give slightly erroneous results. When refrac-tometer readings are used directly for measuring concentration of confectionery mixtures, the scale reading is more correctly termed◦Brix to represent the equivalent sucrose concentration of a syrup with that refractive index.◦Brix values do not rep-resent the exact total solids (or water) content, with the errors increasing when less sucrose is present in the mixture. For many confectionery applications, no correction factors are used and
◦Brix is assumed to be sufficiently close to the true total solids
concentration (and water content by difference).
Although using a refractometer is a very rapid method (less than three minutes) (Beard, 2001), it requires samples to be homogenous and representative to give accurate results. The refractive index is also very sensitive to temperature (Beard, 2001), so to be most accurate, the refractometer should always be used at a consistent temperature.
Spectroscopy
Spectroscopic methods for measurement of water are based on food properties when the sample is exposed to electromag-netic radiation. The common spectroscopic methods, Nuclear Magnetic Resonance (NMR), Near Infrared (NIR), and Mi-crowave (MW), are explained briefly in the following sections.
Nuclear Magnetic Resonance (NMR) Spectroscopy. The
NMR spectroscopy was first used for water determination in foods by Bloch et al. (1946) and Purcell et al. (1946). With the appearance of commercial instruments, the use of NMR in the determination of water content in foods rapidly increased (Shaw et al., 1953; Shaw and Elsken, 1953, 1956).
NMR spectroscopic measurement of water content is based on the measurement of magnetic properties of hydrogen atoms in water. In an external magnetic field, the spin axes of these hydrogen nuclei are oriented in a specific direction by the applied field. When exposed to superimposed radio-frequency pulses of a specific frequency, the protons absorb energy and spin slightly off-axis. Between pulses, the protons release this absorbed energy, and the cycle of energy absorption and emission, known as resonance, characterizes the protons of the molecular species. The NMR resonance spectrum of a hydrogen atom in a water molecule is different from that in a carbohydrate or protein molecule. Characterization of the proton spectrum for water in a food leads to quantification of the water content of
the sample (Troller and Christian, 1978; Ruan and Chen, 1998). Since “bound” water exhibits a broader signal than free water, this technique is more adapted to distinguish between free water and bound water than for the accurate determination of water content (Troller and Christian, 1978; Mathlouthi, 2001). Precise calibration of the water content of the analyzed product based on a good reference method is needed (Mathlouthi, 2001).
Advantages of NMR techniques for measurement of wa-ter content include (Ruan and Chen, 1998) that it is a rapid, nondestructive, and noninvasive method, it requires less sam-ple preparation than other methods, it offers the possibility of automation because data acquisition can be real-time and data are electronic signals, and provides simultaneous determination of moisture and fat content. However, NMR is rarely used for water determination due to its high price (Isengard, 1995).
Near Infrared (NIR) Spectroscopy. The NIR measurement
of water content is based on the absorption of electromagnetic energy by water molecules at different wavelengths (1950 and 1450 nm) (Vornhof and Thomas, 1970; Mathlouthi, 2001). Wa-ter gives signals at 1450 and 1940 nm, based on different vi-brational modes, which are used to quantify the water content (Isengard, 2001). However, a product-specific calibration is the key to accurate moisture measurement (Isengard, 2001). Color, particle size, thickness, and texture of the product can influence the results (Mathlouthi, 2001), so great care is needed in sam-ple preparation. One potential disadvantage is that only surface water may be measured, giving inaccurate results for the water content of the whole product (Mathlouthi, 2001).
Microwave Spectroscopy. The use of microwave
spec-troscopy for measurement of water is based on the dipolar char-acter of the water molecule. The sample is placed between the receiver and emitter parts of the microwave and the water con-tent of the sample can be correlated to the shift in wavelength and decrease in intensity (Isengard, 1995).
Parameters that affect measurement of water content by mi-crowave spectroscopy include thickness and density of the sam-ple. Thus, the method is more suitable for measuring mobile water then crystallization water or bound water (Mathlouthi, 2001). The application of microwave spectroscopy for measur-ing water content in confections is not widespread.
Dielectric Techniques
Different foods have molecules with different polarities, which can be oriented by means of an external field. The di-electric constant of water (80) is quite different from most food
components (protein: 4–6; fats: 2–5) (Breen and Monaghan, 1975) so that an empirical calibration for dielectric constant, based on a primary measurement method, can be used to mea-sure water content of a food.
Breen and Monaghan (1975) measured the water content of licorice candy by using a dielectric technique calibrated by oven drying. The accuracy of the technique was verified by a good correlation between the two methods.
The advantage of dielectric measurement of water content is that, after calibration, it is a very rapid method (Beard, 2001). However, there are several factors that potentially limit its usage. For example, the moisture range of the sample must be between 0 and 50%, and the sample should not have any components with high dielectric constant (Breen and Monaghan, 1975).
COLLIGATIVE EFFECTS
The presence of a solute in a solvent can lead to changes in physical properties of that solution. These physical properties, vapor pressure, boiling point, osmotic pressure, and freezing point, are known as the colligative properties. The word col-ligative, which comes from the Latin word colligatus meaning “bound together,” is used to show that these properties are all interrelated. In ideal solutions, the degree of change in colliga-tive properties is only proportional to the mole fraction of the solute (Walstra, 2003).
The two colligative properties of particular importance to the confectioner are water activity, or relative vapor pressure, and boiling point elevation.
Water Activity
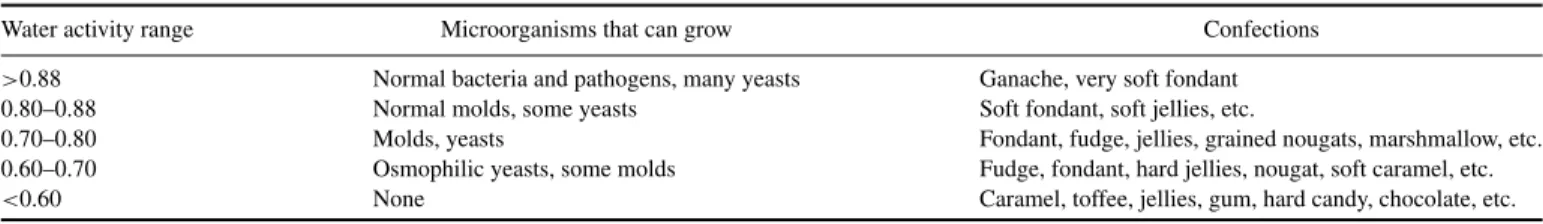
Water activity, a colligative property based on the number and size of molecules dissolved in water, is primarily influ-enced by the presence of dissolved sugars, other sweeteners (e.g., polyols), salts (e.g., caramel), and humectants in confec-tions. It has been used for many years to characterize physico-chemical properties and microbial stability of foods. It is widely accepted that microbial growth is directly related to water ac-tivity (Table 3), with certain types of microbes unable to grow when water activity is below some critical value. Fortunately, water activity in confections (Table 2) generally falls below the critical values for microbial growth, with few exceptions. There-fore, the end of shelf life due to microbial growth in confections Table 3 Growth of microorganisms dependent on water activity (aw)
Water activity range Microorganisms that can grow Confections
>0.88 Normal bacteria and pathogens, many yeasts Ganache, very soft fondant 0.80–0.88 Normal molds, some yeasts Soft fondant, soft jellies, etc.
0.70–0.80 Molds, yeasts Fondant, fudge, jellies, grained nougats, marshmallow, etc. 0.60–0.70 Osmophilic yeasts, some molds Fudge, fondant, hard jellies, nougat, soft caramel, etc.
<0.60 None Caramel, toffee, jellies, gum, hard candy, chocolate, etc.
Sources: Beuchat (1981), Fontana (2006), Minifie (1999).
is generally not an issue. However, the end of shelf life due to moisture loss or gain, with subsequent changes in textural and other properties, is often the main problem in confections. Thus, an understanding of water activity is important for control of shelf life and stability.
Thermodynamic Definition of Water Activity
In the food industry, water activity is generally defined as the ratio of the vapor pressures of the food to that of pure water (Nielsen, 1998; de Man, 1999). However, thermodynamically, the ratio of vapor pressures is not the true thermodynamic wa-ter activity under all conditions and is often incorrect in many conditions of importance to shelf life of foods and confections. Thermodynamically, water activity, aw, is the ratio of chem-ical potentials, often simplified to the ratio of fugacities (Reid et al., 1987; Sereno et al., 2001):
aw(T , P , x)=fw(T , P , x)
fo
w(T , Po) (4)
where, fw is the fugacity of the water in the food with mole fraction of water,x, andfwo is the fugacity of pure water at the same temperature,T, and pressure,P. Fugacity is sometimes called the “escaping tendency,” indicative of the ability of the molecule to escape from the food surface.
Under conditions where there is equilibrium between water in the food and the air, and assuming ideal solutions, the fugacity ratio can be expressed as a ratio of vapor pressures to give the commonly accepted form for water activity,aw (Sereno et al., 2001; Nielsen, 1998; deMan, 1999):
aw=pw(T , P , x)
pwo(T , P) (5)
where, pw is the vapor pressure measured in the air above a food and po
w is the vapor pressure of pure water at the same temperature and pressure.
Again, Equation (5) is not true under all conditions since it assumes ideal solutions and complete equilibration between water in the food and water in the air. At the high sugar con-tents found in confections, neither assumption may be true. The ability for the water in the confection to truly equilibrate with the air surrounding it depends on the ability of the wa-ter molecule to migrate/diffuse within the confection. In hard candy, for example, it is doubtful that sufficient time can ever be allowed for the water to completely equilibrate between candy and air. The same is probably true, although to a lesser extent, for hard, amorphous candies like caramel and toffee. Grinding these candies into a fine powder provides the best opportunity to expose the maximum surface area to the air and allow near equilibration.
Despite limitations to the water activity approach at low water content, it is widely used in the food industry, and as long as the limitations are recognized, water activity can still provide
useful information. For example, a difference in water activity between two components of a confection will lead to moisture migration until the two components have attained approximately the same water activity. Moisture migration occurs to alleviate the thermodynamic difference until equilibrium (equal chemical potentials) is reached.
Equilibration in moisture between the confection and the surrounding air space (both within a package and external to the package) also occurs. Since water activity is the ratio of vapor pressures, it is in the same general form as relative humidity (RH) of the air. Typically, water activity is used to predict an Equilibrium Relative Humidity (ERH), or the RH at which the candy neither gains nor loses water from the air. ERH is then given as (Nielsen, 1998):
ERH(%)=aw(100) (6) Again, ERH is the relative humidity at which the product does not gain or loose moisture to the air surrounding the con-fection (Jackson, 1995). If the surrounding atmosphere has a different RH from this value, the confection will either gain or lose moisture as it strives to equilibrate with the air.
Packaging is, in part, designed to protect the confection from moisture gain or loss to the surrounding environment. Many con-fections, such as hard candies, gum, and caramels, are wrapped individually and then bagged in an overwrap package. This pro-vides two layers of protection against moisture migration, at least until the package is opened. Other confections, such as candy bars, however, have only a single package layer protect-ing it from the environment. Equilibration between moisture in the candy and the air within the package occurs rapidly with slower equilibration of moisture between the internal air space and the outside, ambient air depending on the barrier properties of the package layer.
Prediction of Water Activity
Over the years, numerous methods have been developed to calculate or predict water activity of confections. Many of these methods have been reviewed by Teng and Seow (1981), Vega-Mercado et al. (1994), and more recently by Sereno et al. (2001). Methods to calculate water activity include
(1) completely empirical approaches,
(2) semi-empirical approaches based on thermodynamic prin-ciples, and
(3) the local composition models where solution properties are calculated from group contribution methods (Sereno et al., 2001).
Recent developments in predictive methods for water activity have been primarily in the area of solutions used for osmotic dehydration (Sereno et al., 2001), which generally contain
mixtures of sugars and salts. This discussion will focus on those predictive methods most relevant to confectionery systems.
Empirical methods. One of the first methods (if not the first)
of predicting water activity in confectionery products was devel-oped by Grover (1947). In this empirical approach, the relative vapor pressure (or equilibrium relative humidity) was calculated by first summing the contributions of each of the ingredients in the confection to give an equivalent sucrose concentration, Es, according to an equation of the form:
Es =
cf (7)
where, c is the concentration of each ingredient and f is an empirical conversion factor appropriate for each ingredient. The relative vapor pressure was then determined from a table that contained sucrose concentration effects on relative vapor pressure.
Another well-known empirical equation for predicting water activity of sugar syrups is that developed by Money and Born (1951). In a similar manner as Grover (1947), different sugars were assigned empirical parameters that were used to calculate equilibrium relative humidity of various sugar mixtures. The equation gave a reasonable fit to experimental values of relative vapor pressure over a narrow range of sugar concentrations, but for some reason predicted 104% RH for 100% water and went to infinity at 0% water.
Over the years, these empirical methods did not gain much favor in predicting water activity in confections, in part, because more accurate methods have been developed since then.
Semi-Empirical Models. One of the most common, and most
successful, methods for predicting water activity in confections is the method originally developed by Norrish (1964, 1966). This model is based on the thermodynamic definition of water activity as related to molar concentrations of confectionery syrups, but uses an empirical fitting of interaction parameters based on experimental data. In this sense, the method of Norrish is often called a semi-empirical model for predicting water activity. The Norrish equation for prediction of ERH is (Norrish, 1964):
log(ERH)=log(xw)−
[(−Ki)0.5xi]2 (8)
Here,xw is mole fraction of water in the solution, the xi are mole fractions of each contributing ingredient in the mixture and (−Ki) are the empirical constants determined by Norrish (1966). To use the Norrish equation,Kvalues for confectionery ingredients must be known along with molecular weight of each component (to determine mole fractions). Since glucose syrup is a complex mixture of saccharides without a unique molecular weight, Norrish (1964) providedKvalues and average molec-ular weights for a range of glucose syrups (Table 4).
TheKvalues as given by Norrish (1964) show some inter-esting correlations between the behavior of the ingredient with
Table 4 Empirical parameters (K) and molecular weight (MW) of confectionery ingredients for use in the Norrish equation (Norrish, 1964)
Ingredient −K MW
Sucrose 2.60 342
Glucose syrup (42 DE) 2.31 460 Glucose syrup (64 DE) 1.96 353 Invert sugar, glucose, fructose 0.70 180
Sorbitol 0.85 182
Glycerol 0.38 92
Propylene glycol 0.21 76 1Value from Bussiere and Serpelloni (1985).
respect to lowering water activity. As predicted thermodynam-ically, ingredients with lower molecular weight have lowerK
values, indicative of their greater effect in lowering water ac-tivity. It is clear from theKvalues in Table 4 why sorbitol and especially glycerol are such effective humectants in that they lower water activity significantly even at relatively low usage levels in a confection.
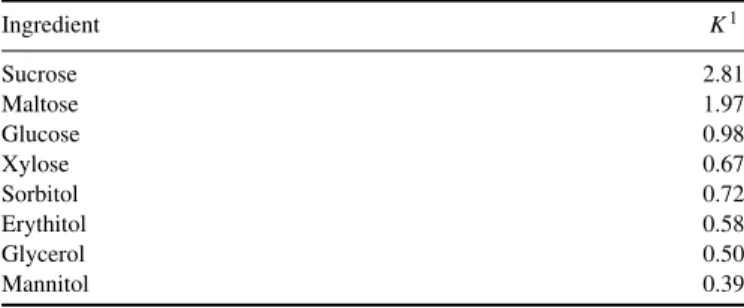
Chirife et al. (1980), studying sugar and polyol solutions, refined the method of Norrish (1966) and published a slightly revised set of K values for the Norrish equation, as shown in Table 5.
Comparing the K values for sucrose, glucose, and glycerol between the two studies, Chirife et al. (1980) found slightly higher values than Norrish (1966). The Chirife et al. (1980) values have generally been considered as more accurate.
One issue with the use of the Norrish equation is how to handle corn (glucose) syrups. Rather than add the contributions of each class of saccharide contained in these common sweet-eners (glucose, maltose, maltotriose, higher saccharides, etc.), corn syrups have traditionally been taken as a single ingredient and assigned some average characteristic effect. Norrish (1966) assigned differentK values to each corn syrup, dependent on the extent of hydrolysis of the starch (DE, or dextrose equiva-lent). The average molecular weight was given by the following equation:
MW=660−4.8(DE) (9)
Table 5 Values of Norrish constant,K, as given by Chirife et al. (1980)
Ingredient K1 Sucrose 2.81 Maltose 1.97 Glucose 0.98 Xylose 0.67 Sorbitol 0.72 Erythitol 0.58 Glycerol 0.50 Mannitol 0.39
1Note that Chirife et al. (1980) provideK values in terms of a natural log
expression, rather than the log10expression of Norrish (1966).Kvalues here
are converted to the Norrish form.
The dependence of theKvalues provided by Norrish (1966) on DE was given as (Bussiere and Serpollini, 1985):
K=0.019(DE)−3.173 (10) Bussiere and Serpollini (1985) also developed their own expres-sion forK values and average MW of corn syrups, and found slightly different results from Norrish (1966). Their expressions were given as:
MW=552−3.64(DE) (11)
K=0.02(DE)−3.28 (12)
Differences between the studies may arise from
(1) more sophisticated methods ofawmeasurement by Bussiere and Serpollini (1985) or
(2) use of slightly different glucose syrups.
It is well known that manufacturing methods for glucose syrups can differ and the starting starch material can be different, both of which may result in different saccharide profiles for the same DE. Perhaps a future goal might be to better character-ize the effects of saccharide profile in corn syrups on water activity. Until then, prediction of water activity of confections with substantial quantities of glucose syrups based on the Nor-rish equation is likely to be relatively inaccurate and therefore, calculated values must be taken only as estimates of the true values.
Confectionery products often contain more than just sweet-eners, with ingredients such as stabilizers (proteins, gelatin, starch, pectin, etc.), dairy ingredients (sweetened condensed milk, evaporated milk, etc.), and lipids (butter, vegetable fats, etc.). The influence of these ingredients on water activity of complex confections has not been studied in any detail, yet has substantial commercial importance. Ross (1975) considered the effects of various “nonsolute” ingredients on water activity of intermediate moisture foods, but did not discuss confections in particular. This is another area of interest where additional work is needed to develop accurate predictive models.
Local Composition Contribution Methods. Water activity, as
well as other thermodynamic properties, can be predicted given sufficient understanding of the molecular interactions occurring in solution. Such approaches to prediction of solution equilibria are often called group contribution methods because they use characteristic interaction parameters of the chemical groups on the different molecules (LeMaguer, 1992; Sereno et al., 2001). For example, Leschke (1987) used a thermodynamic interaction parameter approach to predict boiling point elevations of sugar solutions.
The method most often used to predict thermodynamic prop-erties of sugar solutions is the UNIFAC (UNIQUAC func-tional group activity coefficients) method. This method accounts
for molecular size, shape, and energies of interaction between molecules in proximity in the solution (Le Maguer, 1992; Sereno et al., 2001). These interactions are what determine the thermo-dynamic properties like water activity, osmotic pressure, and boiling point temperature.
The UNIFAC model has been used to characterize thermo-dynamic properties of various sugar solutions, although none have been directly applied to confectionery systems. Catte et al. (1995) studied aqueous solutions of glucose, mannose, galac-tose, frucgalac-tose, sucrose, lacgalac-tose, and maltose. However, no mix-tures were studied, just pure aqueous solutions of these sugars. Peres and Macedo (1997) used the UNIFAC model to calcu-late water activity of glucose, fructose, and sucrose and found good agreement with experimental data, although values for the sucrose-water system had relative deviations of 9%. They were also able to successfully predict water activity values for ternary and quaternary mixtures of these sugars, extending this approach to more commercially relevant confectionery syrups. Ninni et al. (2000) extended the UNIFAC model to calculate water activity in polyol solutions.
Future improvement in group contribution methods may eventually lead to their use for accurately prediction of water activity (and boiling point elevation) for complex confectionery mixtures.
Measurement of Water Activity
A variety of methods have been developed to measure water activity of foods and confections (Troller and Christian, 1978; von Elbe, 1986). Kilara (1981) states that “the desirable” wa-ter activity method would be accurate, reproducible, sensitive, rapid, durable, portable, usable, and low-priced.
Proper sample preparation is a critical concern for accurate water activity measurement in many confections, particularly those that rapidly gain or lose moisture to the environment. Typically, the sample to be measured must be ground to expose interior surfaces and allow more rapid equilibration. However, sample preparation of certain types of confections (e.g., hard candy) under humid conditions can lead to inaccurate measure-ments. Careful control of humidity to avoid moisture gain or loss between sample preparation and measurement is required.
Hygrometry. Hygrometry is a method used for calculating
water activity by measuring humidity of the air directly in con-tact with the sample. Different hygrometers are based on the responses of certain materials to moisture.
Hair hygrometer. The hair hygrometer method is based on
the principle that the length of a hair changes as the keratina-ceous protein of the hair absorbs moisture from the air. Three or more strands of hair (horse, human, etc.) are fixed at one end of the unit and the other end is connected to a sensitive arm attached to a recorder pen or a dial (Troller and Christian, 1978). The food is placed in the chamber with the hair, and the reading gives equilibrium relative humidity (or water activity times 100) by the correlation of the change in the length of hair (Troller and Christian, 1978).
Equilibrium conditions require sufficient time; however, this time can be shortened by circulating air through the system. Although, hair hygrometers lack sensitivity (only good to 0.03
aw) they are useful for range-finding and for a rough estimation of water activity (Troller and Christian, 1978). Low cost is an advantage of using the method.
Electronic hygrometer. Electronic hygrometry is based on
the measurement of conductivity or resistance of a hygroscopic salt in equilibrium with the surrounding atmosphere. The salt’s ability to conduct electricity is measurably changed as mois-ture is absorbed or desorbed by the salt (Troller and Christian, 1978). The instrument has a sensor, a sample chamber, and a potentiometer. According to the water activity of the sample in the chamber, a hygroscopic material, usually LiC1 or sulfonated polystyrene, in the sensor gives different conductivity or resis-tance. The sensor works as an electric transducer and changes in capacitance are read in response to changes in relative hu-midity (Mathlouthi, 2001). The instrument must be calibrated with solutions of knownaw.
Electric hygrometry is considered precise, quick, and conve-nient. However, the units are relatively expensive and are subject to contamination from glycols, ammonia, acetate ions, and other organic volatiles (Kilara, 1981).
Dew Point. Dew point measurement ofawof confections is
a commonly used technique due to the convenience and short measurement times. The dew point is the temperature at which condensation of water vapor occurs (saturation is reached) as air is cooled (no change in water content). To measureaw, an air stream in equilibrium with the food sample is directed at a cooled mirror or sight glass. A beam of light from a neon lamp is directed onto the mirror and reflected into a photodetector cell. When condensation occurs on the mirror (meaning the dew point is reached), a change in reflectance is sensed by a photodetector. The equilibrium (dew point) temperature is related to ERH through a standard relation between relative humidity and dew point temperature.
Dew point measurement gives accurate results over the entire range ofaw(von Elbe, 1986) and in a relatively short time (1– 2 h). The main limitation of the dew point method is that it can be affected by certain volatiles, such as ethanol and propylene, which can co-condense on the mirror.
The accuracy and time required to reach equilibrium can be reduced by crushing, slicing, or grinding the samples, thereby exposing a greater surface area to the air. This also allows ho-mogenization of the sample. For multi-domain foods with a cen-ter and oucen-ter coating that have differentaw, like hard candy with a chewy or gum center, the two domains must be separated prior to measurement. Also, careful control of the humidity during sample preparation is needed to ensure accurate measurements since grinding of a candy in conditions of high humidity can cause sufficient moisture sorption to give erroneous readings.
Sorption Isotherms. The sorption isotherm method is based
on the determination of equilibrium relative humidity, or the point at which the sample neither gains nor loses moisture. Af-ter measuring the amount of waAf-ter gained or lost by the sample
in a determined time (often only 1 to 2 hours), moisture contents are plotted againstaw. This plot intersects with the line present-ing zero moisture change at theawvalue of the sample (Labuza et al., 1976; Troller and Christian, 1978). This method has pro-vided good results for confectionery products (Smith, 1965; d’Alton, 1969), with accuracy within+0.02 (Sloan and Labuza, 1975, 1976). However, despite a reduction in measurement time through automation of this method, sorption isotherms are gen-erally no longer used for measurement ofaw.
Boiling Point Elevation
The boiling point of a solution is the temperature where the total vapor pressure above the solution reaches ambient pres-sure. With solute addition, vapor pressure of the solution de-creases and as a result, higher temperature is necessary to reach the point where total vapor pressure equals ambient pressure (Walstra, 2003). The change in boiling point,Tb, or boiling point elevation, is given by (Walstra, 2003)
Tb= −
T2
b,1 Hv,1
Rln (x1)≈ −28 ln (x1)≈0.51m2 (13)
whereTb,1is the boiling temperature of the pure solvent,Hvis the enthalpy of vaporization (40.6 kJ/mol for water at 100oC and
atmospheric pressure),x1 is the solvent (water) mole fraction,
andm2is the solute concentration (moles/L).
Literature data for boiling point temperature of sugar solu-tions, particularly at higher concentration, is highly inconsistent (Norrish, 1967; Jackson, 1995). This can mostly be attributed to the difficulty in measuring the exact water content at a specific boiling temperature since evaporation continues during cooling (Batterham and Norgate, 1975). Rapid cooling is essential to obtain the most accurate results. Tables of boiling point eleva-tion for various sugar solueleva-tions of importance to confeceleva-tions can be found in Norrish (1967) and Pancoast and Junk (1980); however, the values at high dissolved solids contents should be used with caution for the reasons noted above.
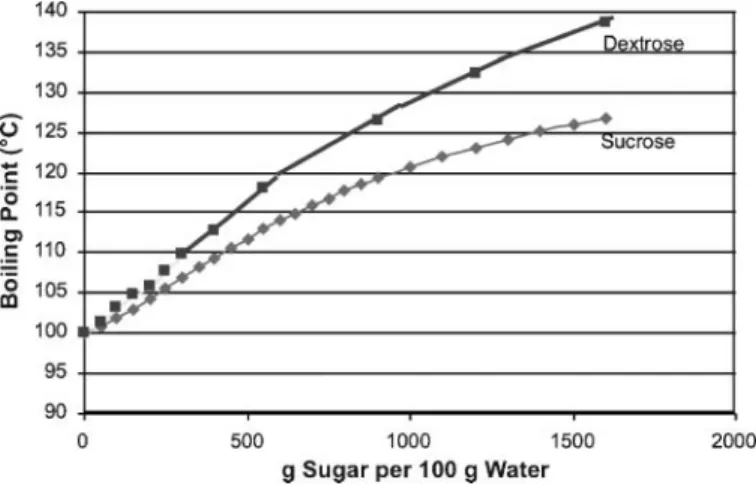
Solute concentration and molecular weight determine the degree of boiling point elevation. Based on its lower molecular weight, glucose (dextrose) solutions boil at higher temperature than sucrose solutions of equivalent weight percentage (Jackson, 1995). For example, Fig. 2 compares the boiling point elevation of sucrose and dextrose solutions.
The effects of glucose syrup on boiling point elevation de-pend on the specific saccharide composition (Norrish, 1967; Pancoast and Junk, 1980). Higher DE corn syrups give higher boiling point elevation than lower DE corn syrups, but corn syrups of the same DE from different manufacturers might have slightly different boiling point elevation.
Another factor that affects boiling temperature is the pres-sure (Jackson, 1995). The boiling point is defined as when va-por pressure reaches ambient pressure, so changing ambient pressure affects boiling temperature, with a decrease in boiling
Figure 2 Boiling point elevation curves for different sucrose and dextrose concentration (plotted from data provided by Pancoast and Junk, 1980).
temperature with a decrease in vapor pressure (Fig. 3). As well understood by confectioners, boiling temperatures are reduced when cooking takes place under vacuum. However, even re-duced atmospheric pressure, whether caused by a low pressure weather system or from a manufacturing facility at high eleva-tions, can cause a significant reduction in boiling temperature. A confectioner who cooks to a specific temperature every day may wind up with small variations in water content (up to 0.5%) due to normal variations in atmospheric pressure.
Colligative Effects of Confectionery Ingredients
Each of the ingredients used in confectionery formulations has its own effect on water, dependent on the nature of the ingredient and its concentration in the final product (Cakebread, 1969). Typically, ingredients with lower molecular weight have the most effect on reducingaw, through the colligative effect in solution, although other factors may moderate this effect.
For example, the solubility of an ingredient in water also impacts its effectiveness at reducingaw. Components that are not soluble or that do not mix with water, do not directly affect
aw. Thus, emulsified fats, dispersed crystals, and many solid
Figure 3 Boiling point elevation under different pressure (drawn from data provided by Pancoast and Junk, 1980).
Table 6 Water activity (aw) of saturated solutions of confectionery ingredients at 25◦C (from Bussiere and Serpelloni, 1985)
Ingredient Solubility (%) aw Sucrose 67.4 0.844 Glucose 51.0 0.891 Fructose 80.0 0.634 Lactose 18.7 0.931 Sorbitol 73.0 0.725 Mannitol 18.0 0.977
particulates (e.g., starch granules) typically do not affectawin confections. In fondant, for example, it is the liquid phase that governs water activity. Thus, the water content of the liquid phase, the dissolved solids concentration, and the nature of the solutes (humectants, etc.) found in the liquid phase determine
awof fondant.
Ingredients with high solubility and low molecular weight have the greatest effect on reducing aw. Aw values of com-mon confectionery ingredients at their maximum solubility at room temperature are shown in Table 6. High molecular weight soluble ingredients used in confections, such as proteins, hydro-colloids, and gums, generally have little effect on reducingaw. A humectant is a substance that promotes retention of water and helps to keep a confection moist. A humectant is typically a molecule that contains hydroxyl groups with an affinity to form hydrogen bonds with molecules of water. Humectants also typically reduceawof a confection. Common humectants used in confections include corn syrups (especially high DE corn syrups and high fructose corn syrup), invert sugar, fructose, glu-cose, and polyols (propylene glycol, glycerol, sorbitol, isomalt, lactitol, mannitol, maltitol, and maltitol syrups).
WATER MOBILITY
Water activity is an equilibrium thermodynamic descriptor; however, foods are rarely if ever in an equilibrium state so that the measured properties of foods are time-dependent. This principle, in part, has led to the polymer science approach to food design, the characterization of water in terms of its mobility, and use of the glass transition to better understand performance, stability, and shelf life of many foods (Slade and Levine, 1987; 1991; Levine and Slade, 1988, 1992).
The definition of a glass was first proposed by Jones (1956) as any liquid or super-cooled liquid whose viscosity is higher than 1013 Poise (note that other sources say 1012Pa-s; Roos, 1995).
Glasses are described as regions of matter characterized by a limited order arrangement of molecules (random, with no long-scale ordering) in contrast with a crystal, which has extended regions of order (substantial long-range ordering), and a gas, which has no such regions. A glass transformation temperature,
Tg, was defined as the temperature where the transformation from liquid to glass or vice versa takes place (White and Cake-bread, 1966), although we now recognize that this transition usually takes place over a range of temperatures (Roos, 1995).
The importance of Tg to confections has been recognized for many years. For example, White and Cakebread (1966) dis-cussed the correlation between glass transition and the control of moisture in hard candy and other sugar-containing food products over half a century ago. Yet, the application ofTgto understand and control moisture in food systems came with the polymer science approach, as made popular in the mid-1980s by Slade and Levine (1987, 1991).
Many foods, particularly dried foods and confections with low water content, are in the amorphous metastable state, where the material lacks long-range molecular order. The amorphous phase can be divided into the glassy state and rubbery state. An amorphous glassy material has a high internal viscosity and low internal mobility (Roos, 1995), whereas the rubbery state has a viscous, more fluid-like state. The temperature (or range of temperatures) where the transition between glassy state and a more fluid-like rubbery state occurs is the glass transition temperature (Tg) (Kauzmann, 1948).
Tg has been proposed as a physicochemical parameter that is an indicator of food properties, stability, and safety (Levine and Slade, 1992). Keeping any product at a temperature be-lowTgseverely retards diffusion-based modes of deterioration. AboveTg, molecular mobility increases and viscosity decreases, which leads to time-dependent structural transformations such as stickiness and collapse during food processing and storage (Roos, 1995). From a kinetic perspective, reactant molecules must exhibit a minimum degree of mobility to collide with, ori-ent toward and react with one another (Sherwin et al., 2002; Sherwin and Labuza, 2006), which occur only at dramatically reduced rates when the product is held belowTg.
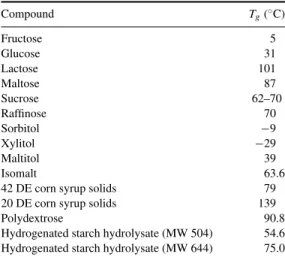
The glass transition temperature depends on molecular weight, degree of cross-linking of polymer, and plasticizer (e.g., water) concentration (Graaf et al., 1993). Carbohydrates with low molecular weight generally have lowerTg, whereas those with high molecular weight generally have higherTg(White and
Table 7 Glass transition temperature (Tg) of sweeteners (dry state) found in confectionery products
Compound Tg(◦C) Fructose 5 Glucose 31 Lactose 101 Maltose 87 Sucrose 62–70 Raffinose 70 Sorbitol −9 Xylitol −29 Maltitol 39 Isomalt 63.6
42 DE corn syrup solids 79 20 DE corn syrup solids 139 Polydextrose 90.8 Hydrogenated starch hydrolysate (MW 504) 54.6 Hydrogenated starch hydrolysate (MW 644) 75.0
Sources: Roos and Karel (1991), Noel et al. (1991), Roos (1995), Fennema (1996), Raudonus et al. (2000).
Table 8 Effect of water content on glass transition temperature (Tg) of sucrose Water content (%) Tg(◦C) 0 69 1 61 2 50 3 42 4 35 5 29 Source: Nowakowski, 2000
Cakebread, 1966; Slade and Levine, 1991; Roos, 1995). Table 7 showsTgvalues for a variety of compounds important for con-fectionery manufacture, whereas Table 8 shows the strong effect of water content in decreasingTgof sucrose. Only a few percent of water can cause a large decrease in theTg of a confection.
When different sugars are mixed, as in most confectionery formulations,Tg of the mixture depends on the relative ratios of the sugars added, theTg values of each sugar found in the mixture, and, of course, the water content. According to Table 7, theTgof 42 DE corn syrup solids is slightly higher than that of sucrose so mixtures of the two sugars should haveTgsomewhere between those values (Table 9) and thus, addition of 42 DE corn syrup causes the Tg of the mixture to increase slightly. Use of 20 DE corn syrup, however, generally causes a much more significant increase inTgof the mixture (Nowakowski, 2000).
During cooking of sugar syrups, inversion of sucrose into glucose and fructose often occurs. This mixture, according to Table 7 (which showsTg values for the two components) has a much lowerTg than sucrose, perhaps around 15◦C, which is a value often cited for honey solids (Bhandari and Hartel, 2005). Thus, inversion of a confectionery syrup during cooking leads to a decrease inTg and thus, to reduced stability of the sugar glass.
Although it is widely accepted that molecular mobility decreases dramatically when a confection is held below its
Tg, mobility does not decrease to zero, especially for smaller molecules like water (Fennema, 1996). In sugar glasses held below their Tg, water still has substantial mobility. Levine and Slade (2002) discussed molecular mobility in terms of the concept of average Tg for mixtures of components. The measuredTgof a mixture should be considered the point where a molecule with an average molecular weight of the system Table 9 Glass transition temperatures (onset of calorimeter scan) for dry (less than 1%) corn syrup–sucrose mixtures (Gabarra and Hartel, 1998) Addition Level (%)1 20 DE2 42 DE2 0 63.9±1.4 63.9±1.4 10 66.8±0.4 64.1±2.2 20 65.8±2.6 66.9±0.7 50 73.6±3.0 69.1±2.0 75 91.6±1.3 70.9±1.6 100 139.3±0.8 79.0±2.9
1Addition on a dry solids basis (g corn syrup solids/100 g total solids). 2DE-dextrose equivalent.
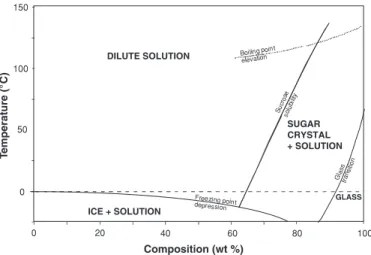
150 100 50 0 0 20 40 60 80 100 Boilingpoint elevation Su cro se sol ubi lity Gl a ss tra nsiti on Freezing point depression DILUTE SOLUTION SUGAR CRYSTAL + SOLUTION ICE + SOLUTION GLASS Composition (wt %) T e mperature (° C)
Figure 4 State diagram for pure sucrose-water binary system (from Hartel, 2001).
would be immobilized. In mixtures of sugars with water, the water molecule is significantly smaller than the sugars, so it will have considerable mobility even when the temperature is slightly belowTg. Thus, even when a hard candy is maintained at a temperature belowTg, penetration of water molecules into the matrix can occur, albeit at a slow rate dependent on the difference in storage temperature and Tg. Furthermore, flavor molecules in that same hard candy sugar glass also has some mobility even if the candy is held below the average Tg. The area of molecular mobility belowTghas a significant impact on the shelf life and stability of amorphous or glassy candies like hard candy and deserves future attention to seek ways to limit flavor loss and moisture uptake of these confections.
To document what state of matter might be expected at different temperatures and water contents, a state diagram is often used. The state diagram combines the phase boundary lines for solute (solubility curve) and solvent (freezing point curve) in a binary system, with the glass transition condition superimposed (Slade and Levine, 1991; Roos, 1995). A state diagram for sucrose-water is shown in Fig. 4 (Hartel, 2001). State diagrams determine the range of temperatures where a confection with known moisture content can be safely stored (Roos, 1995), but also can be used to document the path of processing steps on the state of a confectionery system (Hartel, 2001).
MOISTURE TRANSPORT
A freshly packaged confectionery product undergoes water migration as it seeks equilibrium among the various elements of the product (Cakebread, 1976). Figure 5 schematically shows the types of exchange that can take place in a complex product. If there are multiple regions within the product with different water activity, water will migrate between these regions until the
aw values of all regions/domains are the same (equilibration). There is also moisture exchange with the air in any headspace
Figure 5 Moisture migration pathways for chocolate-covered candy bar sys-tem.
within the package. If the package is a perfect moisture barrier, the headspace attains a RH in equilibrium with the water in the confection (ERH). However, moisture exchange through the package, between the headspace and outside air, also occurs, at a rate depending on the difference in RH between inside and out, and the barrier properties of the package material. Since ex-ternal storage conditions (temperature and RH) are continually changing, water migration out of (or in to) the product occurs continuously throughout its shelf life.
Compare a commercial packaged chocolate-covered candy bar made with caramel and a cookie over its shelf life (Table 10). Early in its shelf life (within one month of pro-duction), there was still a significant difference in water activity between the caramel and cookie. However, over time, the water activity values nearly equilibrated between caramel and cookie. Interestingly, under the conditions of storage in this experiment, the entire bar lost moisture through the package and the water activity of both components decreased significantly. Note that theawvalues of both caramel and cookie decreased despite be-ing surrounded by chocolate, a relatively good water barrier. Not surprisingly, the texture of this product changed dramatically, with the caramel getting hard and chewy (originally soft) and the cookie becoming stale due to moisture loss.
To help understand changes in moisture content in confec-tionery products with multiple elements, it is important to un-derstand the sorption and desorption behavior of each element. Furthermore, the rate of exchange of moisture is governed by the thermodynamic driving force and ability of water molecules to
Table 10 Change in water activity of commercial, packaged
chocolate-covered bar containing caramel and cookie (Hartel, unpublished results)
Water activity Early1 Aged2 Bar average 0.32 0.21
Caramel 0.31 0.22
Cookie 0.23 0.20
1Within one month of manufacture.
2Stored for one year at about 22◦C and 40–55% relative humidity.