Medical Journal of the Islamic Republic aCIran
A N EW CYTOCOLORIME TRIC ASSAY USING
PHOSPHATAS E ACTIVI T Y FOR MEASURING
CELLULAR FUNCTIONS
A.A.N.P.M. DAB ARE, B.Sc., A.M.E. NOURI, Ph.D., MRCPath.,
AND
R.T.D. OLIVER, M.D., FRCP.
From the Depar t ment of Medical Oncology, The Royal London Hospital, Whitechapel, London, EllBB, U.K.
ABSTRACT
In this study cellular phosphatase activity, referred to as enzyme developed
color (EDC) assay, was used for an
in vitro
assessment of cell proliferation and
cytotoxicity. Optimum conditions were established and found to be 10 x103 cells /
well at 37°C and 60 min incubation (for developing color). Under the same conditions
a direct correlation between optical density
(00)
and cell number was observed.
Thus, the ODs for a cell line, Ish at 100, 50, 25 and 10
X
103 cells/well were
1.0S ±0.05, 0.59 ±0.02, 0.33 ±0.02, and 0.17 ±O.O 1 respectively (r=0.995,p<0.OO 1).
When EDC was compared with another colorimetric assay, i.e.
MTT,
the results
showed a direct correlation with r=0.995, p<O.OOl .
Repeating the experiment with live and fixed tumor cells showed similar results.
Thus, for the Ish line, the ODs at 50 and 10
X
103 cells/well for fixed and live cells
were 0.66±0.01, O.lS±O.Ol and O.64±0.03 (p>0.05), 0.19±0.01 (p>O.05),
respectively. The assay was also shown to be suitable for the measurement of cell
cytotoxicity and compared well with the
MTT
assay.
These findings indicated that a simple, rapid and economical EDC assay could
be used to investigate various cellular functions. The main advantage of EDC is it's
suitability to use stored cells. This provides flexibility for testing samples stored over
a long period in order to limit inter-experimental variations.
MJIRI, Vol. 14, No.1, 53-59, 2000
Keywords: Alkaline phosphatases; testis tumor; cell proliferation.
Volume 14 Number 1 Spring 1379
May 2000
INTRO DUCTION
The use of in vitro tissue culture has proven invaluable
*Correspondence: AME Nouri, Department of Medical Oncology, The Royal London Hospital,Whitechapel, London, El IBB, UK. Phone 0171377 7000 ext. 3470, Fax 01712475016.
for investigation of various cellular functions. In many cases the initial screening of pharmacological agents in clinical use had been carried out in cell culture models. These in vitro techniques include simple cell counting, trypan blue dye exclusion technique,1 FACs analysis,2 incorporation of radioactive thymidine3 and the
New Assay
For
Cellular Functiol1sradioactive thymidine analogue bromodeoxyuridine.2,4 1.4
In our previous study,S we modified the colorimetric a
technique originally described by Mosmann 6 for estimating 1.2 tumor cell viability after their exposure to various chemicals.
In addition, the use of this technique was extendedS to 1.0 replace the conventional radioactive thymidine assay used
E
for cell proliferation and chromium release assay for c 0.8It')
cytotoxicity studies.7,8 � 0
Techniques based on phosphatase activity have long Cl 0.6
been used for measurement of serum placental alkaline
0
phosphatase
(PLAP)
in patients suspected of testicular 0.4 cancer.9 The alkaline phosphatases (ALP) are members of"'j
non-specific phosphomonoesterases capable of hydrolyzinga range of phosphate monoesterslO as well as hydrolysis of
{)rthophosphate esters, inorganic pyrophosphate and also 0.0 carry out transphosphorylation activity. 1 1 Though the precise
0 25 50 75 100
role of ALPs are to be elucidated, it is believed that they are
involved in the transport of specific substances from plasma 3.0
b
membranes, and participate in hydrolysis of intracellular
metabolites. The placental isoform has been reported to act 2.5 as the Fc receptor for IgG, hence facilitating the transport
of Ig into the fetus, from the maternal circulation. In
addition,
ALP
have also been reported to play an important � 2.0E
role in the process of wound healing. 11-13 cIt') The aim of this study was to investigate whether it was 0 1.5
� possible to use
ALP
activity for the measurement of cellularCl
functions.
0
1.00.5 MATERIALS AND METH O DS
Development of cell lines 0.0 0 25 50 75 100
Two of the lines used for this study were in house established tumor lines, i.e. Wil and Fen from transitional
bladder tumors. 14 They were established from fresh tumor 0.5
c biopsies by finely cutting the tissue. Mter passage through
a sieve with the aid of a sterile syringe plunger and washing,
cells were cultured overnight at 37°C in RPM!, containing 0.4
10% v/v fetal calf serum (pCS, Sigma). The non-adherent
cells and cell debris were removed and replaced by fresh 0.3
medium. Adherent cells were fed until confluence
(1-2x10⁶/25cm2 flask) and were expanded by trypsinization
E
and seeded at a lower cell number (O.5x106/25cm2 flask). It') c 0.2 0 Other cell lines and their sources have previously been � reported by Nouri et al.8For JEG3 see Rinke De Wit. IS Tera
Cl
0
II, Ep 2102, T47D and T24 lines were obtained from 0.1 ATCC.0.0
Enzyme developed color (EDC) technique 0 25 50 75 100
Tumor cells were trypsinized, counted and dispensed
Cell Number (x103)
onto flat-bottomed microtiter plates (100 J..LL/well) at varyin gcell numbers. They were incubated under various conditions --
4°C
- RT -37DC
and after the termination of incubation (see below) the
supernatants were removed by flicking the plate. The cells Fig. 1. Optimization of incubation conditions,
A.A.N.P.M. Dabare, et al.
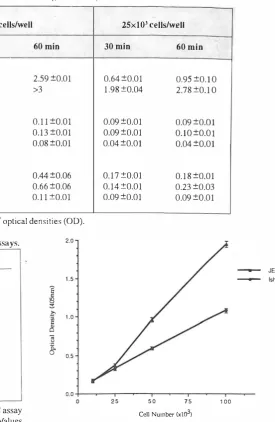
Table I. Optical densities or various cell lines using EOC assay.
25xl OJ cells/well 25xl 03 cells/well Cell line
30 min
'1 estis I
Tera II 1.72±0.0!
EP2102 >3
Bladder
Wi! 0.1O±0.0!
Fen 0.11 ±0.01
T24 0.10±0.01
Others
Ish 0.41 ±0.02
JEG3 0.29±0.02
T47D 0.10±0.01
60 min 2.59 ±0.01 >3 0.11 ±O.QJ 0.13±0.01 0.08±0.01 0.44±0.06 0.66±0.06 0.11 ±0.01 30 min 0.64±0.01 1.98±0.04 0.09±0.01 0.09±0.01 0.04±0.01 0.17±0.01 0.14±0.01 0.09±0.01 60 min 0.95±0.1O 2.78±0.1 O 0.09±0.Q1 O.lO±O.Ol O.04±O.Ol 0.18±0.01 0.23±0.O3 0.09±O.01
Results are presented as mean ±SD of optica
l
densities (00).Tahle II.
Qualitative
assessIllent of ADC and EDC assays.Lines ADC EDC
Testis
Tora J ++++
Tera II ++++
Ep2102 ++++
Bladder
Wil
±
T24 5037 Fen
Others
Ish (endometrium) +++±* ++±
JEG3 (choriocarcinoma) +++* +++
1,JlI.JII1.1IJ\C Ic,Ulh III I.:,DC (alter bU mm at 37°C) and ADC assay
are expressed as strong positive (++++) to negative (
-
). Valuesdenoted by * indicate cases where up to 30% of the cells showed
strong positivity.
were then washed with PBS + NaN3 (0.02% v/v) and following flicking, 100 J..lL o( phosphate substrate buffer (24.5 mg MgCI2, 48 mL of diethanolarnine adjusted to pH 9.8 in a total volume of 500 mL) containing 1 mg/mL of p nitrophenyl phosphate, disodium substrate tablet
(PI04-105, Sigma) was added to each well. The plates were incubated for varying l�ngths of time and under different temperatures. At the tennination of the experiment, the optical density (OD) was measured using an ELISA reader at 405 nm.M TTassay
MIT
assay was carried out as described by Hussain.5 Tumor cells were trypsinized, counted and dispynsed onto flat-bottomed microtiter plates (100 J..lL/well) at varying2.0
1.5
E
" :g ::0. .f'E
1.08
]
"5-0 0.525 50 75
Cen Number (xl03)
100
_ JEG3
- Ish
Fig. 2. CorrelatIOn betwet:!n cdl number and optical density in EDC assay. Results are plotted as 00 against cell number.
cell numbers. They were incubated under various conditions and after the tennination of incubation 10 J..lL of
MTT
(5 mg/mL, Sigma) was added and incubated for three hrs at 37°C. The supernatants were removed and replaced with 100 J..lL/well of isopropanol containing HCl (0.04 M) and the ODs were measured. The cytotoxicity assay was carried out by adding interleukin-2 (Cetus, 100 U/mL/2x106) activated peripheral blood mononuclear cells (LAK.) at various effector to target ratios. The cell mixtures were incubated for 4 hrs before washing the cells with RPMl +2% FCS. This was followed by the addition of 100 IlL of RPMI plus 10 ilL of
MIT
for a further 3hr.
The content of each well was then discarded and 100 J..lL/well of acidified isopropanol was added and incubated for 30 min after which the ODs were detennined.New Assay For Cellular Functions
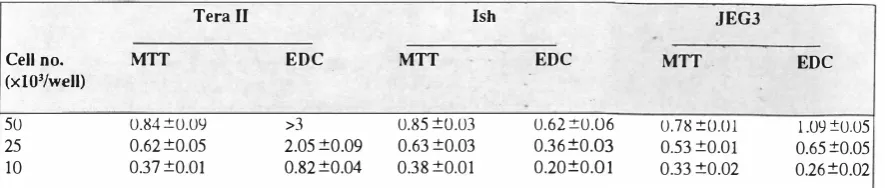
Table III. Optical densities of various cell lines using EDC and MTT assays.
Tera II Ish JEG3
Cell n o. (xIOl/well)
MTT EDC MTT EDC MTT . EDC
50 25 10
0.84 +0.0l) O.62±O.05 O.37±0.01
>3 2.05±O.09 O.82±O.04
0.85±O.03 0.63±0.03 0.38±0.01
0.62:!:0.06 O.36±O.03 O.20±O.01
0.78 :to.Ol 0.53 ±0.01 0.33±0.02
l.Ol):t0.05 0.65:tO.05 0.26±O.02
Results are presented as mean ±SD of optical densities. The coefficient of correlation and p values between the results of MTT and EDC assays in all the cases were r>0.995 and p<O.OOI.
Percent specific killing was calculated as follows:
%Control = Test OD-OD of effector cells alone xlOO
ODoftarget cells alone
A similar approach was used for measuring killing activity using EDC assay except, instead of adding MTT, p-nitrophenyl phosphate buffer was added to the remaining tumor cells and incubated for Ihr at 37°C.
Immunocytochemistry
Tumor cell lines were dispensed onto sterile multi-well microscope slides and incubated for 24 hr after which they were washed in PBS + NaN3,
air
dried and fixed in acetone. After hydration in PBS the peroxidase-anti-peroxidase (PAP) technique previously described by Nouri et al.16 was used. This detection system is referred to as antibody developed color (ADC) assay.R ESULTS
Optimizing time and temperature conditions in EDC assay
Three cell lines were cultured in three separate mic rotiter plates and incubated, one at 4°C, one at room temperature and one at 37°C. The results are presented in Fig. 1 (a, b and c). As can be seen, in all the cases and conditions, there was a direct correlation between cell number and aD. Thus, ODs (lOx 103 cells/well) for JEG3 cells at 4°C, room temperature and 37°C were 0.30 ±0.03, 0.32 ±0.02 and 0.42 ±O.03,respectively. The corresponding values for Ish and SKV14 lines were 0.17±0.001, 0.20±0.001, 0.27 ±0.002 and 0.1O±0.01, 0.12±0.001 and 0.17 ± 0.00 1. Based on these observations, incubation of cells at 37°C for 60 min to develop color were taken to be appropriate and used for the subsequent experiments. In the case of the SKV14 line, because of low aD, the incubation time had to be increased to make accurate measurement possible (results not shown).
Correlation between cell number and optical density Tumor cell lines at varying cell numbers were used for 'EDC assay. As can be seen in Fig. 2, there was a dose
Table IV. Effects of drugs on tumor cells as detected by MTT and EDC assays.
Cell Line MTT EDC
Cis 35% 46%
JEG3 Vin 13% 69%
Cis 28% 48%
Ish Vin 21% 71%
T47D Cis 47% 61%
Vin 30% 57%
Results are represented as percent inhibition. In all the cases, cells were treated with drugs for 48 hrs before the assays. Cis denotes cisplatin (5 �g/mL) and Vin denotes vinblastin
(0.05 �g/mL).
related increase in ODs as the cell number increased. Thus, ODs for cell line JEG3 at 10,25,50 and 100x103 cells/well were 0.16±0.01, 0.37±0.02, 0.96±0.03 and 1.95±0.01, respectively (r=0.995, p<O.OOl ). A similar pattern was seen for other cell lines (Fig. 2). Based on these results lOx 103 cells/well was considered to be sufficient for developing aD for accurate measurement and used in the subsequent experiments.
EDC comparative study for different tumor lines The results in Table I show the relative ODs for various cell lines using EDC assay. As can be seen, the ODs for Tera II and Ep2102 lines were all greater than 0.95 ±0.1O whereas under the same conditions the maximum values for the bladderlines were 0.09 ±0.01. These results indicated that the ODs for the testis lines were much greater than all the other tumor lines tested.
When the cell-free supernatants from the above experiment were screened for the presence of PLAP using the standard ELISA technique, no positivity was detected even in the case of testis lines (results not shown), indicating that phosphatases are not secreted by cells and are most probably cell bound.
A.A.N.P.M. Dabare, et al.
1.0
• Ish-Dead IZl Ish-Live
• T47D-Dead
I
D���gj �
� 0.5
.;;; "
o
]
D.. o
0.0
10 25
3
Cell Number (x10)
50
Fig. 3. Effects of drYlflg (Ill EUC dL11\ 11\ Kl:sulis ur uplJcal density are plotted against cell numhl'l
60
�.:.�
Ish• •
II
JEG3
/)[)
C
40 ... ,... ,... ...�
�
�
(J) U H (J)P-.
20
o
SOil 25/1 12.5/1 6.25/1
Effector /target ratios
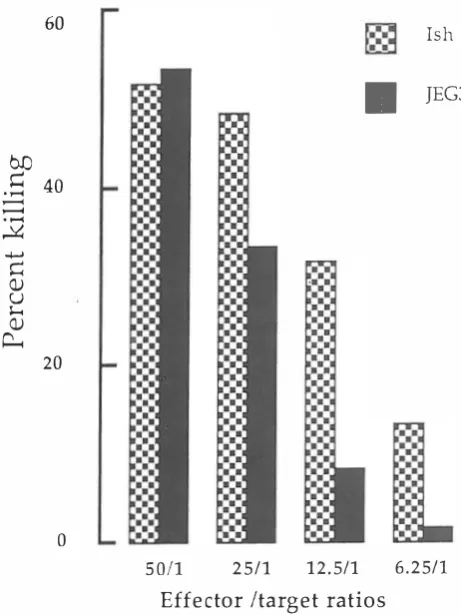
Fig. 4. Tumor cell killing by lL-2-activated MNCs agalflst two tumor targets using EDC assay.
Qualitative assessment of cellular phosphatase using EDC and ADC assays
Various cell lines were used to assess the qualitative difference in cellular phosphatase activity as measured by . EDC and ADC assays (using antibody specific for the
placental isoform of
ALP).
As can be seen from Table II, testis lines showed strong positivity When tested with EDC assay but were negative with ADC. In the case of the bladder lines, both measurements showed negativity whilst in the case of Ish and JEG 3 lines they were both positi ve . These results indicated that testis tumor lines showed strongALP
activity only when measured by enzyme mediated rather than antibody-mediated assay.Effects of drying of cells on A LP activity
In order to establish whether dried cells could be used in EDC assay, two cell lines were used to set up to identical plates containing 10, 25 and 50x103 cells/well. From one, the medium was removed and after washing, left to
air
dry for 2 hrs. After discarding the medium and washing thesecond plate, phosphatase substrate was a.dded to both
plates and incubated at 37°C for 60 min. As can be seen from Fig. 3 in the case of T47D the ODs at 10, 25, and 50x103 cells/well for
air
dried and live cells were O.ll ±O.O 1, 0.11 ±0.01 and 0.12±O.01 and 0.10 ±O.OI, 0.11 ±O.OI and 0.12±0.01, respectively. The corresponding values for Ish cell line were 0.18±0.01, 0.34±0.01 and 0.66±O.01 and 0.19±0.01, 0.33±0.03 and 0.64±0.03_ These results demonstrated that both live and fixed cells could be usedin
EDC assay. The use of stored samples could be important for minimizing inter-experimental errors where there are a large number of samples collected over a long period o f time.Comparison between EDC and MTT assays
In our previous studies,S
MIT
assay was reported to bea reliable method for measuring cell proliferation and cytotoxicity. In this experiment three tumor lines were used
to investigate whether the results from EDC and
MIT
assays were comparable. As can be seen from Table III, .there was a good degree of concordance between the cell number and OD. The coefficient of correlation in all the cases were greater than 0.995, p<O.OOl. These results indicated that the results of the EDC assay could be as
sensitive as the
MIT
assay when measuring tumor cellnumber.
In a separate experiment, three tumor lines cultured in two plates were exposed to two drugs, cisplatin and vinblastin (concentrations had been'previously determined to give 20% to 50% inhibition using
MIT
assay) and after 48 hr of incubation one plate was assessed w ith MTT assay and the other with EDC assay. As can be seen from Table IV, both drugs showed inhibitory activity in MTT as well as EDC assays; however, the degree of inhibition tended to be higher for EDC assay. Thus, the percent inhibition by cisplatin (5 J..I.g/mL) forMIT
and EDC assays for JEG3, Ish and T47D lines were 35% and46% (p>0.05),28%and48% (p<0.01) and 47% and 61 % (p=0.03), respectively. The respective values for vinblastin (0.05 J..I.g/mL)were 13%New Assay For Cellular Functions
and 69% (p<0.002), 21 % and 71 % (p<0.001) and 30% and 57% (p=0.02). These results indicated that the EDC assay was at least as sensitive as the MIT assay for assessing the cytotoxic activity of various agents.
Cytotoxic activity of LAK cells as determined by EDC
assay
The use of EDC assay as a cytotoxicity test was investigated using L AK cells as effector cells and the results are presented in FigA. As can be seen, there was a direct correlation between the effector to target ratios and percent killing. Thus, the percent killing for Ish line at 50/ 1,25/1, 12.5/1 and 6.25/1 EfT ratios was 53%,48%,30% and 14% respectively. The corresponding values for JEG3 cell line were55%, 34%, 8% and4%. These results indicated that it was possible to extend the use of EDC assay for measuring cytotoxicity.
DI SC USSION
The findings of this investigation can be summarized as follows:
1. Under optimized conditions, ther results of EDC showed a direct correlation between cell number and OD. 2. There was a good concordance between the results of EDC and MTT assays.
3. EDC assay could be used for assessing fixed cells as well as LAK cytotoxic activity.
These results showed that a simple EDC assay could be used for various
in vitro
tests. In addition, the flexibility of the assay for using fixed cells makes it more versatile for testing samples collected over a long period.Two issues have recently been attracting a great deal of interest, first the cost of research programs and second the increase in background radioactivity in the environment. The latter has encouraged the development of techniques which do not rely on ,radioactive reagents. Our previous efforts in this area5 resulted in the modification of the MTT colorimetric assay originally reported by Mosmann. 6 Careful studies showed that the technique was sensitive�nough to replace the 3H-thymidine incorporation and chromium release assay which have been used as a "gold standard" for the measurement of cell proliferation and cytotoxicity respectively. In our present study we demonstrated that there was a good correlation between the results of EDC and MTT assays with "r" values of greater than 0.995 and p<O.OOl.
The uptake of radioactive thymidine by dividing cells has long been the method of choice for measurement of cell proliferation.3 However, the technique is rather time consuming and apart from handling radioactive reagents it requires a sophisticated counting machine which may not be available in small research units. There have been various techniques for assessing cell proliferation and
cytotoxicity, the simplest being the counting of cells under a microscope. However, the major problem with this has been the time required for completing a simple screening test and hence has not attracted major enthusiasm. Dye exclusion trypan blue test is the modified version of the counting technique except that the number of cells taking up the dye, i.e. dead cells are counted. 1 The incorporation of bromodeoxyuridine (BrdU), the non-radioactive thymidine analogue to detect cell proliferation has proven to be more environmentally friendly16 but similarly time consuming.
We suggest that the EDC technique could be used for assessing
in vitro
cellular functions where the endp
oint is the assessment of the number of surviving cells. The main advantage of this assay over the others is the rapidity and simplicity as well as the fact that it is economically very favorable. The suitability of the EDC assay using dead cells is particularly interesting in experiments where the num ber of samples are either large or the study is completed over a long period and frequent screening may be uneconomical or cause unacceptable inter-experimental error.R E F ER ENCES
1 . Mullbacher A, Parish CR, Mundy IP: A n improved
colorimetric ass a y for T cell cytotoxicity in vitro, J Immunol
Methods 68: 205, 1984. '2.
Wilson GD, McNally NI, Dische S, Saunder MI, Des Ro
chers C, Lewis AA, Bennett MH: Measurement of cell
kinetics in human tumours using BrUdr incorporation and flow cytometry. Br J Cancer 58: 423, 1988.
3, Nouri AME, Panayi GS, Gooman SM: Cytokines and the chronic inflammation of rheumatic disease. I. The presence of interleukin-l in synovial fluids. Clin E�p Immunol 55: 295, 1984.
4. Williamson K, Gilliland R, Weir H, Grimes I, Hamilton P, Anderson N, Crokard A, Rowlands B: Hydrochloric acid denaturation of colorectal tumour tissue infiltrated with bromodeoxyuridine. Cytometry 15: 162-8, 1994,
5. Hussain RF, Noun AME, Oliver RTD: A new approach for
measurement of cytotoxicity using colorimetric assay. J
Immunol Methods 160: 89-96, 1993.
6, Mosmann T: Rapid colorimetric assay for cellular growth and survival. Application to proliferation and cytotoxicity assays. I Immunol Methods 65: 55, 1983.
7. Brunner KT, Maule I, Cerothini IC, Chapuls B: Quantitation assay of the lytic action of immune lymphoid cells of llCr labelled allogeneic target cells in vitro inhibition by isoantibody and by drugs. Immunology 14: 8, 1968.
8. Noun AME, Bergbaum A, Lederer E, Crosby D, Shamsa A, Oliver R TD: Paired tumour infiltrating lymphocyte (TIL) and tumour cell line from bladder cancer: a new approach to
study tumour immunology in vit ro. Eur J Cancer 27: 608,
1991. •
9. Tucker OF, Oliver RTD, Travers P, Bodmer WF: Serum marker potential of placental alkaline phosphatase-like activity in
A.A.N.P.M. Dabare, et al.
testicular germ cell tumours evaluated by H17E2 monoclonal antibody assay. Br J Cancer 51: 631-639,1985.
10. Wolf M, Benowoodie A, Morgan HG: Comparison of alkaline
phosphatase isoenzyme activity using five standard methods. Clin Chern Acta 24: 131-4,1969.
11. Price CP: MUltiple forms of human serum ALP: detection and quantitation. (Review). Ann Clin Biochem 30: 355-72,1993.
12. Makiya R, Stigbrand T: PLAP has a binding site for the
human IgG Fc portion. Eur J Biochem 205: 341-5, 1992. 13. Betz P: Histological and enzyme histochemical parameters
for the age estimation of human skin wounds. Int J Legal
Medicine 107: 60-8, 1994.
14. Nouri AME, Hussain RF, Dos Santos A VL, Mansouri M, Oliver RTD: Intensity of class I antigen expression on human tumor cell lines and its relevance to the efficiency of non MHC-restricted killing. Br J Cancer 67: 1223-1228,1993. 15. Rinke De Wit TF, Vloemans S, Van Denelsen J, Haworth A,
Stern PL: Differential expression of the HLA class I multi gene fa mily by human embr y o n a l carcinoma and choriocarcinoma cell lines. J Immunol 144: 1080-1087,1993. 16. Mokry J, Nemecek S: Immunohistochemical detection of proliferative cells. S bornik Vedeckych Praci Lekarske Fakul