VOLUME 39, ARTICLE 36, PAGES 963
,
990
PUBLISHED 25 OCTOBER 2018
https://www.demographic-research.org/Volumes/Vol39/36/ DOI: 10.4054/DemRes.2018.39.36
Research Article
From hell to heaven? Evidence of migration
trajectories from an Italian refugee centre
Manuela Stranges
François-Charles Wolff
© 2018 Manuela Stranges & François-Charles Wolff.
This open-access work is published under the terms of the Creative Commons Attribution 3.0 Germany (CC BY 3.0 DE), which permits use, reproduction, and distribution in any medium, provided the original author(s) and source are given credit.
1 Introduction 964
2 Background 965
2. 1 Literature review 965
2. 2 The Italian context 967
3 The migrant population in the Sant’Anna centre 969
3. 1 Description of the data 969
3. 2 The dynamics of entry to the Sant’Anna centre 971
3. 3 From entries to population estimates 974
4 Outflows of migrants from the Sant’Anna centre 976
4. 1 Length of stay in the centre 976
4. 2 The pattern of reasons for departure 977
4. 3 Estimates from a competing risk model 980
5 Concluding comments 985
6 Acknowledgements 986
From hell to heaven?
Evidence of migration trajectories from an Italian refugee centre
Manuela Stranges1
François-Charles Wolff2
Abstract
BACKGROUND
In recent years, large numbers of migrants have attempted to reach Europe by crossing the Mediterranean Sea. Italy plays a central role as a receiving country, particularly because of its relative proximity to the coast of North Africa.
OBJECTIVE
This paper investigates the trajectories of migrants from their entry into a refugee centre to their departure, with evidence on the timing of the departure decision.
METHODS
Using 2008–2014 data from a reception centre for refugees and asylum seekers located in Calabria (Italy), we use survival analysis tools to explore the timing and reasons for departure from the centre.
RESULTS
We find large variation in migrant inflows, with peaks associated with political crises and wars in certain countries. There are substantial differences in outflows between groups of countries, in both the timing and reasons for departure.
CONCLUSIONS
Our results provide a better understanding of migrants’ trajectories from a reception centre in Italy. They show that a huge number of migrants leave the centre voluntarily. CONTRIBUTION
Overall, our study contributes to knowledge of displaced migrants, providing detailed empirical evidence on migrants’ trajectories.
1 Corresponding author. Department of Economics, Statistics and Finance “Giovanni Anania,” University of
Calabria, Arcavacata di Rende, Italy. Email:[email protected].
1. Introduction
Due to the many war and conflict situations worldwide, a growing number of people are leaving their home country to look for better living conditions, free from persecution, violence, or war. According to the most recent data (Caritas 2015; UNHCR 2017) there
were over 65 million forced migrants across the world in 2016.3 In recent years many
migrants have attempted to cross the Mediterranean, mostly heading for Europe aboard unseaworthy boats and dinghies, with dramatic consequences in terms of loss of life (UNHCR 2015). In this framework, Italy has played a central role as a receiving country of this massive inflow of migrants, particularly because of its relative proximity to the coast of North Africa.
In this paper we use a unique data set collected from a reception centre located in Crotone on the eastern coast of Calabria, the most southern region of the Italian peninsular. The centre that we consider hosts migrants who apply for refugee status, but with no certainty that their claim will be accepted. These are displaced individuals who have entered Italy without any legal documents. If their claim is eventually accepted they acquire the status of refugee; otherwise they will receive notification of expulsion and will not be legally entitled to reside in the country. We cover the 2008–2014 period characterized by intense migrant inflows to Italy. Most individuals in the centre were
rescued at sea or intercepted after landing on the Sicilian and Calabrian shores.4 Since
we are not sure that all the individuals in the centre we examine will obtain refugee status or any other form of humanitarian protection, we will refer to them as ‘displaced persons’ or use the more general term of ‘migrants’.
Due to its geographical position, Calabria is very attractive as a migrant gateway to Italy and Europe. At the same time, the region is not very attractive as a place to live because it offers very few economic opportunities. Calabria is the poorest region of Italy. According to Istat (2017), Calabria had a GDP per capita of 15,309.5 euros in 2015 (versus 25,586.4 euros in Italy as a whole), an incidence of poverty at the household level of 26.9% (10.4% in Italy as a whole), and an unemployment rate of 19.4% (11.7% in Italy as a whole). This economic situation has not improved in recent years. While Italy is one of the main entry points to Europe, most migrants do not really want to stay in Italy and when they are not able to escape immediately after landing they do so from the reception centres.
To date, these migration patterns have mainly been documented by journalistic investigations and daily news reports, and there are no official figures on the
3 Out of this total, 2.8 million were asylum seekers, over 22 million were refugees, and the remainder were
internally displaced persons.
4 When analysing our data it should be borne in mind that not all rescues correspond to arrivals by sea, and
phenomenon. Available data is based on the number of untraceable individuals among the total number of asylum applications, meaning that they underestimate the
phenomenon because many migrants escape before submitting their application.5 This
occurs because migrants know that under the Dublin Regulation they will be forced to stay in the country where they first apply, so they try to reach the country where they wish to live after they have landed in Italy (in some cases before applying for
international protection).6 As documented by Kasparek (2016), migrants have tried to
circumvent the strict rules of the Dublin System using a wide variety of strategies, which include attempts to cross the European External Border clandestinely and to travel to the desired destination country in Europe while evading police controls.
Our data offers a unique opportunity to document these migrants’ trajectories at the micro level, from their entry into the centre to their departure. We provide a dynamic empirical analysis with evidence on inflows, length of stay in the centre, and outflows. The rest of our contribution is organized as follows. In the next section we briefly review the literature on displaced migrants’ trajectories and describe the Italian situation regarding the asylum system. In Section 3 we present the data and analyse inflows to the centre. We focus on outflows in Section 4 where we study the length of stay in the centre, reasons for leaving, and timing of departure. Finally, Section 5 concludes.
2. Background
2.1 Literature review
The issue of refugees and asylum seekers has assumed a central place in the European Union political agenda, especially after the summer and autumn of 2015 when media attention focused on the situation at the southern borders of Europe (Guiraudon 2018). Migrants’ characteristics as well as migration intentions and trajectories have also become an important topic in academic debate and have been widely studied, especially
5 Official aggregate data (Commissione Nazionale per il diritto di asilo 2016) shows that from 2008–2014
between 3% (in 2014) and 10% (in 2013) of migrants in the centres were untraceable at the end of the year (meaning that they had escaped after submitting their asylum application, but before knowing if it had been accepted).
6 The asylum system in Europe is administered under the Dublin System, which consists of the Dublin
in ethnographic and geographic research (Bloch, Sigona, and Zetter 2011; Valenta, Zuparic-Iljic, and Vidovic 2015).
Focusing on Sudanese and Nigerian migrants heading to the European Union, Schapendonk and Steel (2014) conclude that the migration process does not follow the conventional order of uprooting–movement–regrounding. Migrants’ trajectories often involve more than two locations and in some cases the migrants’ destinations turn into transit places during the process of movement. Using data from a transit migration hub in Turkey, Wissink, Düvell, and van Eerdewijk (2013) show that transit migration is not necessarily simply a pause in a linear migration pathway but offers a context in which new migratory intentions arise as a consequence of changed social networks and policy interventions. Schuster (2005) documents the high mobility of migrants from Italy to other European countries, attributing this behaviour to the increasing likelihood of asylum claims being rejected.
Valenta, Zuparic-Iljic, and Vidovic (2015) conducted qualitative interviews with asylum seekers in Croatia. They find that most people end up as reluctant asylum seekers in Croatia because they were channelled there by smugglers and apprehended by the police. Nevertheless, many of them decide to continue their journey or make plans to migrate to other receiving countries in Europe, despite the constraints of the Schengen borders and the Dublin Regulations. Several studies have also demonstrated that irregular migrants often did not have an intended destination when leaving their country of origin (Collyer 2007; Grillo 2007; Papadopoulou-Kourkoula 2008; Schapendonk 2012; Düvell 2014; Kuschminder, de Bresser, and Siegel 2015).
The existing quantitative literature on displaced individuals has mainly used aggregate data (Carling 2007; Toshkov 2014). There are also examples of case studies from single refugee centres in Europe, but they focus on specific nationalities and are based on a limited number of interviews (Wijers 2011). An interesting study conducted by a team of researchers led by the Centre for Trust, Peace, and Social Relations at Coventry University and based on 500 interviews with migrants and over 100 interviews with stakeholders conducted in Italy, Greece, Malta, and Turkey reveals that the decision about where to go is made ad hoc along the route (Crawley et al. 2016). In most cases the choice is based on a number of intervening variables and on opportunities that arise during the journey, or that are communicated by agents or smugglers.
Italy. This survey describes the characteristics of migrants and shed light for the first time on migrants’ motivations and future expectations (Chiuri et al. 2004, 2007, 2008).
2.2 The Italian context
Policies aimed at regulating immigration in Italy were not introduced until the late 1980s (Ambrosetti and Cela 2015). In the previous fifty years, immigration issues were regulated only by the T.u.l.p.s (Testo Unico delle leggi di pubblica sicurezza, Unique Text of public order laws) of 1931, which aimed to control the movements of foreigners in relation to public security and order. The topic of refugees and illegal migrants was mostly ignored in Italian legislation since the laws concentrated mainly on the regularization of migrant workers, assuming that Italy was affected by the pull of labour -demand migration. Only recently has Italy implemented some legal measures specifically targeting refugees and illegal migrants (Ambrosetti and Cela 2015).
In Italy there is a variety of centres that welcome, accommodate, identify, or detain foreign citizens who enter the country (Leo 2014). These centres have different legal statuses, depending on the purpose for which they were established. The regulations governing the creation and activities of these structures form a set of fragmented legal measures, contained in a series of laws and decrees. In the case of applicants for international protection, some of these centres are responsible for implementing the assessment procedures and ensuring that applicants meet the relevant requirements. Currently, the system of migrant shelters and detention centres in Italy consists of four different types of structure, all managed by different types of private entities (cooperatives, religious organizations, associations, etc.) under the supervision of the Italian government, which provides financial support.
Due to its central position in the Mediterranean Sea, Italy is an important landing place for legal and illegal migrants. Italy has a long history as a receiving country for migrants, although the flows have increased dramatically, especially in recent years. In Table 1 we present aggregate data on migrant inflows to Italy from 2008 to 2017. Until 2008 the country received around 23,000 migrants per year on average, with a peak of 50,000 in 1999 due to the Albania and Kosovo conflict. In 2008 there was another upsurge of inflow to the country, with a peak of 37,000 migrants, attributable to the conflict and famine situations in Eritrea, Nigeria, and Somalia. In 2009 and 2010 the
numbers declined, with 9,573 and 4,406 migrants, respectively, arriving by sea.7
The Arab Spring of 2011 caused an upturn in landings in Italy, with 63,000 arrivals on the Italian coast in 2011. The humanitarian crisis produced a sharp increase in 2013 and 2014, with over 170,000 arrivals in Italy by sea in 2014. Most African migrants started their journey to Europe from Libya. As instability increased in Libya, this gateway became the one most used by human traffickers. There was a temporary downturn in 2015 (153,842 landings) due to more migrants choosing the alternative Balkan route, followed by an upturn in 2016 (181,436) and a further downturn in 2017 (119,369).
Table 1: Number of migrants landing (by sea) in Italy 2008–2017
Year Arrivals in Europe by Mediterranean Sea
Migrants landing in Italy
Share of total arrivals by sea in Italy
Asylum application
Asylum application examined
2008 59,000 36,951 62.6 31,723 23,175
2009 56,252 9,573 17.0 19,090 25,113
2010 9,654 4,406 45.6 12,121 14,042
2011 70,402 62,692 89.0 37,350 25,626
2012 22,439 13,267 59.1 17,352 29,969
2013 59,421 42,925 72.2 26,620 23,634
2014 216,054 170,100 78.7 64,886 36,330
2015 1,015,078 153,842 15.2 83,970 71,117
2016 362,753 181,436 50.0 123,600 91,102
2017 172,301 119,369 69.3 130,119 81,527
Source: For data in column 1, UNHCR (2018)http://data2.unhcr.org/en/situations/mediterranean; for data in columns 2, 4, and 5, ISMU’s elaboration (2018) on data from the Ministry of Interior (Ministero dell’Interno, Dipartimento della Pubblica Sicurezza, Direzione Centrale dell’Immigrazione e della Polizia delle Frontiere) and Commissione nazionale per i diritto di Asilo; data in column 3 are author’s elaboration of data in columns 1 and 2.
7 This decline may be linked to Italian government policies aimed at strongly countering illegal immigration
3. The migrant population in the Sant’Anna centre
3.1 Description of the data
Our empirical analysis is based on unique data collected from the Sant’Anna centre.
This is a multipurpose CDA/CARA8 centre located in Crotone, one of the five
provincial capitals of Calabria in the South of Italy. Crotone is a port city (over 63,000 inhabitants in January 2017) located on a promontory overlooking the Ionian Sea directly opposite the Greek coast. The centre is located in an old military airport, in front of the current airport and about 15 kilometres from the city centre. It has been operative since 1998 and has a declared capacity of 1,252 places, 256 inmates for the CARA and 956 for CDA. At the time our data refers to it was managed by a religious
brotherhood (Misericordia) under the supervision of the Italian government.9 Migrant
arrivals occur through either direct landings on the Calabrian coast near the centre or through inflows from the island of Lampedusa and reception centres in Sicily. At the end of 2014 the Sant’Anna refugees and asylum seekers’ centre was one of the largest
migrant reception centres in Europe.10
Upon arrival in the centre, migrants go to the police headquarters where they receive a card with an identification number. They are assigned accommodation and talk to social workers who identify and support those who are in need of assistance, such as victims of trafficking or torture, unaccompanied minors, pregnant women, and women with children. Migrants also receive legal information along with a description of the various services in the centre (legal assistance, mediation activities, leisure, Italian courses and so on). The space per capita in the centre is below the standard
prescribed for emergency refugee camps.11 Sant’Anna is not a detention centre, so
migrants are free to leave the centre whenever they want between 8a.m. and 8p.m. To our knowledge, there are no specific or differentiated controls by origin country and all migrants receive the same attention.
8 CDAs (Centri di Accoglienza, Centres of Hospitality) are centres where newly arrived migrants, regardless
of their legal status, are transferred to receive first aid and be registered. Migrants are issued with a decision which legitimates their presence on the Italian soil or with an order for their expulsion from the country. CARAs (Centri di Accoglienza per richiedenti asilo, Reception Centres for Asylum Seekers) are centres where asylum seekers without identity documents or who refuse to undergo border controls are sent in order to be identified and to apply for recognition of their refugee status.
9 It is currently managed by Consorzio Opere Misericordie.
10 It hosted 13% of total migrants residing in the 13 reception centres (CARA/CDA and CPSA) operating in
Italy, with 1,236 migrants out of a total of 9,592 present in the structures throughout the country (authors’ calculation using data from Italian Ministry of Interior 2015).
11 According to the international standards, in the early stages of a humanitarian emergency, refugee camps
Our data corresponds to the exhaustive list of migrant entries to the Sant’Anna centre between 1 January 2008 and 31 December 2014. Unfortunately we do not have data on the most recent years. After obtaining special permission from the Ministry of Interior to collect and use data from the centre for research purposes, we obtained the administrative registers filled in by the officers working in the centre. Our dataset is different from a census since it does not provide exhaustive information on the population living in the centre at a given date. Instead, it focuses on entries to and exits from the centre over a period of seven years. For each migrant we have the following information over the period: gender, date of birth, origin country, place of origin (if they come directly from the sea, from another reception centre, etc.), date of entry, date
of exit (if any), and reason for departure.12
The record of exit data and reasons for departure is extremely precise. There are three possible reasons for departure: transfer to another centre, obtaining any kind of protection (in this case the type is specified: humanitarian protection, political asylum, subsidiary protection, temporary residence permit), and escape. Since migrants hosted in the centre are free to leave the centre during the day but are obliged to come back every evening, those who do not come back for several days are considered as
‘escaped’ and recorded as having voluntarily departed.13 Although we have few
individual characteristics (there is no information on education or social status in the origin country) we can describe accurately the trajectories of migrants who spent time in the centre, from entry to exit, at least for those who have left.
Overall, the data covers 26,666 entries to the centre: 5,661 in 2008, 2,621 in 2009,
2,451 in 2010, 6,555 in 2011, 1,701 in 2012, 3,250 in 2013, and 4,427 in 2014.14 In
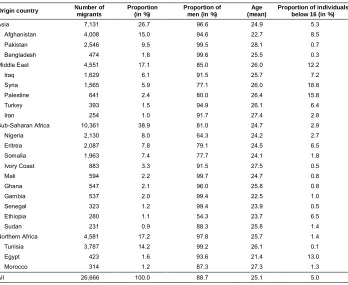
Table 2 we provide a description of the gender, age, and nationality of migrants who entered the Sant’Anna centre between 2008 and 2014. In our data 38.9% of migrants come from sub-Saharan Africa and 17.2% from Northern Africa. The main contributing countries from Africa are Tunisia (14.2%), Nigeria (8.0%), Eritrea (7.8%), and Somalia (7.4%). Migrants from Asian and Middle East countries mainly come from Afghanistan (15.0%), Pakistan (9.5%), Iraq (6.1%), and Syria (5.9%). The overall proportion of male migrants is 88.7%, with an average age of 25.1 years. Almost all Asian migrants are male, but women account for 20% of migrants from Palestine and 22.9% from
12 Data on date of birth and country of origin are those reported in registers, but we cannot exclude the
presence of measurement errors if migrants provide incorrect information on their age or their country of origin.
13 When we use the term ‘escaped’ we refer to those who decided to leave the centre voluntarily, whether or
not they escaped before knowing the decision of the commission about their asylum application or even before applying for protection. This is often the case when the voluntary departure takes place in the first few days after arrival.
14 The original sample includes 26,675 entries. We exclude two observations with missing information on
Syria. Migrants aged below 16 most frequently come from Syria (18.8%), Palestine (15.8%), and Egypt (13%). The composition of migrants by country of origin suggests that landings in Italy mainly involve people fleeing conflict and persecution (Bonifazi 2017).
Table 2: Descriptive statistics of entries to the Sant’Anna centre
Origin country Number of migrants
Proportion (in %)
Proportion of men (in %)
Age (mean)
Proportion of individuals below 16 (in %)
Asia 7,131 26.7 96.6 24.9 5.3
Afghanistan 4,008 15.0 94.6 22.7 8.5
Pakistan 2,546 9.5 99.5 28.1 0.7
Bangladesh 474 1.8 99.6 25.5 0.3
Middle East 4,551 17.1 85.0 26.0 12.2
Iraq 1,629 6.1 91.5 25.7 7.2
Syria 1,565 5.9 77.1 26.0 18.8
Palestine 641 2.4 80.0 26.4 15.8
Turkey 393 1.5 94.9 26.1 6.4
Iran 254 1.0 91.7 27.4 2.8
Sub-Saharan Africa 10,361 38.9 81.0 24.7 2.9
Nigeria 2,130 8.0 64.3 24.2 2.7
Eritrea 2,087 7.8 79.1 24.5 6.5
Somalia 1,963 7.4 77.7 24.1 1.8
Ivory Coast 883 3.3 91.5 27.5 0.5
Mali 594 2.2 99.7 24.7 0.8
Ghana 547 2.1 96.0 25.8 0.8
Gambia 537 2.0 99.4 22.5 1.0
Senegal 323 1.2 99.4 23.9 0.5
Ethiopia 280 1.1 54.3 23.7 6.5
Sudan 231 0.9 88.3 25.8 1.4
Northern Africa 4,581 17.2 97.8 25.7 1.4
Tunisia 3,787 14.2 99.2 26.1 0.1
Egypt 423 1.6 93.6 21.4 13.0
Morocco 314 1.2 87.3 27.3 1.3
All 26,666 100.0 88.7 25.1 5.0
Source: Data from Sant’Anna centre 2008–2014, authors’ calculations.
3.2 The dynamics of entry to the Sant’Anna centre
range between 37 entries (January 2012) and 2,395 entries (March 2011), with a median value of 204. It is expected that the time profile of inflows is influenced both by political crises and wars that force people to leave their origin country, and by the availability of places in the centre, which determines whether local authorities can host new migrants.
Figure 1: Monthly number of entries to Sant’Anna centre
Source: Data from Sant’Anna centre 2008–2014, authors’ calculations.
The peak in March 2011 is a very good illustration of the role played by the political context. In January a total of 116 migrants entered the Sant’Anna centre. The number then rose very sharply, from 1,406 in February to 2,396 in March, before falling to 937 in April and 222 in May. The peak is essentially explained by a huge increase in the number of migrants coming from Northern Africa due to the Arab Spring, and also to a lesser extent from sub-Saharan Africa in March and April. Another peak concerns migrants from Tunisia in 2011: There were 1,167 entries from Tunisia in February 2011 and 1,701 in March, in contrast to a total of just 633 between 2008 and 2010. These inflows are connected to the Jasmine Revolution, which began in mid-December 2010. A state of emergency was declared after the departure of president Ben Ali on January
0 500 1000 1500 2000 2500 M on th ly nu m be r of en tr ie s 1 -2 00 8 4 -2 00 8 7 -2 00 8 10 -2 00 8 1 -2 00 9 4 -2 00 9 7 -2 00 9 10 -2 00 9 1 -2 01 0 4 -2 01 0 7 -2 01 0 10 -2 01 0 1 -2 01 1 4 -2 01 1 7 -2 01 1 10 -2 01 1 1 -2 01 2 4 -2 01 2 7 -2 01 2 10 -2 01 2 1 -2 01 3 4 -2 01 3 7 -2 01 3 10 -2 01 3 1 -2 01 4 4 -2 01 4 7 -2 01 4 10 -2 01 4
14, 2011, but violence and looting continued for a couple of weeks. Starting in
mid-February 2011, about 5,000 Tunisian migrants landed on the island of Lampedusa.15
A less pronounced peak is observed for migrants from Syria between 2013 and 2014. This is attributable to the increase in the number of conflicts in this country, which doubled from three in 2011 to six in 2012 and reached seven in 2013 and 2014, when the conflict reached the highest level of gravity and intensity (Conflict Barometer
2013, 2014).16 The Syrian civil war, with approximately 125,000 deaths since its start in
2011, is the conflict with by far the most casualties during the period studied. It displaced more than six million people, causing an increase in the numbers seeking international protection. Over the same period Syria was also affected by conflict with the Islamic State in Iraq and Syria. The battle between Syria and Israel, permanently engaged in a border crisis over the contested Golan Heights, also flared up again, with exchanges of fire between militants on Syrian territory and Israeli Defence Forces. The effect of this last conflict is also evident in the inflow of migrants from Palestine. Additionally, the peak of migrants from Palestine in 2014 can be linked to the increased intensity of the historical conflict between Hamas and the Israeli Government since 1988.
Our dataset includes the Italian city from which migrants came, which are generally places near to the landing area (this information is available for 78.4% of migrants). The most frequent cities are Crotone (29.8%), Lampedusa (15.2%), Agrigento (7.4%), and Siracusa (2.8%). Migrants coming from Lampedusa, Agrigento, Siracusa, and other cities are those transferred from other centres. Location often depends on migrants’ origin country. Most migrants entering Italy through Crotone, on the Eastern coast of Calabria opposite Greece, come from Asia or the Middle East. The four most frequent origin countries of migrants arriving in Crotone are Afghanistan (24.1%), Pakistan (21.5%), Iraq (11.7%), and Syria (7.5%). Conversely, the Island of Lampedusa, located in the middle of the Mediterranean Sea (between Malta and Tunisia), is the main entry point for migrants from Tunisia (65.7%), Somalia (10.4%), and Nigeria (7.9%). Finally, Agrigento and Siracusa in Sicily mainly attract migrants from sub-Saharan Africa (28.3% from Eritrea and 19.4% from Somalia).
15 This forced Italy to declare a state of emergency on Lampedusa and to appeal to other European Union
members for help. There were suspicions that some of these arrivals were former supporters of the ousted regime of President Ben Ali.
16 The Conflict Barometers, published since 1992 by The Heidelberg Institute for International Conflict
3.3 From entries to population estimates
Since our database is not a census we do not know the exact population of migrants
living in the camp on a given date. Let t =1,…,T be the set of dates in our sample, t
corresponding to a day. For a migranti, the information that we have is the entry datet
and the departure datet witht≥t (orT if the migrant has not left the centre at the end of
the period). Let , be a dummy variable such that , = 1 when the migrant is in the
centre at datet and , = 0 otherwise. An approximation of the population inside the
camp is thusPt=∑ ,. The drawback of this measure concerns the beginning of the
period since we have no information on migrants having registered in the centre before
= 1, so that underestimates the true populationPt for low values of . However, if
there is no migrant permanently residing in the centre, then will provide a good
approximation ofPt, especially as long as increases.
Starting from July 2008, we describe in Figure 2 the number of migrants living in
the centre calculated asPt=∑ , on a weekly basis. The number of migrants reaches a
peak exceeding 1,600 by the end of 2008 (October, November). We also plot (dashed line) the maximum capacity of the Sant’Anna centre (N = 1,252). Although we underestimate the exact population living in the camp, our results highlight the overcrowding of the centre since the approximate population exceeded the maximum capacity from August 2008 to the end of 2008. The population then tends to decrease up to January 2011. During that period there were on average more exits than entries to the Sant’Anna centre. There is a second peak in the number of residents in mid-March 2011
due to the political crisis in Tunisia.17 After reaching a low point of around 1,000
migrants by mid-2012, the upward trend resumed. The number of residents in the centre remained above 1,400 persons after the fourth semester of 2012. In 2014 the average weekly number of migrants was 1,839, 8.7 percentage points higher than in 2013 (43.5 points higher than in 2012).
17 The centre was severely overcrowded (more than 2,500 migrants) during the 6 weeks from the 10th to the
Figure 2: Weekly number of migrants entering the Sant’Anna centre
Source: Data from Sant’Anna centre 2008–2014, authors’ calculations.
Note: We start in July 2008 since we only have information on migrants entering the centre and not on those already in the centre at the beginning of the period.
Knowing the maximum capacity of the centre (N = 1,252), we define an indicator of overcrowding which is the number of weeks when the total population exceeds maximum capacity. Between 2009 and 2014 we find that 59.8% of weeks were
characterized by an excess of migrants in the Sant’Anna centre.18 The migrant
population was 20% larger than the maximum capacity in 43.1% of weeks and 50% larger in 9.5% of weeks. The fact that periods when the centre was extremely overcrowded remain limited supports two different interpretations. First, management of inflows to the centre may have led to some smoothing of migrant peaks. When square meters available per person become scarce in the centre, the local authorities have to arrange transfers of migrants to other camps. Second, migrants may have found the overcrowding very difficult to endure and chose to leave the camp on their own initiative.
18 We exclude 2008 from the calculation since our approximation of the population living in the centre is poor
in the first semester of that year due to left censoring. 0
500 1000 1500 2000 2500 3000
N
um
be
r
of
m
ig
ra
nt
s
01
-2
00
8
01
-2
00
9
01
-2
01
0
01
-2
01
1
01
-2
01
2
01
-2
01
3
01
-2
01
4. Outflows of migrants from the Sant’Anna centre
4.1 Length of stay in the centre
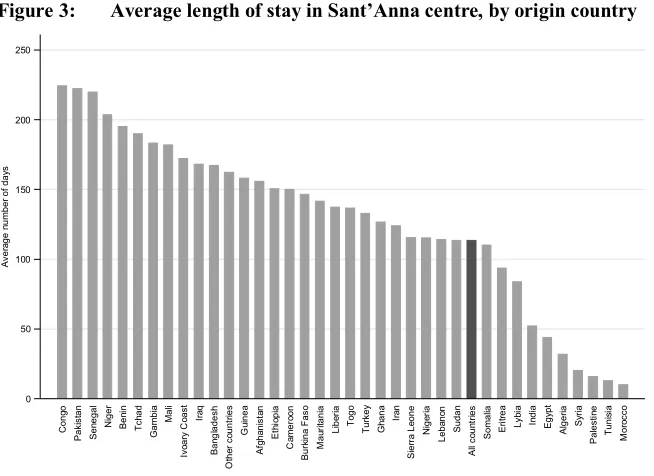
In Figure 3 we present the average number of days (defined as date of exit minus date of entry) spent by migrants in the centre by country of origin, countries being sorted by
decreasing duration.19 The average duration in the centre is nearly four months (113.2
days) with a standard deviation of 127.1 days. The median length of stay is 58 days, but there are large differences in the length of stay: 25% of migrants spent at most 8 days and 25% spent more than 192 days in the centre.
Figure 3: Average length of stay in Sant’Anna centre, by origin country
Source: Data from Sant’Anna centre 2008–2014, authors’ calculations.
Note: Countries are sorted by decreasing duration, migrants in the centre at the end of December 2014 (N = 1,357) being excluded.
Migrants from sub-Saharan African countries stay in the centre the longest, with eight countries in the top 10. In particular, the average duration is above 200 days for migrants from Congo, Senegal, and Niger, and exceeds 150 days for migrants from
19 We excluded the subsample of migrants residing in the centre at the end of December 2014 (N = 1,357).
These observations are right-censored since the total length of stay remains unknown.
Benin, Gambia, Mali, Ivory Coast, and Guinea. It is also above 150 days for migrants from Pakistan, Bangladesh, Chad, Iraq, and Afghanistan. Conversely, the shortest durations are observed for migrants from two different regions: the Maghreb, with Morocco (10.1 days), Tunisia (13.0 days), and Algeria (31.9 days); and Middle Eastern countries affected by political crises and wars: Palestine (15.8 days), Syria (20.2 days), and Egypt (44.1 days).
We further investigate differences in the timing of migrants’ exit decisions by calculating Kaplan-Meier estimators of the survival function for the main countries of
origin. Our results highlight substantial differences between groups of countries.20 More
than 80% of migrants from North Africa (Tunisia, Egypt, Morocco) left the centre within 30 days of entering. For migrants from sub-Saharan Africa (Nigeria, Eritrea, Somalia) the percentage leaving within 30 days is at most 40%, and only 30% for migrants from Asia (Afghanistan, Pakistan, Bangladesh). The contrast is greater within the group of Middle Eastern countries. Less than 10% of migrants from Syria and Palestine were still in the centre two months after entry, but the survival function estimates for Iraqi migrants look much more like those found for Asian migrants.
4.2 The pattern of reasons for departure
Migrants may leave the centre either voluntarily or involuntarily and for very different reasons. First, the authorities may transfer migrants arriving in an overcrowded centre to other centres elsewhere in Italy due to space constraints. Second, migrants may have to leave the centre if their asylum application is refused or they do not obtain refugee status. Third, migrants may be expelled from Italy if they come from a country from which migration is perceived as illegal. Fourth, migrants may not be in the right place. In particular, Italy serves as a gateway for certain migrants coming from Africa or the
Middle East and wishing to go to another country in Europe (Schuster 2005).21 In that
case, migrants will be tempted to leave the centre on their own initiative in order to avoid having to stay in Italy. Clearly, the reasons for departure affect time spent in the centre.
In Table 3 we present the various reasons for departure recorded in our data, by country of origin. The most frequent reason is departure on the migrant’s own initiative. This concerns more than 4 migrants in 10 (43.6%). By decreasing order of importance, the other reasons are granting of subsidiary protection (16.1%), transfer to another
20 Migrants still living in the centre at the end of the period are now taken into account and treated as censored
observations. These results are available upon request.
21 In a study of Croatia, Valenta, Zuparic-Iljic, and Vidovic (2015) conclude that the country is not a preferred
centre (12.5%), temporary residence permit (9.9%), humanitarian protection (7.0%),
and political asylum (6.2%).22 Expulsions from Italy are very infrequent (2.6%).23 There
are substantial differences by country of origin: 73.7% of migrants from North Africa and 63.8% from the Middle East decide to leave the centre on their own initiative, but only half as many migrants from Asia (31.8%) and sub-Saharan Africa (27.7%).
Table 3: Reasons for departure from Sant’Anna centre, by country of origin
Country of origin Voluntary departure
Subsidiary protection
Transferred by authorities
Temporary residence permit
Humanitarian Protection
Political asylum Expulsion
Other reasons
Number of observations
Asia 31.8 24.4 14.1 11.9 10.8 4.7 1.4 0.8 6,735
Afghanistan 32.7 36.0 15.0 0.8 9.0 3.7 2.4 0.3 3,965 Pakistan 25.1 9.3 13.9 29.5 14.2 6.7 0.0 1.1 2,288 Bangladesh 51.6 1.6 10.0 21.8 9.2 1.8 0.0 3.9 380 Middle East 63.8 14.3 7.0 1.3 4.0 8.3 0.9 0.4 4,532
Iraq 35.0 33.8 10.0 0.7 4.9 15.0 0.4 0.2 1,615
Syria 94.2 1.1 1.0 0.3 0.1 2.8 0.5 0.0 1,562
Palestine 83.9 0.9 10.2 0.0 0.6 2.0 2.3 0.0 640
Turkey 40.5 13.2 8.7 8.9 20.4 4.8 0.3 3.3 393
Iran 51.4 8.3 10.3 1.6 4.7 20.6 3.2 0.0 253
Sub-Saharan Africa 27.7 18.7 16.1 17.0 8.6 8.8 0.1 3.0 9,426 Nigeria 23.7 1.8 19.8 37.9 9.6 1.0 0.1 6.2 1,982 Eritrea 51.1 17.2 13.0 0.3 1.2 16.8 0.0 0.3 2,083 Somalia 29.0 48.5 11.0 0.3 1.7 9.5 0.1 0.1 1,960 Ivory Coast 5.2 28.3 14.2 13.0 28.2 8.6 0.0 2.5 802
Mali 12.0 9.9 35.4 23.2 17.7 0.3 0.0 1.6 384
Ghana 12.6 2.9 25.5 43.0 4.3 0.8 0.2 10.6 509
Gambia 21.0 2.4 21.0 35.9 12.1 5.9 0.0 1.7 290
Senegal 9.7 5.8 18.4 33.0 26.7 4.4 0.0 1.9 206
Ethiopia 35.6 16.5 5.8 2.2 19.8 19.4 0.0 0.7 278
Sudan 52.7 6.8 7.2 4.1 2.3 24.8 0.5 1.8 222
Northern Africa 73.7 0.2 7.6 0.8 0.6 1.0 11.2 5.0 4,577
Tunisia 83.4 0.1 2.2 0.3 0.2 0.1 7.7 6.0 3,786
Egypt 26.2 0.2 54.4 5.2 4.7 8.0 1.2 0.0 423
Morocco 26.0 1.3 10.0 0.6 1.0 0.0 60.8 0.3 311
All 43.6 16.1 12.5 9.9 7.0 6.2 2.6 2.3 25,309
Source: Data from Sant’Anna centre 2008–2014, authors’ calculations.
Note: Migrants in the centre at the end of December 2014 (N = 1,357) are excluded.
22 The temporary residence permit is issued to those illegal migrants who have to apply for international
protection pending a decision about their application.
23 There is also a residual category of 2.3% of refugees. It includes other reasons such as refusal (those who
There are large differences in reasons for departure, even among countries from the same region. In particular, only one in four migrants from Egypt and Morocco choose to leave the centre on their own, versus 83.4% of Tunisians. The same pattern is found for migrants from the Middle East. Migrants coming from Syria and to a lesser extent Palestine appear to not intend to stay permanently in Calabria, since 94.2% of the former and 83.9% of the latter chose to leave the centre voluntarily. The exit rate for transfer to another centre ranges between 10% and 20% for most countries, a noticeable exception being the case of Egyptians, presumably due to the suddenness of inflows (54.4%). The exit rate for humanitarian reasons is more frequent among migrants from the Ivory Coast (28.2%), Senegal (26.7%), Sudan (24.8%), and Turkey (20.4%). Finally, exit due to political asylum mostly concerns migrants from Sudan (24.8%), Iran (20.6%), and Ethiopia (19.4%).
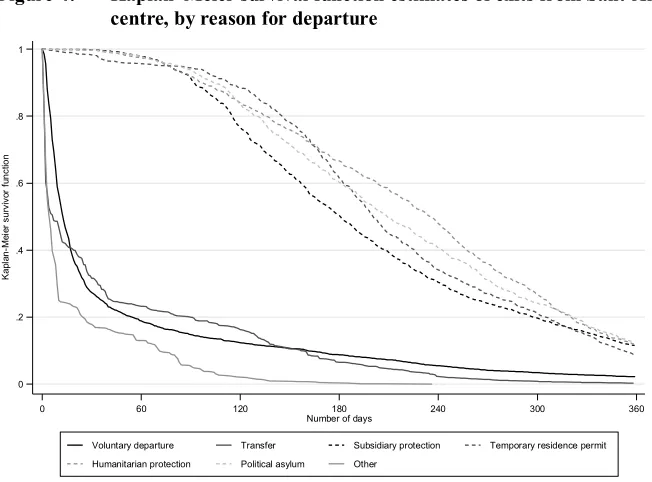
Figure 4: Kaplan–Meier survival function estimates of exits from Sant’Anna centre, by reason for departure
Source: Data from Sant’Anna centre 2008–2014, authors’ calculations.
Note: Migrants in the centre at the end of December 2014 (N = 1,357) are excluded. The other reason includes expulsions.
4.3 Estimates from a competing risk model
Individual characteristics are likely to influence the type of exit from the centre. When granting refugee status, local authorities are likely to be more sensitive to the situation of more vulnerable people, in particular children or women with young children. Conversely, young adults in their prime may be more tempted to go where they will be able to start a new life and find full-time employment. We use a survival analysis framework to assess the role of migrants’ characteristics in the various risks of leaving the centre. We group together all causes of departure related to obtaining a form of
international protection, and consider the four following causes ( ): voluntary exit
( = 1), transfer to another centre ( = 2), international protection ( = 3), other
reasons ( = 4). Since each migrant may be affected by one of these mutually exclusive
events, we use a competing risk model (Fine and Gray 1999).
We rely on the flexible parametric survival model originally proposed by Royston and Parmar (2002). The cause-specific hazard for each reason for departure is estimated
0 .2 .4 .6 .8 1
K
a
pl
an
-M
ei
er
su
rv
iv
or
fu
n
ct
io
n
0 60 120 180 240 300 360
Number of days
using a competing risk setting. Assuming proportional hazards, the cause-specific hazard for a migrant with observable characteristics depends on a baseline hazard
which is specific to each cause and cause-specific parameters . The cumulative
hazard function is modelled as a natural cubic spline function of the logarithm of time. Next, the cause-specific hazards are used to determine the cumulative incidence function associated with each cause. This function will give the proportion of migrants endowed with characteristics who have left the centre at a given time due to a specific
cause , provided that they may have left the centre for another reason.24
We estimate the survival model for the four reasons for departure simultaneously. The control variables are gender, age group, and country of origin. Results from the flexible model for gender and age are reported in Table 4, where we present hazard ratios obtained from the proportional hazard estimates. The risk of either voluntary departure from the centre or obtaining international protection is 46%–49% higher for women than for men. Conversely, women have a much lower risk of leaving the centre for another reason. Children below 16 are characterized by a higher risk of voluntary departure, transfer, or international protection. The higher risk of being transferred may be related to the fact that when the children are unaccompanied the authorities may decide to move them to a special facility for minors. At the same time, they obtain international protection more easily because foreign minors, even if they have entered Italy irregularly, hold all the rights enshrined in the New York Convention on the Rights of the Child of 1989, ratified by Italy (Law n. 176/91).
The various coefficients associated with origin countries show substantial differences in exit risk by reason. Voluntary departures are more likely among migrants from Palestine, Tunisia, Syria, and Morocco. Conversely, migrants from Ivory Coast, Senegal, Burkina Faso, Mali, Togo, and Guinea are less concerned with voluntary departure. Transfers are less likely among migrants from Syria, Tunisia, and Ethiopia, but the reverse pattern is found for migrants from Egypt and Morocco. The risk of exit because of international protection is much lower for migrants from Bangladesh, Mali, Gambia, Pakistan, and Senegal. Morocco is the origin country with the highest risk of receiving international protection status, followed by many sub-Saharan countries (Somalia, Togo, Burkina Faso, Ghana, Ivory Coast, Nigeria, Eritrea). Finally, the risk of exit for another reason is much higher for migrants from Morocco and Tunisia.
24 The cumulative incidence function depends not only on the cause-specific hazard for cause , but also on
Table 4: Flexible parametric survival hazard ratios for competing risks of exit from Sant’Anna centre
Variable Voluntary
departure
Transferred by authorities
International protection
Other reasons
hazard t-value hazard t-value hazard t-value hazard t-value
Female 1.463*** (12.31) 1.029 (0.46) 1.489*** (10.32) 0.595*** (–3.98) Age
Less than 16 ref ref ref ref
16–24 0.754*** (–6.62) 0.787*** (–2.86) 0.505*** (–10.13) 0.858 (–0.67) 25–34 0.630*** (–10.74) 0.603*** (–5.84) 0.496*** (–10.42) 0.812 (–0.91) 35 and more 0.660*** (–8.60) 0.561*** (–5.56) 0.512*** (–9.13) 0.915 (–0.37) Origin: Afghanistan 5.534*** (4.51) 0.526*** (–3.58) 0.563*** (–5.17) 0.397*** (–2.66) Country
Tunisia 57.412*** (10.70) 0.172*** (–8.55) 0.604** (–2.21) 5.068*** (4.80) Pakistan 3.224*** (3.08) 0.408*** (–4.90) 0.388*** (–8.44) 0.126*** (–5.35) Nigeria 3.824*** (3.52) 0.721* (–1.79) 0.896 (–0.97) 0.997 (–0.01) Eritrea 11.426*** (6.42) 0.601*** (–2.75) 0.856 (–1.35) 0.066*** (–5.39) Somalia 5.778*** (4.61) 0.448*** (–4.28) 1.479*** (3.47) 0.026*** (–5.47) Iraq 5.490*** (4.48) 0.346*** (–5.55) 0.628*** (–4.09) 0.083*** (–5.42) Syria 56.155*** (10.62) 0.074*** (–8.34) 0.830 (–1.14) 0.202*** (–3.27) Ivory Coast 0.772 (–0.63) 0.471*** (–3.81) 0.900 (–0.91) 0.307*** (–2.94) Palestine 77.529*** (11.43) 0.943 (–0.27) 0.752 (–1.21) 1.181 (0.39) Mali 1.234 (0.52) 0.784 (–1.26) 0.334*** (–8.42) 0.135*** (–3.79) Ghana 2.332** (2.13) 0.975 (–0.13) 0.938 (–0.51) 1.567 (1.25) Gambia 1.827 (1.51) 0.378*** (–4.49) 0.352*** (–7.80) 0.126*** (–3.72) Bangladesh 6.847*** (5.00) 0.285*** (–5.28) 0.297*** (–8.71) 0.428** (–2.01) Egypt 11.340*** (6.23) 3.912*** (7.27) 0.705** (–2.21) 0.418 (–1.56) Turkey 7.780*** (5.31) 0.341*** (–4.40) 0.758** (–2.11) 0.543 (–1.43) Senegal 0.939 (–0.14) 0.383*** (–4.03) 0.425*** (–6.24) 0.161*** (–3.04) Morocco 28.993*** (8.54) 1.045 (0.18) 1.708 (1.52) 36.488*** (10.45) Ethiopia 5.004*** (4.11) 0.202*** (–5.22) 0.690*** (–2.74) 0.120*** (–2.71) Iran 10.636*** (6.09) 0.434*** (–3.18) 0.539*** (–4.08) 0.532 (–1.30) Sudan 10.779*** (6.11) 0.304*** (–3.91) 0.699** (–2.32) 0.386* (–1.71) Guinea 1.511 (0.90) 0.405*** (–3.14) 0.666*** (–2.66) 0.984 (–0.04) Togo 1.317 (0.56) 0.638* (–1.66) 1.330* (1.90) 1.134 (0.28)
Burkina Faso ref ref ref ref
Number of observations 26,057 Log likelihood –54310.1
Source: Data from Sant’Anna centre 2008–2014, authors’ calculations.
Note: Estimated hazard ratios from a flexible parametric survival model for competing risk. Significance levels are 1% (***), 5% (**), and 10% (*). The model includes a set of origin-country dummies for each cause (not reported). The sample is restricted to countries with at least 100 migrants.
are made for male migrants aged between 16 and 24, predictions being restricted to a
maximum follow-up time of one year.25 For migrants from Afghanistan the probability
of exit is 0.277 one month after entry. These quick exits are essentially explained by voluntary decisions to leave the centre (0.169) and to a lesser extent by transfer decisions from local authorities (0.091). At six months the exit probability is 0.594, but the distribution of reasons is different. Voluntary decisions and imposed transfers represent around two-thirds of all causes of exit at that time [(0.277+0.128)/ 0.594 = 0.681]. The exit probability associated with international protection, which was almost negligible at one month, is now 0.165. Afterwards, the refugee cause-specific probability continues to grow, reaching 0.400 twelve months after entry.
For all countries, the incidence functions associated with transfers to other centres and voluntary exits quickly become horizontal. Clearly, transfers relate to the capacity of the centre. If migrants cannot be accommodated in decent conditions they will presumably be redirected to other centres. Also, it seems obvious that migrants who have fled their country of origin and do not wish to stay in Italy (or at least in Calabria) will seek to leave the camp shortly after their arrival. Migrants who have experienced harsh conditions reaching Italy will take days or weeks to recover the necessary strength for the remainder of the journey to their intended destination. Lastly, the profile of the cause related to international protection starts increasing after 120 days and continues to increase until one year after entry. This is closely related to the time local authorities require to examine refugee claims.
Comparison of the country-specific incidence functions sheds light on substantial differences not only between selected countries but also within countries from the same region of origin. As shown in Figure 5, migrants from Syria and Palestine do not want to stay in the centre. One month after they entered the camp, 86% of Syrian migrants (81.2% of Palestinians) had left the centre of their own accord and 91.5% (83.6%) had left after two months. Conversely, only 17.5% of migrants from Iraq, a country in the
same region, had left within one month and only 21.7% within two months.26 The
various incidence functions are more similar for migrants from Asia (Afghanistan, Pakistan, Bangladesh): The exit rate from voluntary departure ranges between 15% and 30% two months after entry. For migrants from North Africa the sudden arrivals in February and March 2011 led to a massive number of voluntary exits for Tunisians (about 80% two months after entry), while more than 50% of Egyptians left with refugee status. Finally, the proportion of migrants from sub-Saharan Africa who left of their own accord is substantially higher for Eritreans than for Nigerians and Somalis.
25 Each month is assumed to comprise 30 days, so that the duration of the year is approximated by 12*30=360
days.
26 One year after entry the proportion of residents having left the centre with refugee status was around 46.5%
Figure 5: Stacked cumulative incidence of the various reasons for departure from Sant’Anna centre, by origin country
Source: Data from Sant’Anna centre 2008–2014, authors’ calculations.
Note: The cumulative incidence functions are calculated for male migrants aged between 16 and 24.
5. Concluding comments
In recent years the issue of displaced persons has increasingly attracted the attention of the media and policymakers in Europe. However, to date little is known about the trajectories of migrants immediately after arrival. The aim of this paper was to provide an empirical analysis of the trajectories of migrants after their entry into a refugee centre. For that purpose we used administrative data collected between 2008 and 2014 in a migrant centre located in the South of Italy. Although there are very few individual characteristics, we are able to provide an accurate description of the trajectories of migrants passing through the centre, with information on time of entry, time of exit, and reasons for exit.
We find large variation in migrant inflows over the period, with peaks associated with political crises and wars in certain countries. The Sant’Anna centre is often overcrowded: Between 2009 and 2014 there was overcrowding for 60% of the time. There are substantial differences between country groups both in the timing and reason for departure. The risk of both voluntary departure from the centre and obtaining international protection is higher for women than for men and children below 16, but the most important finding is that migrants from Syria and Palestine and to a lesser extent North Africa leave the centre very quickly. This suggests that Calabria (and presumably Italy) is not the intended location of migrants from these origin countries. There is also substantial variation by migrants’ characteristics, both in the time spent in the centre and in the reason for departure. Overall, our findings confirm results from previous studies that have highlighted that the journeys and experiences of refugees and migrants are shaped by nationality, economic status and education, gender, ethnicity, and age (Crawley et al. 2016).
As we only have access to data from one refugee centre, our main findings cannot be generalized to elsewhere in Italy. Due to its location in the South, the entry and exit dynamics of this reception centre may differ from migrant inflows and outflows in the rest of Italy. There may be several reasons for this. First, when the reception centre has reached its maximum capacity, entries might differ from general migration trends to Italy. Second, if there are incentives to cluster immigrants from the same origin countries in the same reception centre, then the dynamics of entry and exit may vary between centres. As it stands, our contribution has to be seen as a case study offering some material results on the undocumented trajectories of migrants in a country with large migratory flows. The next step would be to extend such investigation to all migrants entering Italy, but we are not aware of the existence of such data at this time.
the number of untraceable individuals among the total number of asylum applications, meaning they underestimate the phenomenon because they do not consider those who
leave before submitting an application.27 Migrants may leave the centre in large
numbers because they do not want to stay in Italy, the country being used mostly as an entry gate to Europe due to its geographical position. It is often suggested that the Dublin system is inefficient because it does not take into account illegal migrants’ aspirations regarding the country where they really intend to live. As a consequence, the Dublin Regulation is expected to increase illegal migration to countries which are not migrants’ intended destination and subsequently to other countries where they will transit or go to live.
At the same time, we cannot confirm this assertion because we have no information on the intended location of those migrants who decide to leave the centre. Results of qualitative studies on migrant trajectories suggest that migrants do not always have a clear opinion about where they want to go and sometimes their decision is shaped by networks of smugglers or available opportunities (Collyer 2007; Grillo 2007; Papadopoulou-Kourkoula 2008; Schapendonk 2012; Düvell 2014; Kuschminder, de Bresser, and Siegel 2015; Valenta, Zuparic-Iljic, and Vidovic 2015). Whether migrants stay in the reception centre after arriving in Italy may also depend on their financial resources. If migrants use all their savings to cover the cost of the risky journey to Europe they may be stuck in the reception centre, no matter what their previous plans were. Finally, the leaving decision may depend on the migrants’ networks in destination countries.
Information on the intended location and on migrant networks would undoubtedly be useful in explaining the different trajectories of migrants from different countries of origin. Collecting data on the complete trajectory of migrants, from their departure to their stay in the migrants’ centre to their final destination, is definitely the next challenge.
6. Acknowledgements
We are indebted to Jakub Bijak, the associate editor, three anonymous reviewers, Cris Beauchemin, and seminar participants at the INED Monday seminar held in Paris in March 2016 for their very helpful remarks and suggestions on a previous draft. We also thank Alberto Nilo Domanico, Giuseppe Facino, and Francesco Tipaldi for their help in collecting data, and Catriona Dutreuilh for the proofreading. Any remaining errors are ours.
27 Our results also underestimate the phenomenon because many illegal migrants try to leave Italy even before
References
Ambrosetti, E. and Cela, E. (2015). Demography of race and ethnicity in Italy. In:
Saenz, R., Rodriguez, N., and Embrick, D. (eds.).The international handbook of
the demography of race and ethnicity. London: Springer: 457–482.doi:10.1007/ 978-90-481-8891-8_22.
Bloch, A., Sigona, N., and Zetter, R. (2011). Migration routes and strategies of young
undocumented migrants in England: A qualitative perspective. Ethnic and
Racial Studies 34(8): 1286–1302.doi:10.1080/01419870.2011.560276.
Bonifazi, C. (2013).L’Italia delle migrazioni. Bologna: Il Mulino.
Bonifazi, C. (2017).Migrazioni e integrazioni nell’Italia di oggi. Rome: IRPPS.
Bonifazi, C. and Strozza, S. (2017). Le migrazioni internazionali nei paesi meridionali dell’Unione Europea: Continuità e cambiamenti, prima e dopo la crisi. In:
Ferragina, E. (ed.). Rapporto sulle economie del Mediterraneo. Bologna: Il
Mulino.
Caritas (2015).Dossier statistico immigrazione 2015. Rome: IDOS.
Carling, J. (2007). Unauthorized migration from Africa to Spain. International
Migration 45(4): 3–35.doi:10.1111/j.1468-2435.2007.00418.x.
Chiuri, M.C., De Arcangelis, G., D’Uggento, A.M., and Ferri, G. (2004). Illegal immigration into Italy: Evidence from a field survey. Fisciano: Centre for Studies in Economics and Finance, University of Salerno (Working Paper 121).
http://www.csef.it/WP/wp121.pdf.
Chiuri, M.C., De Arcangelis, G., D’Uggento, A.M., and Ferri, G. (2007). Features and expectations of illegal immigrants: Result of a field survey in Italy. Torino: Centre for Household, Income, Labour and Demographic Economics, University
of Torino (Working Paper 1/2007). http://www.child.carloalberto.org/images/
wp/child01_2007.pdf.
Chiuri, M.C., De Arcangelis, G., D’Uggento, A.M., and Ferri, G. (2008). L’immigrazione irregolare in Italia: Alcune caratteristiche socio-economiche. Studi Emigrazione 169: 159–179.
Collyer, M. (2007). In-between places: Trans-Saharan transit migrants in Morocco and
the fragmented journey to Europe. Antipode 39(4): 668–690. doi:10.1111/j.
Commissione Nazionale per il diritto di asilo (2016). Quaderno statistico per gli anni 1990–2016: Richieste di asilo [electronic resource]. Rome: Dipartimento per le
libertà civili e l’immigrazione. http://www.libertaciviliimmigrazione.dlci.
interno.gov.it/sites/default/files/allegati/quaderno_statistico_per_gli_anni_1990-2016_.pdf.
Conflict Barometer (2013–2014). Annual reports. Heidelberg: Heidelberg Institute for
International Conflict Research (HIIK).
Crawley, H., Duvell, F., Sigona, N., McMahon, S., and Jones, K. (2016). Unpacking a rapidly changing scenario: Migration flows, routes and trajectories across the
Mediterranean. Coventry: MEDMIG (Research Brief 01). http://www.medmig.
info/research-brief-01-unpacking-a-rapidly-changing-scenario/.
Düvell, F. (2014). Transit migration in the European migration spaces: Politics,
determinants and dynamics. In: Düvell, F.C. (ed.).Transit migration in Europe.
Amsterdam: Amsterdam University Press: 209–236.
Fine, J.P. and Gray, R.J. (1999). A proportional hazards model for the subdistribution
of a competing risk. Journal of the American Statistical Association 94(446):
496–509.doi:10.1080/01621459.1999.10474144.
Grillo, R. (2007). Betwixt and between: Trajectories and projects of transmigration. Ethnic Migration Studies 33(2): 199–217.doi:10.1080/13691830601154138. Guiraudon, V. (2018). The 2015 refugee crisis was not a turning point: Explaining
policy inertia in EU border control.European Political Science 17(1): 151–160.
doi:10.1057/s41304-017-0123-x.
Hinchliffe, S.R. and Lambert, P.C. (2013a). Flexible parametric modeling of
cause-specific hazards to estimate cumulative incidence functions. BMC Medical
Research Methodology 13(13): 1–14.
Hinchliffe, S.R. and Lambert, P.C. (2013b). Extending the flexible parametric survival
model for competing risks.Stata Journal 13(2): 344–355.
ISMU (2018). Protezione internazionale: Dati [electronic resource]. Milano:
Fondazione Iniziative e Studi Sulla Multietnicità. http://www.ismu.org/
richiedenti-asilo-e-rifugiati-dati/.
Italian Ministry of Interior (2015). Presenze dei migranti nelle strutture di accoglienza in Italia, Scheda d’approfondimento [electronic resource]. Rome: Ministero
dell’Interno.http://www.interno.gov.it/it.
Kasparek, B. (2016). Complementing Schengen: The Dublin system and the European
border and migration regime. In: Bauder, H. and Matheis, C. (eds.).Migration,
diasporas and citizenship: Interventions and solutions. Hampshire: Palgrave Macmillan: 59–78.
Kuschminder, K., de Bresser, J., and Siegel, M. (2015). Irregular migration routes to Europe and factors influencing migrants’ destination choices. Maastricht: Maastricht Graduate School of Governance (Report 2015).
Leo, L. (2014). Aspetti critici del Sistema di Protezione Internazionale in Italia.
Bologna: ASGI (Report February 2014). http://www.asgi.it/wp-content/uploads/
2015/03/report-febbraio-2014.pdf.
Papadopoulou-Kourkoula, A. (2008). Transit migration: The missing link between
emigration and settlement. Hampshire: Palgrave Macmillan. doi:10.1057/ 9780230583801.
Royston, P. and Parmar, M.K.B. (2002). Flexible parametric proportional-hazards and proportional-odds model for censored survival data, with application to
prognostic modeling and estimation of treatment effects. Statistics in Medicine
21(15): 2175–2197.doi:10.1002/sim.1203.
Schapendonk, J. (2012). Turbulent trajectories: African migrants on their way to the
European Union.Societies 2(2): 27–41.doi:10.3390/soc2020027.
Schapendonk, J. and Steel, G. (2014). Following migrant trajectories: The im/mobility
of sub-Saharan Africans en route to the European Union. Annals of the
Association of American Geographers 104(2): 262–270.doi:10.1080/00045608. 2013.862135.
Schuster, L. (2005). The continuing mobility of migrants in Italy: Shifting between
places and statuses. Journal of Ethnic and Migration Studies 31(4): 757–774.
doi:10.1080/13691830500109993.
Toshkov, D.D. (2014). The dynamic relationship between asylum applications and
asylum recognition rates.European Union Politics 15(2): 192–214.doi:10.1177/
UNHCR (2015). Refugees/migrants emergency response: Mediterranean [electronic
resource]. Geneva: UNHCR. http://data.unhcr.org/mediterranean/regional.
php#_ga=1.38078819.1326910167.1451554920.
UNHCR (2017). Global trends: Forced displacement in 2016. Geneva: UNHCR.
http://www.unhcr.org/5943e8a34.pdf.
UNHCR (2018). Mediterranean situation: Operational portal, refugees’ situation
[electronic resource]. Geneva: UNHCR. http://data2.unhcr.org/en/situations/
mediterranean.
Valenta, M., Zuparic-Iljic, D., and Vidovic, T. (2015). The reluctant asylum-seekers:
Migrants at the southeastern frontiers of the European migration system.Refugee
Survey Quarterly 34(3): 95–113.doi:10.1093/rsq/hdv009.
Wijers, G.D.M. (2011). The reception of Cambodian refugees in France. Journal of
Refugee Studies 24(2): 239–255.doi:10.1093/jrs/fer008.
Wissink, M., Düvell, F., and van Eerdewijk, A. (2013). Dynamic migration intentions and the impact of socio-institutional environments: A transit migration hub in
Turkey. Journal of Ethnic and Migration Studies 39(7): 1087–1105.