Ensemble Numerical Modeling Approach with Social
Network Information to Optimize Flood Forecasting
Pin-Hao Liao1, Dong-Sin Shih2
1 No.250, Guoguang Rd., South Dist., Taichung City 402, Taiwan (R.O.C.)
Pin-Hao Liao:[email protected]
Abstract.
The rivers in Taiwan are steep, the surface runoff is rushed into ocean quickly with high speeds and large discharges. When the typhoons hit Taiwan with heavy rain, how to predict correct peak time and peak stage of rivers is the most important aim in this research. Taiwan Typhoon and Flood Research Institute will produce a rainfall forecasting every six hours for disaster warning, according to different physical parameters setting. The research site, Xiuguluan River is steepest one of Taiwan central rivers. By cross section data、land use、slope、soils and the rainfall forecasting, we can get results of each member by integrating the physically based on model HEC-HMS and WASH123D.
The research reveals that ensemble numerical modeling can predict precise peak stage of the river by analysis and correction by machine learning system TensorFlow. As for peak time forecasting, it becomes accurate by making use of the open social network information such as facebook、network news、PTT discussion to improve. Moreover, no matter peak time or peak stage, it has highly variation in members. In other words, no member is always the best of typhoons. But we can use the probability flood forecasting to predict and get the best results.
Keywords : Social Network Information、WASH123D、TensorFlow、Flood Forecasting、Typhoon、Xiuguluan River、Taiwan
Engineering
EPiC Series in Engineering
Volume 3, 2018, Pages 1201–1213
HIC 2018. 13th International Conference on Hydroinformatics
The paper is divided into five main sections. Chapter 1 provides an introduction of the paper. Chapter 2 presents the methodology of the paper. Chapter 3 gives the information about research site. Chapter 4 describes the results and discussion. Finally, chapter 5 outlines the conclusions of the paper. Each section illustrates below:
1.1 Chapter 1 Introduction
• Research motive and purpose
Based on the statics of EM-DAT (Emergency Events Database) from 2013 to 2016, the floods killed thousands of people every year all over the world. Taiwan, which is one of the most vulnerable countries can’t be spared from it. According to the Disaster Management White Paper released by the government, there are 83 agricultural disasters from 2010 to 2014. Among them, 49 agricultural disaster events was caused by high intensity rainfall. These events lost about 29.88 billion, 91% of total agricultural loss in the years. Therefore, once we can deal with floods well, we can save a lot of agricultural loss and keep everyone safe in the rainy season.
In Taiwan, the rainy season is from May to October. Typhoons are the most common type that causes high intensity rainfall. Moreover, the rivers in Taiwan are steep, the surface runoff is rushed into ocean quickly with high speeds and large discharges. When the typhoons hit Taiwan with the heavy rain, how to predict correct peak time and peak stage of rivers is the most important aim in this research.
• Literature review
As talking about the numerical weather prediction, the most important of all is choosing a precise rainfall forecasting result. (H.L. Cloke et al., 2009) In Taiwan, it has begun an experiment named TAPEX since 2010. This ensemble forecast experiment covers different ensemble members based on different severe physical setting. It’s said that this forecasting performs better than other traditional methods. Because single modeling result covers some uncertainties, what’s better is to develop an ensemble rainfall forecasting which contains members with different situations. (Yen-Chu Chen et al., 2014)
First, we have to consider the rainfall-runoff simulation. The paper suggests the SCS curve number method which contains physical meaning. (Krishan P.Singh et al., 1982) Then, some papers recommend the fixed SCS method for Taiwan, including antecedent moisture conditions、soil group types、the land use and so on. (J. D. Cheng et al., 1996、Szu-Ying Chu et al., 2007) Besides, we can take GIS as a tool to help determine the curve number for each sub-basin. (Ping-Cheng Hsieh et al., 2008、 Te-Hsing Chang et al., 2009)
Second, we need a physical model to run river flood routing. The first paper who used the ensemble numerical method coupled WASH123D model says that we can get a more correct flood forecasting results if we got a more precise rainfall forecasting first. (Ling-Feng Hsiao et al., 2013) Then, people begin to combine ensemble numerical method with different AI tools, including ANN、ANFIS、
Ensemble Numerical Modeling Approach with Social Network ... P.-H. Liao and D.-S. Shih
DENFIS and so on. (Dong-Sin Shih et al., 2014、Lan Yu et al., 2014、Lloyd Collings et al., 2017)
Third, how to correct the forecast results? In addition to the tools above, what about machine learning system? Since Google opened source from 2015, it has been more than 14,000 people to use it. (Mart´ın Abadi et al., 2015、2016) Maybe when taking account of the system uncertainties, we can improve it by TensorFlow.
Forth, there are a lot of social network information on the Internet including facebook、network news、PTT discussion and so on. It’s relevant to rainfall. (Chi-Tai Hsieh et al., 2017) Maybe we can take it to improve the peak time forecast.
1.2 Chapter 2 Methodology
• Rainfall-runoff simulation
Taiwan Typhoon and Flood Research Institute produces a new rainfall forecast every six hours which includes 28 ensemble members based on different physical setting. For data integrity, we focus on analyzing 22 ensemble members including
M01、M02、M03、M04、M05、M06、M07、M08、M09、M10、M11、M12、
M13、M14、M15、M17、M18、M19、M21、M23、M24、M26 in the end. In this research, we choose strong typhoon events in the year 2014、2015、2016 which caused severe disasters in the east part of Taiwan. Then, we take the strong typhoons in the year 2016 to test.
Table 1 Typhoon events
Year Typhoon Name Alarming Time in Taiwan 2014 MATMO 07/21 17:30 ~ 07/23 23:30 2014 FUNG-WONG 09/19 08:30 ~ 09/22 08:30 2016 NEPARTAK 07/06 14:30 ~ 07/09 14:30 2016 MERANTI 09/12 23:30 ~ 09/13 08:30
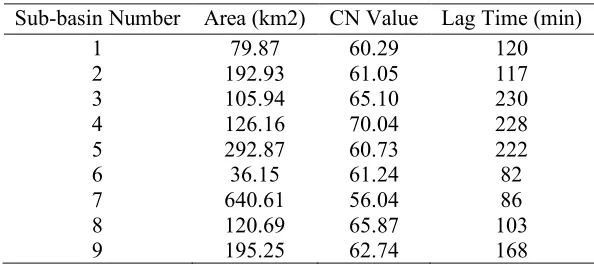
After we collect all the rainfall forecasting data, we take them as input into rainfall-runoff model HEC-HMS to simulate the surface runoff of each sub-basin. The area of the research watershed is 1790.46 km2. We divided the watershed into 9 sub-basins based on the river junctions. Each sub-basin flows into a cross session of main Xiuguluan river in the end. As for the physical coefficients set in the HEC-HMS, we need to know antecedent moisture conditions、soil group types、the land use、slope of each sub-basin to determine the CN value and lag time. We will mention it at the next chapter about topographic information. Most important of all, we ignore the mountains because no survey data and assume the CN values constant, no changing as time series in order to reduce the system complexity.
Ensemble Numerical Modeling Approach with Social Network ... P.-H. Liao and D.-S. Shih
Table 2 Physical coefficients of sub-basins
Sub-basin Number Area (km2) CN Value Lag Time (min) 1 79.87 60.29 120 2 192.93 61.05 117 3 105.94 65.10 230 4 126.16 70.04 228 5 292.87 60.73 222 6 36.15 61.24 82 7 640.61 56.04 86 8 120.69 65.87 103 9 195.25 62.74 168
• River flood routing
Furthermore, we need a numerical physical model to calculate river routing. We choose WASH123D. (WAterSHed Systems of 1-D Stream-River Network, 2-D Overland Regime, and 3-D Subsurface Media) By two stage stations, Yuli Bridge and Ruisui Bridge, we can calibrate all the physical coefficients above.
Table 3 River routing series
Main cross section Number Sub-basins
1 Sub-basin 9 flows into main river 35 Sub-basin 8、7、6 flow into main river 39 Yuli Bridge calibration
62 Sub-basin 5 flows into main river 80 Sub-basin 4 flows into main river 88 Sub-basin 3 flows into main river 94 Ruisui Bridge calibration 95 Sub-basin 2 flows into main river 132 Sub-basin 1 flows into main river 134 Main river flows into the sea
• Combine with social network information and correct results
From calibration, there is a similar trend between rivers hydrographs and social network information. So we could take it as one of the ensemble member for predicting the peak time.
Finally, we combine 22 river routing results with social network information. From them, we can analyze the variation of error for each member. Then, we construct a loss function for each member by using TensorFlow in order to find out the error trends. And we can make good use of them to fix the error in the future events.
Ensemble Numerical Modeling Approach with Social Network ... P.-H. Liao and D.-S. Shih
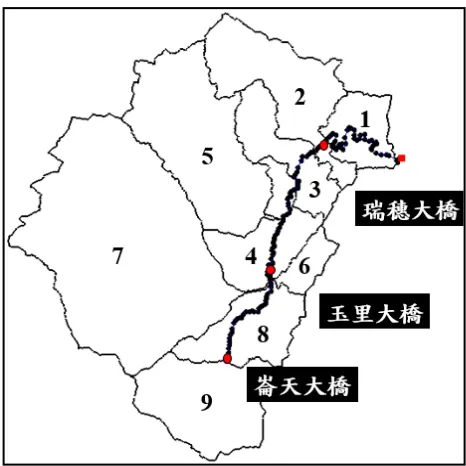
Figure 1 Model constructed location illustration
1.3 Chapter 3 Research Watershed
• Introduction about Xiuguluan River
There are five main tributaries in Xiuguluan River which is the steepest one in 24 central rivers. Choosing it as research watershed, there are two reasons. First, steep slope represents less emergency time. Second, the east part of Taiwan usually become the first region as the typhoon hit. That’s why we choose Xiuguluan River.
From the picture below, you can see that there are some lack of station if we all take tributaries into consider. That’s why we divided Xiuguluan River into 9 sub-basins.
• Topographic information
As we discussed above, if we want to use SCS method. We need some topographic information.
First, it’s usually wet in the rainy season in Taiwan. We assume the antecedent moisture condition is AMC II. Then, we have to collect and summarize the soil group types、the land use of each sub-basin. Finally, by using the table released by government, we can get the CN values of each sub-basin.
Table 4 Sub-basins soil types
Sub-basin Number 9 8 7 6 5 4 3 2 1 SCS soil type A 8% 6% 2% 0% 0% 4% 1% 9% 0% SCS soil type B 77% 73% 98% 89% 74% 72% 93% 90% 96% SCS soil type C 15% 21% 0% 11% 26% 24% 6% 1% 4%
Ensemble Numerical Modeling Approach with Social Network ... P.-H. Liao and D.-S. Shih
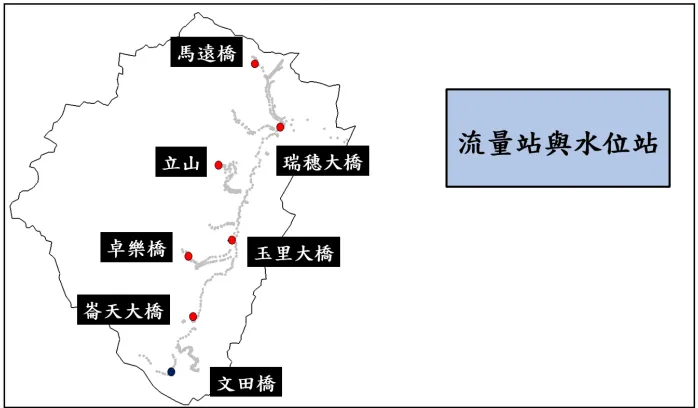
Figure 2 Hydrologic stations in Xiuguluan River
• Hydrologic analysis
Different runs of the typhoon MATMO、FUNG-WONG、NEPARTAK, take RMSE、PE(Peak rainfall Error)、PT(Peak Time error) as standard to assess the rainfall. We can select the best member of each forecasting results.
From the results, there is no best member for all typhoon events, in other words, no member is always best. On the other hand, it’s said that M03、M04、M12 perform well overall, M14、M15 are good at predicting peak rainfall, M23、M24 are good at predicting peak time.
Table 5 Rainfall analysis (the number of each member performs best)
1.4 Chapter 4 Results and Discussion
• Calibration - ensemble model
o Typhoon MATMO
All Station M01 M02 M03 M04 M05 M06 M07 M08 M09 M10 M11 M12 M13 M14 M15 M17 M18 M19 M21 M23 M24 M26 RMSE 1 1 4 4 1 0 0 0 0 0 0 4 0 0 0 0 1 1 1 0 2 2
PE 1 1 0 0 1 1 1 0 0 0 0 2 2 3 3 1 0 2 2 2 1 0 PT 1 4 3 5 5 5 3 3 4 2 3 4 3 5 5 2 2 1 1 7 7 2
Ensemble Numerical Modeling Approach with Social Network ... P.-H. Liao and D.-S. Shih
o Typhoon FUNG-WONG
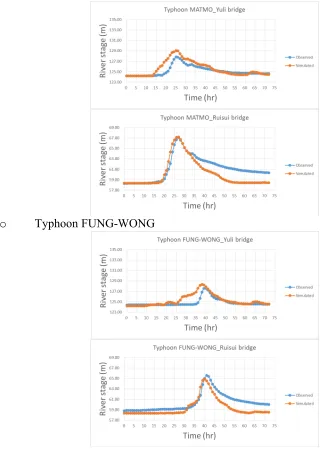
Figure 3 Ensemble model calibration results
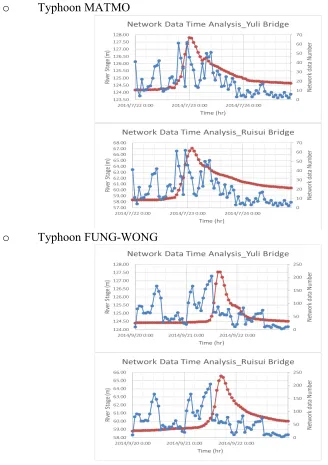
The calibration mainly focus on typhoon MATMO and FUNG-WONG at two river stage stations. At Yuli bridge, the RMSE is 0.82~0.83. The MAE is 0.48~0.53. The PE is 0.63~0.94%. The PT is 0~1(hr).At Ruisui bridge, the RMSE is 1.26~1.56. The MAE is 1.11~1.21. The PE is 0.16~1.11%. The PT is 0~1(hr). Furthermore, you can find similar trends between river stages and social network information.
• Calibration - social network information
Ensemble Numerical Modeling Approach with Social Network ... P.-H. Liao and D.-S. Shih
o Typhoon MATMO
o Typhoon FUNG-WONG
Figure 4 Social network information variation with river stages
• Modification
Typhoon NEPARTAK hit Taiwan in the year 2016, we can use it to modify the ensemble model. The original bar means that the members direct results compared with the observed values, while the fixed bar means that using TensorFlow to correct the model compared with the observed values in the following. The figures show the absolute error between simulated value and observed value.
Ensemble Numerical Modeling Approach with Social Network ... P.-H. Liao and D.-S. Shih
At Yuli bridge station, using TensorFlow will increase error 0~22 hours or decrease error 1~4 hours. As for Ruisui bridge station, it will increase error 3~17 hours or decrease error 2~6 hours.On the other hand, it’s very good in predicting the peak river stage. At Yuli bridge station, using TensorFlow will only decrease error 0.18~1.46 meters. As for Ruisui bridge station, it will only decrease error 2.39~6.63 meters.
Figure 5 Peak time prediction results of typhoon NEPARTAK
Ensemble Numerical Modeling Approach with Social Network ... P.-H. Liao and D.-S. Shih
Figure 6 Peak stage prediction results of typhoon NEPARTAK
So, most important of all, you can find that it’s better to forecast peak time directly and forecast peak stage after fixed by TensorFlow. Then, we take typhoon MERANTI to test and run flood forecasting.
According to the probability flood forecasting results. You can find the observed values are covered by ensemble members. It’s precise in peak stage forecasting. On the other hand, it’s not precise enough in peak time forecasting.
• Flood forecasting results in typhoon MERANTI o Peak Time flood forecasting Results
Table 6 flood forecasting results of peak time prediction in typhoon MERANTI
Yuli Bridge
Time 0~6小時 6~12小時 12~18小時 18~24小時 大於24小時
Number of members 0 0 6 6 2
Probability 0% 0% 43% 43% 14%
16
Ensemble Numerical Modeling Approach with Social Network ... P.-H. Liao and D.-S. Shih
o Peak Stage flood forecasting Results
Table 7 flood forecasting results of peak stage prediction in typhoon MERANTI
• Discussion
o How to do the flood forecasting is the best way in the future?
There is no member always performs well. If we take both Yuli Bridge and Ruisui Bridge into consider, the best member is M15 in time prediction, M18 in stage prediction. However, the events for training is too less to perform better results.
In the future, when it comes to river peak stage prediction, we can do over some dangerous stage on how much probability by these members showing after we have used TensorFlow to fix them. Just like what’s we doing now. As for peak time prediction, maybe we can combine social network information with different members based on different weights to fix the peak time results. Maybe that will be better. o Why the peak time prediction performs worse, peak time prediction performs better?
From the year 2014 to 2015, the typhoon events caused severe disasters only two, too less events may affect the performance. And, you can find peak rainfall time is not precise in rainfall forecasting originally. That’s why it makes sense that peak time prediction performs worse. Unfortunately, machine learning can’t improve it in this case. But why river peak stage prediction performs well? Because we focus on strong typhoon events in the beginning, when another typhoon strong as typhoon NEPARTAK or MERANTI hit Xiuguluan River, it’s reasonable to predict well. But if the model met a small rainfall, maybe it won’t be great.
Ruisui Bridge
Time 0~6小時 6~12小時 12~18小時 18~24小時 大於24小時
Number of members 0 0 2 9 3
Probability 0% 0% 14% 64% 21%
20
Yuli Bridge
Stage 130.10m以上 130.10~129.60m 129.60~127.80m 127.8m以下 Level Level 1 alert exceed Level 2 alert exceed Level 3 alert exceed No warning
Number of members 0 0 0 14
Probability 0% 0% 0% 100%
127.65 Ruisui Bridge
Stage 71.70m以上 71.70~70.20m 70.20~68.00m 68.00m以下
Level Level 1 alert exceed Level 2 alert exceed Level 3 alert exceed No warning
Number of members 0 0 0 14
Probability 0% 0% 0% 100%
65.84
Ensemble Numerical Modeling Approach with Social Network ... P.-H. Liao and D.-S. Shih
1.5 Chapter 5 Conclusions
• Conclusions
o Once the watershed lacked hydrologic information including flows, in other words there are no enough hydrologic stations, it’s a good way to devide all watershed into several sub-basins to simulation of river routing.
o The ensemble numerical modeling method is very good at predicting the peak river stage. Furthermore, using TensorFlow and choosing the suitable typhoon events to train the model can effectively improve the system error for all ensemble numerical model.
o The ensemble numerical modeling method is very poor at predicting the peak time because of lacking enough and correct typhoon events to train the model. It’s helpful combined with social network information.
o There is no member always performs well.
2 Reference
[1] H.L. Clock, F. Pappenberger. (2009). “Ensemble flood forecasting: A review.” Journal of Hydrology.
[2] Yen-Chu Chen, Chou-Chun Chiang, Li-Rung Hwang, Ming-Chang Wu, Lei Feng. (2014). “The Development of Quantitative Precipitation Forecast Techniques.”
[3] Krishan P. Singh, Ph.D., Principal Scientist. (1982). “Runoff conditions for coverting storm rainfall with SCS curve numbers.” SWS Contract Report 288.
[4] J. D. Cheng. (1996). “Effects of Streamflow Generation on Estimation of Peak Flows from Highly Permeable Forecasted Watersheds in Taiwan.” Journal of Soil and Water Conservation,28(3): 17-31.
[5] Szu-Ying Chu, Ping-Cheng Hsieh, Li-Ling Lin. (2007). “Study on the Relationship among Runoff Coefficient, Curve Number and Slope.”
[6] Ping-Cheng Hsieh, Szu-Ying Chu. (2008). “Study on the Runoff Coefficiet and Curve Number in Hou-long Watershed.” Journal of Soil and Water Conservation,40(2): 205-221. [7] Te-Hsing Chang, Shi-Ming Tsai. (2009). ”Analysis of Rainfall-runoff of Shih-men Watershed by using Geographic Information System.” Journal of Taiwan Agricultural Engineering Vol. 55, No4.
[8] Ling-Feng Hsiao et al., (2013). ”Ensemble forecasting of typhoon rainfall and floods over a mountainous watershed in Taiwan.” Journal of Hydrology 506:55-68.
[9] Dong-Sin Shih, Cheng-Hsin Chen, Gour-Tsyh Yeh. (2014). “Improving our understanding of flood forecasting using earlier hydro-meteorological intelligence.” Journal of Hydrology 512:470-481.
[10] Lan Yu, Lloyd Hock Chye Chua, Dong-Sin Shih. (2014). ”Development of An Modified Ensemble Approach for Flood Forecasts.”
[11] Lloyd Collings, Lloyd Hock Chye Chua, Dong-Sin Shih. (2017). “A Neuro-Fuzzy Ensemble Approach To Flood Forecasting.”
[12]Mart´ın Abadi et al. (2015).“Tensorflow : Large-scale Machine Learning on Heterogeneous Distributed Systems.” Preliminary White Paper.
Ensemble Numerical Modeling Approach with Social Network ... P.-H. Liao and D.-S. Shih
[13] Martín Abadi et al. (2016).“Tensorflow:A System for Large-Scale Machine Learning.” 12th USENIX Symposium on Operating Systems Design and Implementation.
[14] Chi-Tai Hsieh et al. (2017).“ A STUDY ON THE APPLICATION OF NETWORK COMMUNITY DATA AND DISASTER MITIGATION.”
Thanks for the ministry of Science and Technology, Taiwan.
Ensemble Numerical Modeling Approach with Social Network ... P.-H. Liao and D.-S. Shih